
Back to Journals » International Journal of Women's Health » Volume 18
Association Between Muscle Quality Index and Depression Symptoms in Women with Breastfeeding History: A NHANES-Based Cross-Sectional Study
Authors Wang C, Zhu Y, Liu L, Li X, Zhu Q, Li R, Li X
Received 14 August 2025
Accepted for publication 28 December 2025
Published 8 January 2026 Volume 2026:18 560770
DOI https://doi.org/10.2147/IJWH.S560770
Checked for plagiarism Yes
Review by Single anonymous peer review
Peer reviewer comments 2
Editor who approved publication: Dr Everett Magann
Chengling Wang, Yi Zhu, Li Liu, Xingchuan Li, Qikun Zhu, Renlan Li,* Xingshu Li*
Department of Obstetrics, The Second Affiliated Hospital of Chongqing Medical University, Chongqing, People’s Republic of China
*These authors contributed equally to this work
Correspondence: Renlan Li, Department of Obstetrics, The Second Affiliated Hospital of Chongqing Medical University, 76 Linjiang Road, Yuzhong Distinct, Chongqing, 400010, People’s Republic of China, Email [email protected] Xingshu Li, Department of Obstetrics, The Second Affiliated Hospital of Chongqing Medical University, 76 Linjiang Road, Yuzhong Distinct, Chongqing, 400010, People’s Republic of China, Email [email protected]
Background: Postpartum depression (PPD) remains a significant challenge in women’s health. While breastfeeding has been widely recognized as a protective factor against PPD, women with a breastfeeding history are still at risk for depression symptoms. This study aims to explore the relationship between muscle quality index (MQI) and depression symptoms in women with a breastfeeding history.
Methods: This cross-sectional study used data from 481 women with a breastfeeding history from the 2011– 2012 National Health and Nutrition Examination Survey (NHANES). MQI was computed as the ratio of handgrip strength to appendicular skeletal muscle mass. Depression was assessed using the Patient Health Questionnaire-9 (PHQ-9). Logistic regression models were applied to assess the relationship between MQI and depression, controlling for potential confounders, including sociodemographic factors, health status, and lifestyle behaviors. Restricted cubic spline (RCS) analysis was used to examine potential nonlinear associations.
Results: After adjusting for all covariates, lower MQI value was significantly associated with increased depression risk in women with breastfeeding history [P: 0.002, odds ratio (OR) = 0.25, 95% confidential interval (CI): 0.10– 0.65]. Women in the highest MQI quartile had reduced odds of depression compared to those in the lowest quartile (P: 0.003, OR = 0.12, 95% CI: 0.03– 0.44). A nonlinear relationship between MQI and depression was observed, with a critical threshold identified at MQI 3.32. Subgroup analyses revealed a consistent inverse association between MQI and depression across strata of factors such as BMI, smoking status, and income levels.
Conclusion: MQI is associated with depression symptoms in women with a breastfeeding history. This association underscores the importance of integrating physical health markers into mental health risk assessments for more effective early intervention and care.
Keywords: muscle quality index, depression, breastfeeding history, National Health and Nutrition Examination Survey, cross-sectional
Background
As highlighted by the Lancet Commission on Global Mental Health and Sustainable Development, mental health is increasingly recognized as a fundamental human right and holds critical significance in global human development.1 Depression is a prevalent mental health ailment, which always impinge upon individuals’ regular life functions, leading to loss of interests in routine activities and, in the most extreme circumstances, culminating in suicide.2–4 The etiology of depression is multifactorial, involving genetic, physiological, psychological, and social environmental factors.5 Owing to the intricacy of its onset, the clinical management of depression encompasses a multiplicity of modalities such as pharmacological therapy, psychotherapy, and physical therapy, which not only imposes substantial emotional and financial strains on individuals and families but also presents a formidable menace to the progression of global public health.6–8 Early diagnosis and intervention are crucial to improving treatment outcomes, reducing suicide risk, and alleviating the financial impact on affected individuals.9 Consequently, identifying reliable and accessible biomarkers for depression risk identification is imperative.
The muscle quality index (MQI) is defined as the ratio of muscle strength to muscle mass, which serves as an index for gauging muscle quality.10 Former investigations have demonstrated that MQI can prognosticate overall health status, including muscle atrophy, physical impairments, and psychosocial dysfunctions.11–14 Researchers have increasingly focused on exploring the relationship between MQI and depression, particularly in women, given their higher risk of depression than males.15,16 A cohort study found that women with higher MQI levels were less likely to develop depression.17 Similarly, Wang et al12 used weighted logistic regression and subgroup analysis to assess the relationship between MQI and depression risk among non-elderly US adults (aged 20–59 years), revealing that low MQI was a significant risk factor for depression, particularly in non-elderly women. These findings underscore MQI’s potential as a protective factor against depression in females. Building on these findings, it is crucial to explore the connection between MQI and long-term depression risk in specific subgroups, such as women with a history of breastfeeding, a population that may experience unique physical and psychological changes influencing depression outcomes.
Postpartum depression (PPD) is characterized by the manifestation of substantial depressive symptoms or typical depressive episodes during the puerperium.18 It is categorized as a puerperal psychiatric syndrome, which also encompasses postpartum dysphoria and postpartum psychosis.19 Extensive evidence supports a negative association between breastfeeding and the incidence of PPD.20–22 However, mothers with a history of breastfeeding remain at risk for depression (including but not limited to the puerperium) due to various factors. This vulnerability may extend beyond the immediate postpartum period due to the long-term physiological demands of lactation and the chronic stress of parenting. Furthermore, the period following breastfeeding represents a critical window for assessing modifiable physical health markers. Given that MQI has shown predictive value for depression risk in women, the relationship between MQI and depression risk in women with a history of breastfeeding remains underexplored. Several potential mechanisms may explain the observed association. Muscle quality influences glucose metabolism and inflammatory status, which are implicated in neuroendocrine regulation and mood states.23,24 Additionally, adequate muscle function supports physical capacity for childcare activities; poorer muscle quality may thus exacerbate fatigue and reduce resilience to parenting stress, potentially increasing vulnerability to depressive symptoms.
To fill this gap, this study aims to investigate the association between MQI and depression risk in women with a history of breastfeeding, using a representative national sample from the National Health and Nutrition Examination Survey (NHANES).
Methods
Study Population
The data for this study were derived from the NHANES (www.cdc.gov/nchs/nhanes.com), a comprehensive survey administered by the National Center for Health Statistics at the Centers for Disease Control and Prevention (CDC).25 The survey employed a stratified, multistage random sampling method to ensure a representative sample of the national population. Participants underwent comprehensive physical examinations, completed detailed health and nutrition questionnaires, and provided laboratory samples for testing. The analysis incorporated NHANES sample weights to account for the complex survey design and ensure national representativeness. Missing values for continuous and categorical variables were handled using median and mode imputation, respectively. The Ethics Review Board of the National Center for Health Statistics approved the research procedures and the patients’ informed consent was obtained.
We chose the 2011–2012 period due to the available data for the MQI test (2011–2014 cycles) and breastfeeding history (2007–2012 cycles) data overlapped in 2011–2012. A total of 9756 participants were initially enrolled, we exclude: (1) 4856 male participants; (2) 3118 participants without breastfeeding data; (3) 18 participants without PHQ-9 data; (4) 990 participants without MQI data. 481 participants were finally enrolled in this study (Figure 1).
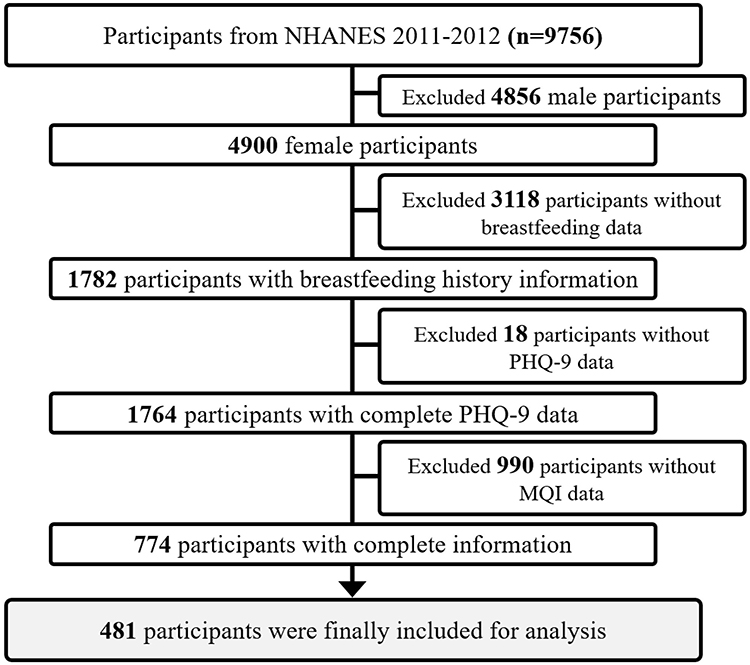 |
Figure 1 The participants’ selection flow chart. |
Assessment of MQI
MQI was the exposure variable of this study. It is calculated via the ratio between the combined handgrip strength (HGS, values from the dominant and non-dominant hand) divided by the total arm and appendicular skeletal muscle mass (ASM).26 HGS was represented by the maximum value recorded from the dominant hand, which was measured using a hand dynamometer, while ASM was evaluated by summing the lean soft tissue across all four limbs, assessed through body composition analysis using dual-energy X-ray absorptiometry (DXA).27 MQI was selected as it provides an integrated measure of neuromuscular efficiency, offering a more physiologically relevant indicator of muscle quality than mass or strength alone.
Assessment of Breastfeeding History
Breastfeeding history is measured via self-reported questionnaires: “did you breast feed your child/any of you children for at least one month?” Female participants who answered “Yes” to this question were considered as having a breastfeeding history.
Assessment of Depression
Depressive symptoms were assessed using the self-administered nine-item Patient Health Questionnaire (PHQ-9), a validated instrument designed to measure the frequency of depressive symptoms over the past two weeks based on DSM-IV criteria.28 The assessment was conducted via computer-assisted interviews administered by trained interviewers at a mobile testing center. Each item on the PHQ-9 is scored on a four-point scale: 0 (“not at all”), 1 (“several days”), 2 (“more than half the days”), and 3 (“nearly every day”), yielding a total score ranging from 0 to 27. A PHQ-9 score of ≥10 was used to classify participants as having clinically relevant depression symptoms, in line with established thresholds.29,30
Covariates Definitions
According to previous researches, we included confounding covariates that may influence the correlation between MQI and risk of depression, including socio-demographic characteristics, lifestyle habits and health conditions.31–33
The socio-demographic characteristics including age, body mass index (BMI), race (Black, Mexican, White, Other), marital status (Married/Living with partner, Never married, Widowed/Divorced/Separated), education level (College graduate or above, Less or equal to High school, Some college or AA degree) and family income (≤$20.000, $20.000-$35.000, $35.000-$75.000, ≥$75.000). Lifestyle variables included alcohol and smoking status. Alcohol consumption was categorized as former, current and never drinkers, and smoking status was categorized as former, current and never smokers. Health conditions included hypertension, hyperlipidemia, and metabolic syndrome (MetS; diagnosed using the ATP criteria).34
Statistical Analysis
To ensure the sample’s representativeness of the broader population, the analysis incorporated sample weights as provided by the official NHANES website. This step was essential to account for the complex multistage cluster sampling design used in NHANES. By applying these weights, the analysis appropriately adjusted for the survey’s design, ensuring that the results accurately reflected the distribution of the population from which the sample was drawn. Missing values for continuous variables were inputted using the existing median values. For categorical variables, missing data were replaced with the mode of the observed values. The weighted continuous variates were expressed as mean (standard deviation, SD) and were compared using the weighted Student’s t-test. The weighted categorical variables were presented as number (percentage, %) and were compared via the chi-squared test.
To explore the association between MQI and depression symptoms in female with breastfeeding history, the univariate and multivariate logistic regression analysis was employed. Three models were established thereby. The Model 1 (crude model) was unadjusted. The Model 2 was adjusted for age, BMI, race, marital status, family income, education level, alcoholic consumption, and smoking status. The Model 3 (fully adjusted model) was further adjusted for hypertension, hyperlipidemia, and metabolic syndrome. MQI was stratified to four levels according to its quartile (Q1: 1.307–2.951; Q2: 2.951–3.323; Q3: 3.323–3.710; Q4: 3.710, 5.16). In addition, the consistency of correlation between categorized MQI and depression in female with breastfeeding history was verified by the linear trend test. Furthermore, the multiple restricted cubic spline (RCS) regression with 5 dots was employed to investigate the nonlinear relationship between MQI and depression in female with breastfeeding history. Moreover, Subgroup analysis was utilized to assess the robustness in correlation between MQI and depression. The continuous variables are classified as categorical with a median division in the subgroup analysis.
All statistical analyses were conducted via the SPSS 26.0 software (SPSS Inc., Chicago, Illinois, USA) and R (Version 4.4.2, https://www.r-project.org/). A two tailed P value less than 0.05 was considered as statistically significant.
Results
Baseline Characteristics
A total of 481 participants were included from the NHANES 2011–2012, representing approximately 8,000,025 citizens in the US. All participants (n = 481) are females who with breastfeeding history, with a weighted average age of 41.72 ± 1.02 years. Among them, 51 (10.6%) participants had a diagnosis of depression. As listed in Table 1, compared with non-depression group, the depression group exhibited increased BMI (P = 0.03), lower education levels (P = 0.04) and family incomes (P = 0.01). Besides, more depression participants had smoking history (P = 0.004), hyperlipidemia history (P < 0.001), and metabolic syndrome history (P = 0.03). The MQI (P = 0.002) values in depression group were significantly lower.
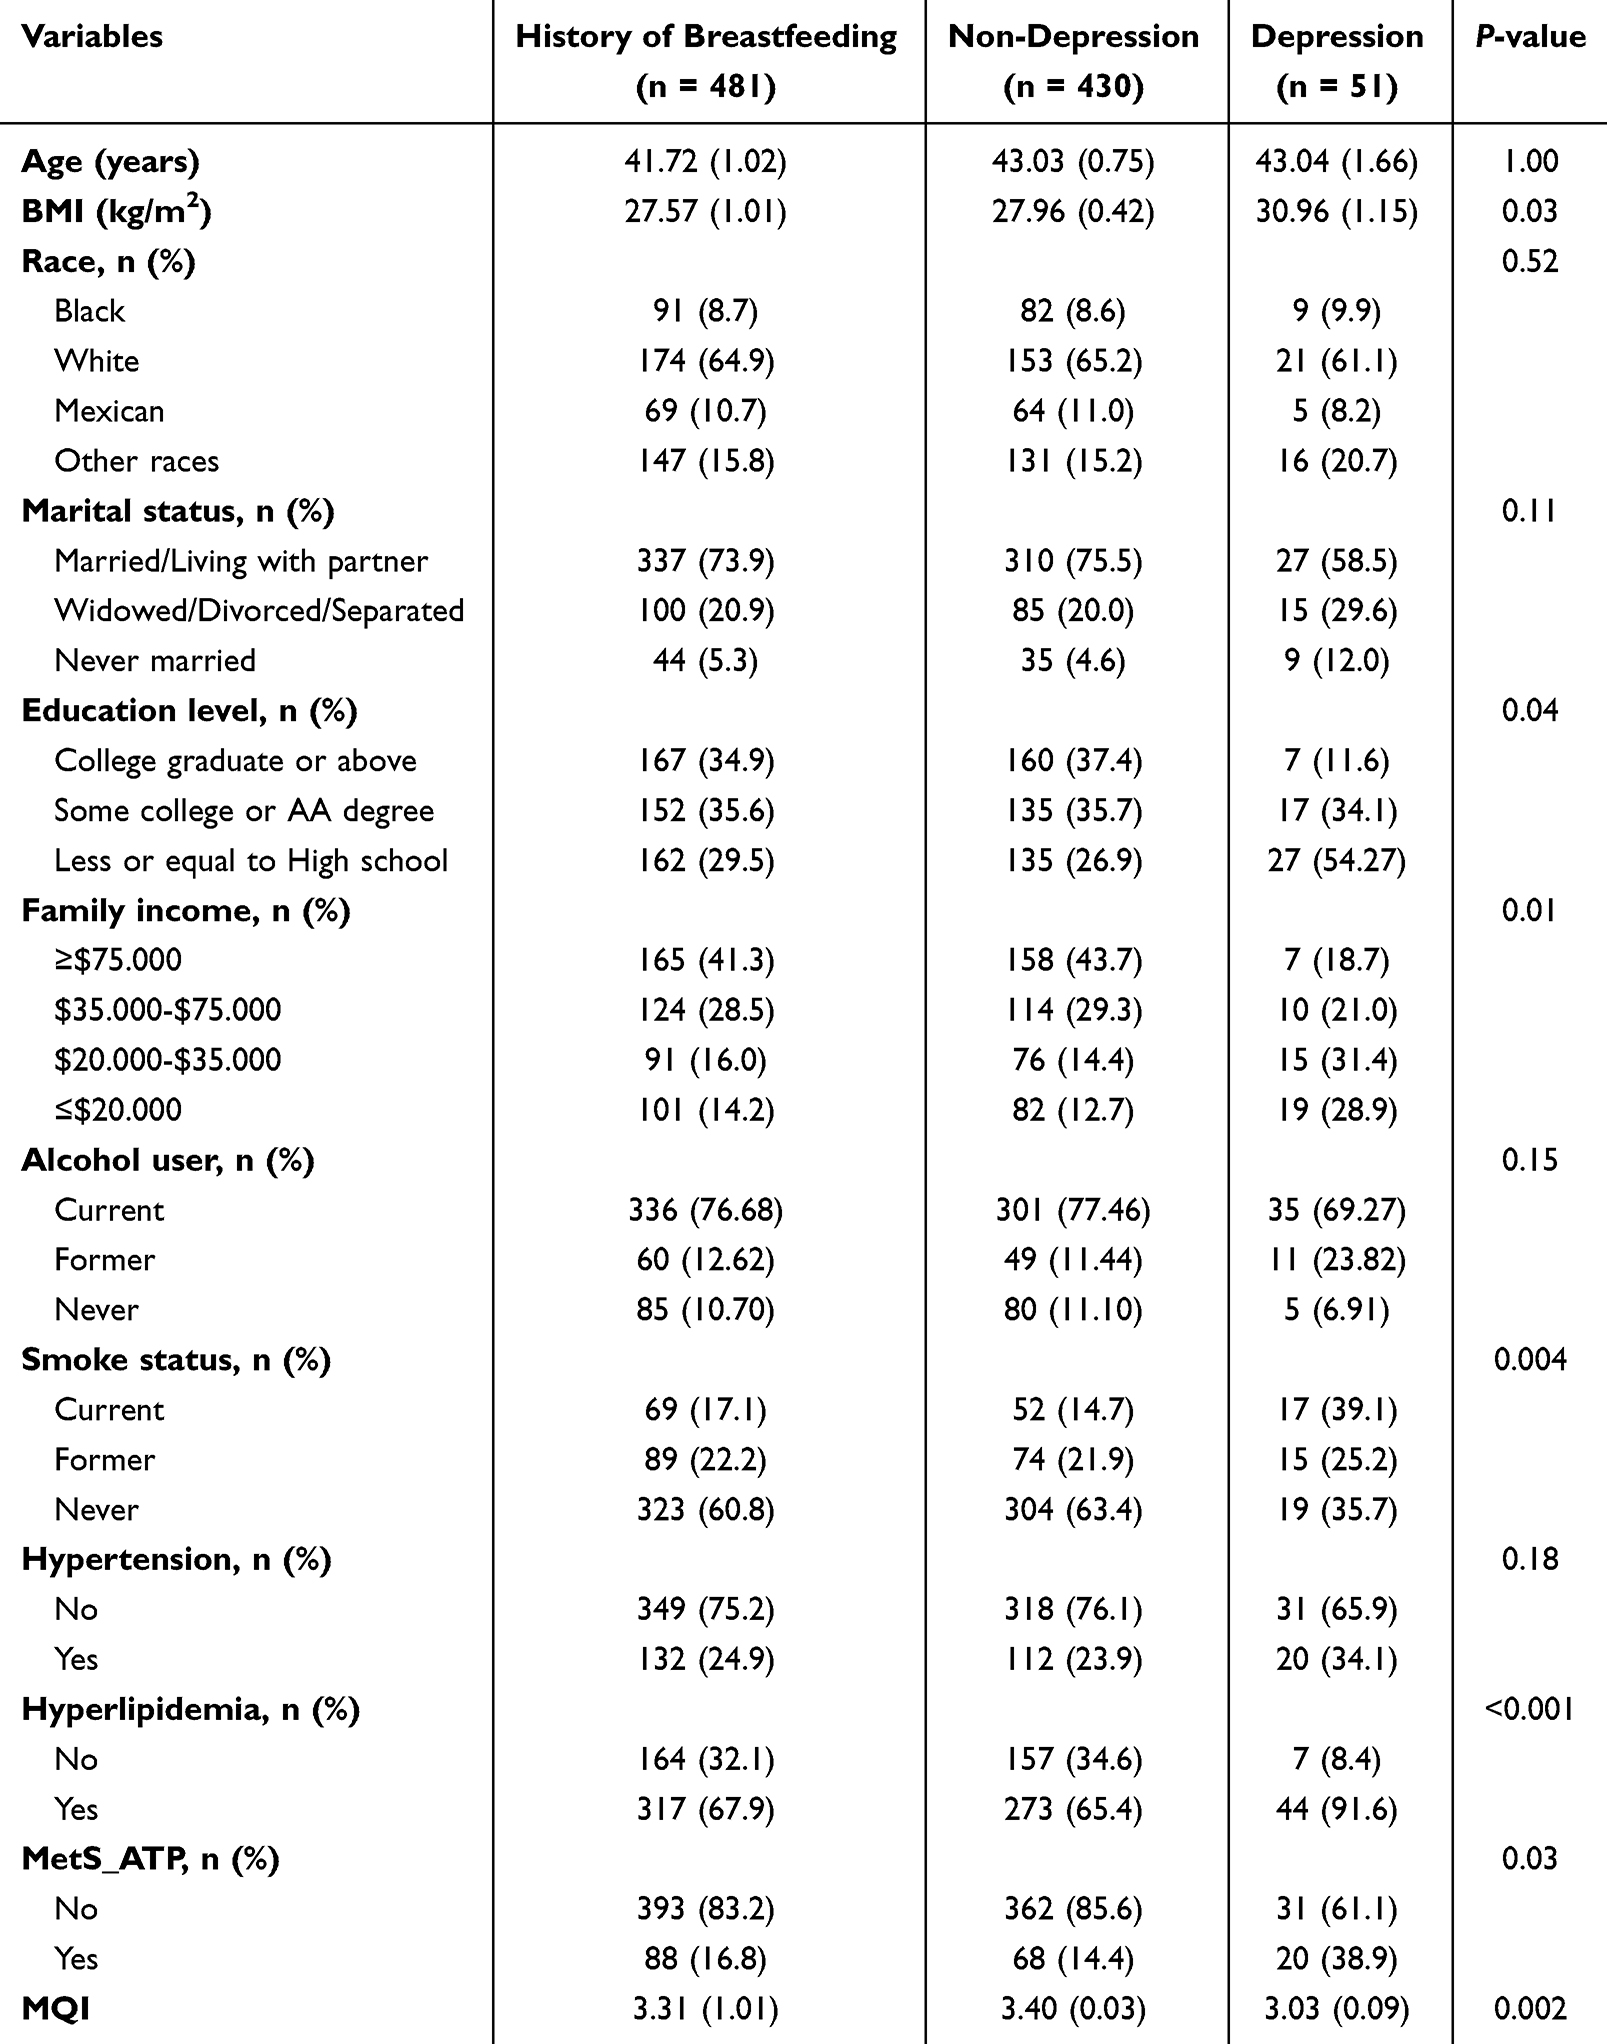 |
Table 1 Baseline Characteristics of Women with Breastfeeding History from the 2011–2012 NHANES Data |
Univariate Logistic Analysis of Depression Related Variables
The result of univariate logistic regression indicated that participants with higher BMI (OR = 1.06, 95% CI: 1.01–1.12), never married (OR = 3.40, 95% CI: 1.30–8.93), education level ≤ high school (OR = 6.50, 95% CI: 1.12–37.77), with hyperlipidemia history (OR = 5.80, 95% CI: 2.31–14.55), and with metabolic syndrome history (OR = 3.77, 95% CI: 1.05–13.47) were positively related to depression, while participants with higher family income ($35.000-$75.000, OR = 0.31, 95% CI: 0.12–0.85; ≥$75.000, OR = 0.19, 95% CI: 0.07–0.50), never smoking (OR = 0.21, 95% CI: 0.08–0.56), and increased MQI (OR = 0.29, 95% CI: 0.14–0.61) were negatively relative (Table 2).
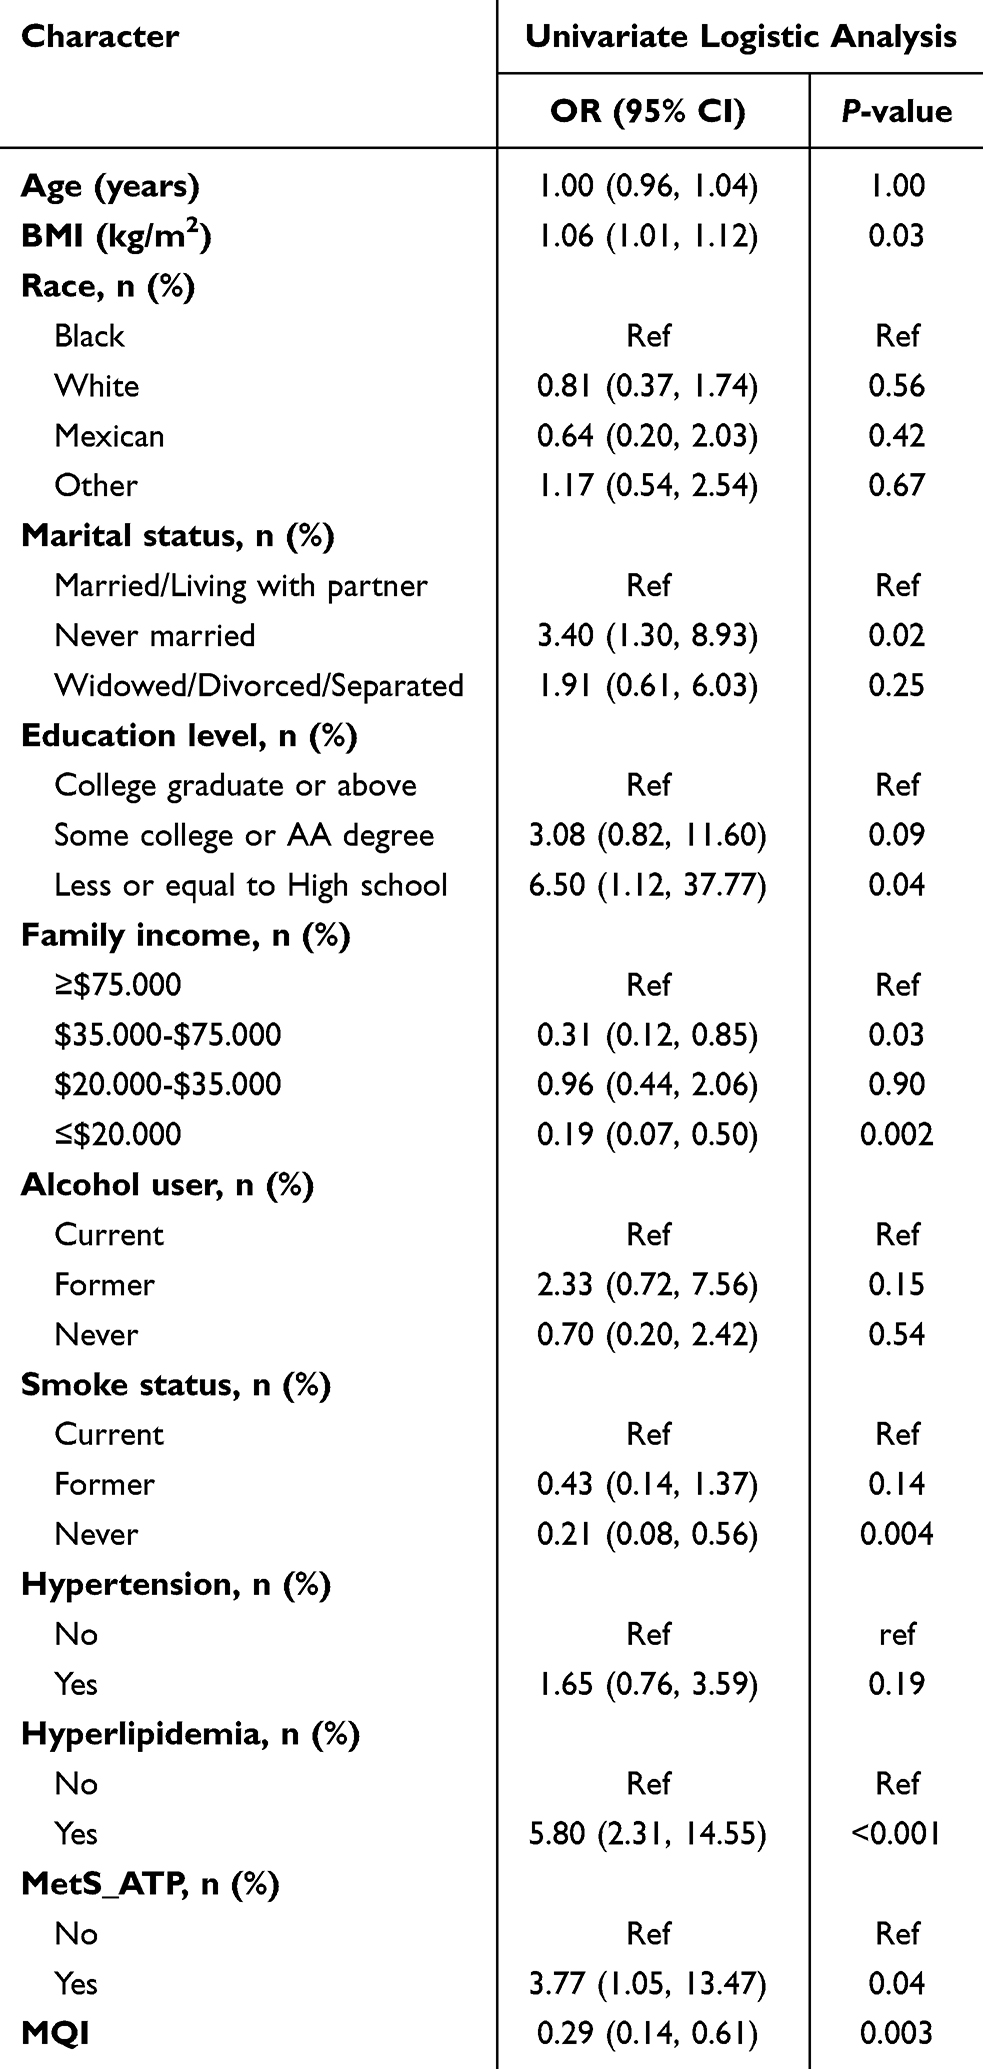 |
Table 2 Univariate Logistic Analysis of the Depression-Related Variables |
Association Between MQI and Depression in Female with Breastfeeding History
Weighted multivariate logistic analysis was conducted to evaluate the association between MQI and depression in female with breastfeeding history (Table 3). When analyzed as continuous variable, Model 1 revealed that lower MQI value (OR = 0.29, 95% CI: 0.14–0.61) was observed to significantly associated with depression in our cohort. When adjusted confounding factors, Model 2 produced consistent results (OR = 0.23, 95% CI: 0.10–0.53). After full adjustment in Model 3, MQI remained the negative association (OR = 0.25, 95% CI: 0.10–0.65). When analyzed using the stratified groups for sensitivity analysis, quarter 4 compared with quarter 1 kept significant differences in both Model 1(OR = 0.12, 95% CI: 0.03–0.49), Model 2 (OR = 0.10, 95% CI: 0.02–0.43), and Model 3 (OR = 0.12, 95% CI: 0.03–0.44), with P values of 0.01, 0.004, and 0.003, respectively. The P for trends in Model 1, Model 2, and Model 3 were 0.001, <0.001, and 0.002, respectively. However, when compared quarter 3 and quarter 2 with quarter 1, there were no significant differences. In RCS analysis, MQI was found to negatively nonlinear associate with depression in female with breastfeeding history (Figure 2). The curve indicates that the inverse association becomes more pronounced below an MQI value of approximately 3.32.
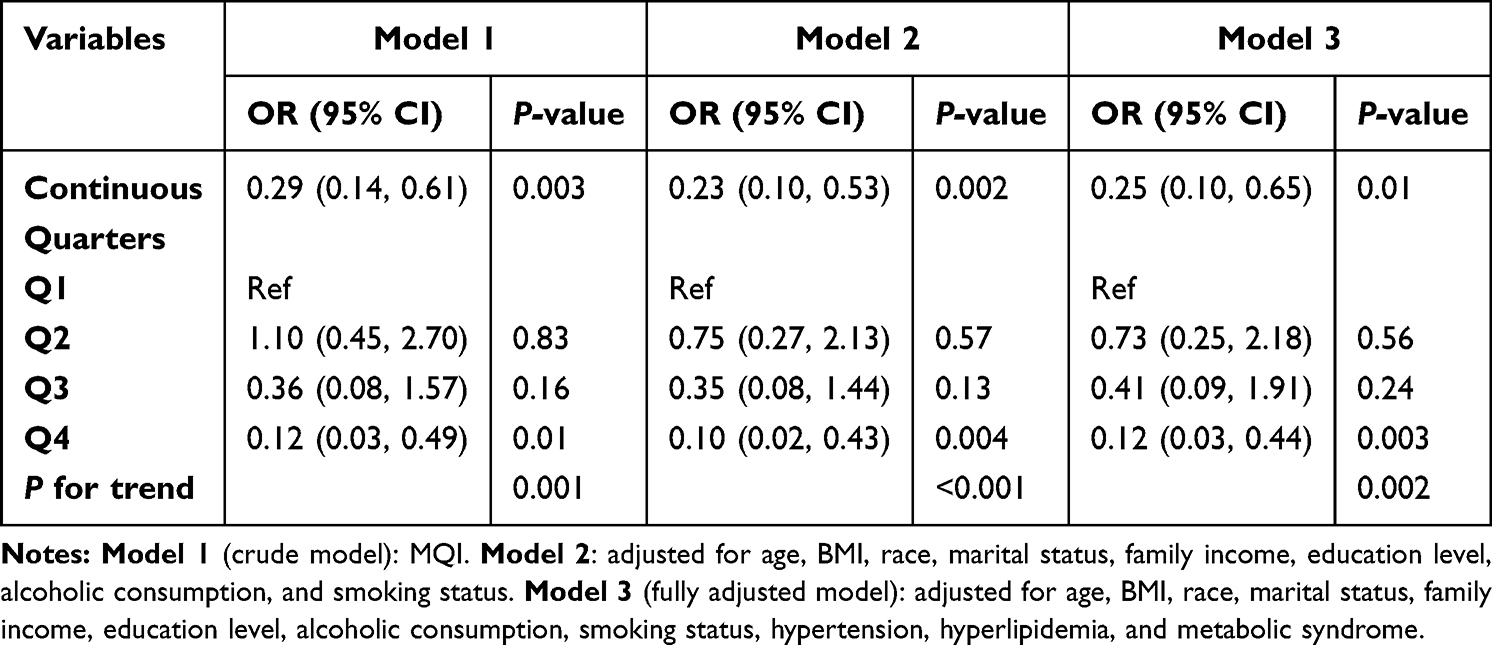 |
Table 3 Multivariable Logistic Analysis Exploring the Association Between MQI and Depression in Female with Breastfeeding History |
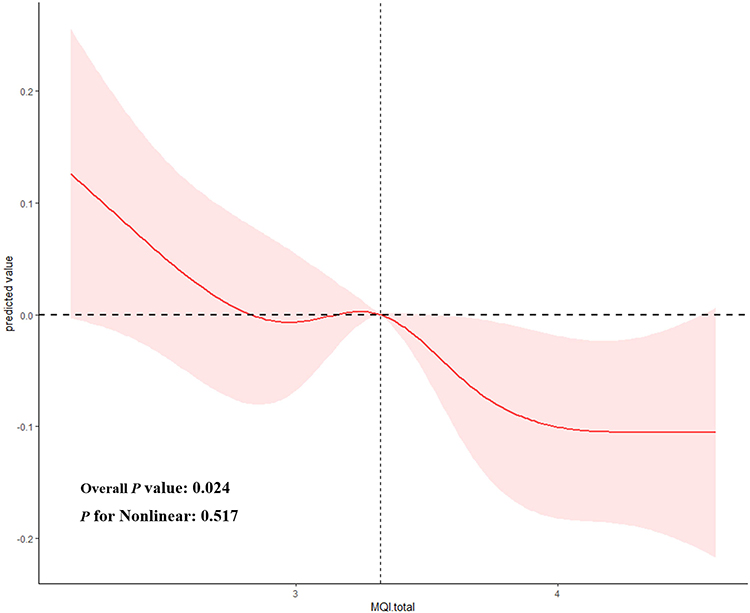 |
Figure 2 The restricted cubic spline (RCS) regression analysis for association between MQI and depression in female with breastfeeding history. |
Subgroup Analyses
Figure 3 shows the subgroup analysis of the association between MQI and depression in female with breastfeeding history. As a result, MQI was found to significantly associated in subgroups such as age ≤ 42 years (OR = 0.33, 95% CI: 0.14–0.77), age over 42 years (OR = 0.26, 95% CI: 0.10–0.70), BMI ≤ 27.4 kg/m2 (OR = 0.16, 95% CI: 0.04–0.65), white race (OR = 0.24, 95% CI: 0.08–0.76), Mexican race (OR = 0.18, 95% CI: 0.04–0.73), marital status in Married/Living with partner (OR = 0.28, 95% CI: 0.09–0.89), marital status in never married (OR = 0.26, 95% CI: 0.08–0.91), family income ≥$75.000 (OR = 0.23, 95% CI: 0.10–0.53), education level is Some college or AA degree (OR = 0.34, 95% CI: 0.12–0.95), education level is Less or equal to High school (OR = 0.34, 95% CI: 0.15–0.77), current alcohol user (OR = 0.24, 95% CI: 0.08–0.71), former alcohol user (OR = 0.23, 95% CI: 0.06–0.88), current smoking (OR = 0.12, 95% CI: 0.05–0.32), former smoking (OR = 0.28, 95% CI: 0.08–0.94), and never smoking (OR = 0.38, 95% CI: 0.17–0.85).
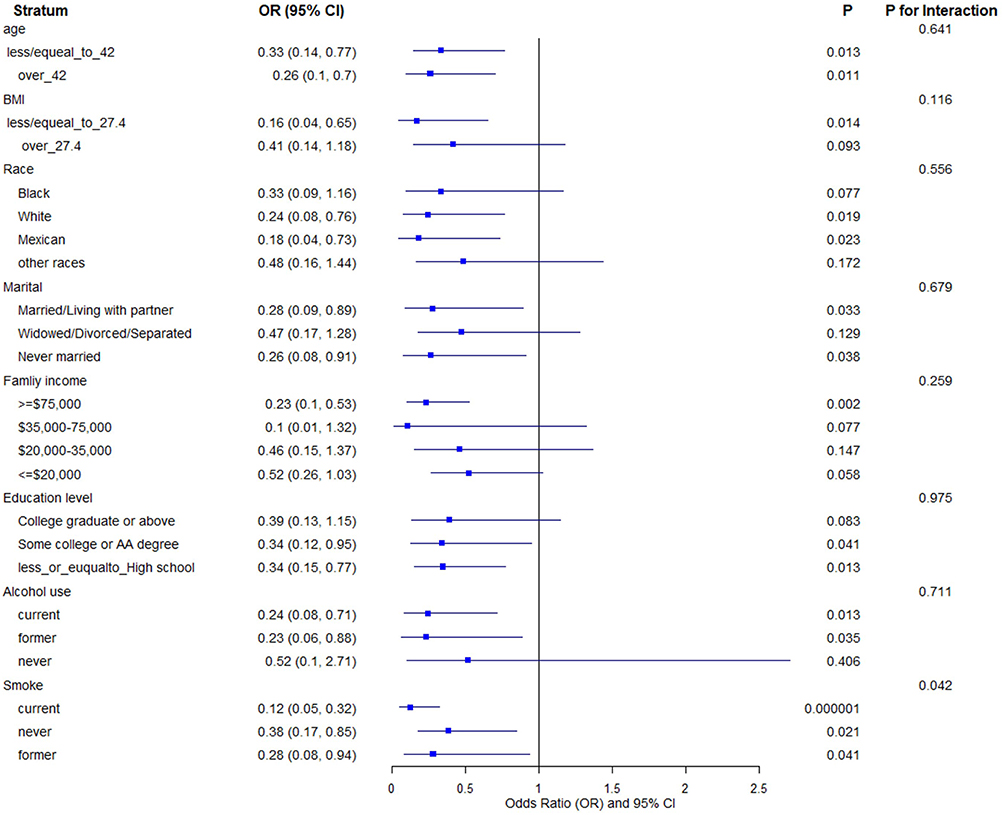 |
Figure 3 Subgroup logistic analysis of the association between MQI and depression in female with breastfeeding history. |
Discussion
Depression is a prevalent and debilitating mental health disorder with significant global implications, and early identification of reliable biomarkers is crucial for effective intervention.35,36 This study aimed to explore the association between MQI and depression symptoms in women with a history of breastfeeding using data from the NHANES 2011–2012, and found that lower MQI values were associated with a higher risk of depression, even after adjusting for various confounding factors.
There has been growing recognition of the importance of maternal health, particularly in the context of PPD. Although breastfeeding has long been established as a protective factor against PPD, it is important to note that this protective effect does not extend to all women, as many continue to face depression symptoms even after the breastfeeding period.37,38 It is essential to explore additional risk factors and biomarkers that may contribute to the development of depression in this population. MQI is a reflection of both muscle mass and muscle function, which are essential for maintaining physical health and psychosocial well-being.39 Several studies have shown that poor muscle quality is associated with various health problems, including depressive symptoms.12,40 This relationship may be partly due to that low muscle quality can lead to physical disability, reduced physical activity, and social isolation, all of which are known risk factors for depression. In more recent researches, lower MQI is found to be associated with an increased risk of depression, particularly among women.17 Nevertheless, the association between MQI and depression risk in women with a history of breastfeeding remains unexplored. Our study contributes to the literature by highlighting MQI was significantly associated with long-term depression in women who have breastfed. In this specific population of women with a breastfeeding history, our findings suggest a potential inverse association between MQI and depression. These preliminary results indicate that MQI may be a marker worth further investigation.
The association between MQI and depression was also influenced by several sociodemographic and lifestyle factors. Women who were unmarried, had lower educational attainment, or had a history of smoking were more likely to experience depression. These findings are consistent with the broader body of research on depression, which often links depression risk to socioeconomic status and lifestyle factors.38 Subgroup analyses further support the robustness of the association between MQI and depression. The negative relationship between MQI and depression was consistent across different age groups, racial backgrounds, marital statuses, and smoking statuses. This suggests that MQI may be a reliable indicator of depression risk for a wide range of women, regardless of their demographic characteristics. Besides, it is noteworthy that in our quartile analysis, a statistically significant reduction in the odds of depression was observed only for women in the highest MQI quartile (Q4) compared to the lowest (Q1). This pattern, where the intermediate quartiles (Q2 and Q3) did not show significant effects, suggests the possibility of a threshold effect, wherein the benefits of muscle quality on mental health may become substantial only beyond a certain level. This observation aligns with the non-linear relationship identified by our restricted cubic spline analysis.
From a clinical perspective, the identified nonlinear relationship and potential threshold (MQI≈3.32), while exploratory, suggest a quantifiable target for potential intervention. If validated prospectively, this threshold could serve as a practical benchmark to identify at-risk individuals and inform the goals of targeted interventions, such as resistance training and nutritional support, aimed at improving muscle quality above this level to potentially mitigate depression risk in this population.
This study has some limitations. First, the cross-sectional design of the NHANES data prevents us from making causal inferences. Although the observed association between MQI and depression is compelling, longitudinal studies are needed to confirm whether improvements in muscle quality can lead to a reduction in depression risk over time. Secondly, both the depression status (outcome) and breastfeeding history (exposure) were based on self-reported measures, which are subject to potential recall and misclassification biases. Additionally, the number of identified depression cases (n = 51) was relatively small. This limited sample size reduces the statistical power of the study, potentially leading to an underestimation of associations, particularly in subgroup analyses, and increases the risk of Type II errors. Lastly, while we controlled for various confounding factors, there may be other unmeasured variables, such as physical activity levels or a history of mental health issues, that could influence the results.
Conclusion
In conclusion, this cross-sectional study provides preliminary evidence of an inverse association between MQI and depression in US women with a breastfeeding history. However, these findings should be interpreted with caution due to the study’s limitations, including its cross-sectional design, limited statistical power, potential unmeasured confounding, and the lack of detailed breastfeeding history. Future prospective studies are needed to confirm this association and explore the underlying mechanisms.
Abbreviations
PPD, Postpartum depression; MQI, muscle quality index; NHANES, Nutrition Examination Survey; PHQ-9, Patient Health Questionnaire-9; BMI, body mass index; MetS, metabolic syndrome MetS.
Data Sharing Statement
The datasets generated and analyzed for the current study are available in the NHANES repository (https://wwwn.cdc.gov/nchs/nhanes).
Ethics Approval and Consent to Participate
The NCHS Ethics Review Board protects the rights and welfare of NHANES participants. The NHANES protocol complies with the US Department of Health and Human Services Policy for the Protection of Human Research Subjects. Ethical review and approval were waived for this study as it solely used publicly available data for research and publication. The analysis of this publicly available, de-identified data was reviewed and granted an exemption by the Institutional Review Board of the Second Affiliated Hospital of Chongqing Medical University. This exemption is in accordance with Article 32 of the Measures for the Ethical Review of Life Science and Medical Research Involving Human Subjects (China, 2023).
Consent for Publication
All authors reviewed the manuscript and approved of the submitted version.
Acknowledgments
This manuscript is also available on ResearchSquare (https://www.researchsquare.com/article/rs-6213174/v1).
Author Contributions
All authors made a significant contribution to the work reported, whether that is in the conception, study design, execution, acquisition of data, analysis and interpretation, or in all these areas; took part in drafting, revising or critically reviewing the article; gave final approval of the version to be published; have agreed on the journal to which the article has been submitted; and agree to be accountable for all aspects of the work.
Funding
This study was funded by the Nursing Scientific Research Project of the Second Affiliated Hospital of Chongqing Medical University (HL2023-01 and HL2024-01).
Disclosure
The authors declare no competing interests in this work.
References
1. Patel V, Saxena S, Lund C, et al. The lancet commission on global mental health and sustainable development. Lancet. 2018;392(10157):1553–12. doi:10.1016/S0140-6736(18)31612-X
2. GBD 2019 Mental Disorders Collaborators. Global, regional, and national burden of 12 mental disorders in 204 countries and territories, 1990–2019: a systematic analysis for the global burden of disease study 2019. Lancet Psychiatry. 2022;9(2):137–150. doi:10.1016/S2215-0366(21)00395-3
3. Monroe SM, Harkness KL. Major depression and its recurrences: life course matters. Annu Rev Clin Psychol. 2022;18:329–357. doi:10.1146/annurev-clinpsy-072220-021440
4. Liu Q, He H, Yang J, Feng X, Zhao F, Lyu J. Changes in the global burden of depression from 1990 to 2017: findings from the global burden of disease study. J Psychiatr Res. 2020;126:134–140. doi:10.1016/j.jpsychires.2019.08.002
5. McAllister-Williams RH, Arango C, Blier P, et al. The identification, assessment and management of difficult-to-treat depression: an international consensus statement. J Affect Disord. 2020;267:264–282. doi:10.1016/j.jad.2020.02.023
6. Kale H, Zhdanava M, Pilon D, et al. Economic and clinical burden of major depressive disorder with insomnia symptoms in commercially and medicaid-insured adults in the United States: a retrospective matched cohort study. J Affect Disord. 2024;372:653–664. doi:10.1016/j.jad.2024.12.048
7. Kwon M, Ahn SY, Kim SA. Factors influencing depressive symptoms in middle-aged south korean workers by job type: a population-based study. Int J Environ Res Public Health. 2022;19(21):14310. doi:10.3390/ijerph192114310
8. Joshi K, Cambron-Mellott MJ, Costantino H, Pfau A, Jha MK. The real-world burden of adults with major depressive disorder with moderate or severe insomnia symptoms in the United States. J Affective Disorders. 2023;323:698–706. doi:10.1016/j.jad.2022.12.005
9. Nelson BW, Forman-Hoffman VL, Peiper NC. Preliminary effectiveness of a therapist-supported digital mental health intervention in reducing suicidal ideation. Arch Suicide Res. 2024;28(3):934–947. doi:10.1080/13811118.2023.2262540
10. Takai Y, Ohta M, Akagi R, Kanehisa H, Kawakami Y, Fukunaga T. Sit-to-stand test to evaluate knee extensor muscle size and strength in the elderly: a novel approach. J Physiol Anthropol. 2009;28(3):123–128. doi:10.2114/jpa2.28.123
11. Barahona-Fuentes G, Huerta Ojeda Á, Romero GL, et al. Muscle quality index is inversely associated with psychosocial variables among chilean adolescents. BMC Public Health. 2023;23(1):2104. doi:10.1186/s12889-023-16978-w
12. Wang Z, Wu M, Shao X, Yang Q. Muscle quality index is associated with depression among non-elderly US adults. BMC Psychiatry. 2024;24(1):672. doi:10.1186/s12888-024-06136-w
13. Zanotelli A, Rossi AP, Del monte L, et al. The role of combined muscle ultrasound and bioimpedentiometry parameters for sarcopenia diagnosis in a population of hospitalized older adults. Nutrients. 2024;16(15):2429. doi:10.3390/nu16152429
14. Caamaño-Navarrete F, Jerez-Mayorga D, Alvarez C, Del-Cuerpo I, Cresp-Barría M, Delgado-Floody P. Muscle quality index in morbidly obesity patients related to metabolic syndrome markers and cardiorespiratory fitness. Nutrients. 2023;15(11):2458. doi:10.3390/nu15112458
15. Swetlitz N. Depression’s problem with men. AMA J Ethics. 2021;23(7):E586–589.
16. Kessler RC. Epidemiology of women and depression. J Affect Disord. 2003;74(1):5–13. doi:10.1016/S0165-0327(02)00426-3
17. Huang GP, Mai LP, Zheng ZJ, Wang XP, He GD. Sex differences in the association between the muscle quality index and the incidence of depression: a cross-sectional study. World J Psychiatry. 2024;14(9):1335–1345. doi:10.5498/wjp.v14.i9.1335
18. Treatment and management of mental health conditions during pregnancy and postpartum: ACOG clinical practice guideline no. 5. Obstet Gynecol. 2023;141(6):1262–1288. doi:10.1097/AOG.0000000000005202
19. Altshuler LL, Hendrick V, Cohen LS. An update on mood and anxiety disorders during pregnancy and the postpartum period. Prim Care Compan J Clin Psychiatry. 2000;2(6):217–222. doi:10.4088/pcc.v02n0604
20. Bruce KE, Wouk K, Grewen KM, et al. HPA axis dysregulation and postpartum depression and anxiety symptoms in breastfeeding vs bottle-feeding parents. Psychoneuroendocrinology. 2024;172:107253. doi:10.1016/j.psyneuen.2024.107253
21. Islam MJ, Broidy L, Baird K, Rahman M, Zobair KM. Early exclusive breastfeeding cessation and postpartum depression: assessing the mediating and moderating role of maternal stress and social support. PLoS One. 2021;16(5):e0251419. doi:10.1371/journal.pone.0251419
22. Sipsma HL, Kornfeind K, Kair LR. Pacifiers and exclusive breastfeeding: does risk for postpartum depression modify the association? J Hum Lact. 2017;33(4):692–700. doi:10.1177/0890334417725033
23. Li Z, Tong X, Ma Y, Bao T, Yue J. Prevalence of depression in patients with sarcopenia and correlation between the two diseases: systematic review and meta-analysis. J Cachexia Sarcopenia Muscle. 2022;13(1):128–144. doi:10.1002/jcsm.12908
24. Neeland IJ, Linge J, Birkenfeld AL. Changes in lean body mass with glucagon-like peptide-1-based therapies and mitigation strategies. Diabetes Obesity Metab. 2024;26(Suppl 4):16–27. doi:10.1111/dom.15728
25. Wu WT, Li YJ, Feng AZ, et al. Data mining in clinical big data: the frequently used databases, steps, and methodological models. Mil Med Res. 2021;8(1):44. doi:10.1186/s40779-021-00338-z
26. Chen Y, Lin W, Fu L, et al. Muscle quality index and cardiovascular disease among US population-findings from NHANES 2011-2014. BMC Public Health. 2023;23(1):2388. doi:10.1186/s12889-023-17303-1
27. Lopes LCC, Vaz-Gonçalves L, Schincaglia RM, et al. Sex and population-specific cutoff values of muscle quality index: results from NHANES 2011-2014. Clin Nutr. 2022;41(6):1328–1334. doi:10.1016/j.clnu.2022.04.026
28. Gu W, Bao K, Li X, et al. Association between body fat percentage and depression: a cross-sectional study of NHANES. J Affect Disord. 2025;371:305–314. doi:10.1016/j.jad.2024.11.066
29. Kroenke K, Spitzer RL, Williams JB. The PHQ-9: validity of a brief depression severity measure. J Gen Intern Med. 2001;16(9):606–613. doi:10.1046/j.1525-1497.2001.016009606.x
30. Smagula SF, Zhang G, Gujral S, et al. Association of 24-hour activity pattern phenotypes with depression symptoms and cognitive performance in aging. JAMA Psychiatry. 2022;79(10):1023–1031. doi:10.1001/jamapsychiatry.2022.2573
31. Cheng L, Wu Q, Wang S. Cardiometabolic index is associated with increased depression: a population-based study. J Affect Disord. 2024;348:259–264. doi:10.1016/j.jad.2023.12.073
32. Qi X, Wang S, Huang Q, et al. The association between non-high-density lipoprotein cholesterol to high-density lipoprotein cholesterol ratio (NHHR) and risk of depression among US adults: a cross-sectional NHANES study. J Affect Disord. 2024;344:451–457. doi:10.1016/j.jad.2023.10.064
33. Lv D, Han N, Yuan M, Huang W, Yan L, Tang H. Depression and the risk of non-alcohol fatty liver disease: results from a cross-sectional study and a mendelian randomization analysis. J Affect Disord. 2024;366:300–307. doi:10.1016/j.jad.2024.08.189
34. Alberti KG, Eckel RH, Grundy SM, et al. Harmonizing the metabolic syndrome: a joint interim statement of the international diabetes federation task force on epidemiology and prevention; national heart, lung, and blood institute; American heart association; world heart federation; international atherosclerosis society; and international association for the study of obesity. Circulation. 2009;120(16):1640–1645. doi:10.1161/CIRCULATIONAHA.109.192644
35. Ma S, Xiang D, Hu Z, et al. Developing an individual depression risk score based on traditional risk factors and routine biochemical markers. J Affect Disord. 2025;370:449–459. doi:10.1016/j.jad.2024.11.027
36. Liu F, Wang P, Hu J, et al. A psychologically interpretable artificial intelligence framework for the screening of loneliness, depression, and anxiety. Appl Psychol Health Well Being. 2025;17(1):e12639. doi:10.1111/aphw.12639
37. Meng L, Wu M, Situ J, Gu Y, Peng S. Sex-specific associations between exclusive breastfeeding and postpartum depression in Chinese women. BMC Pregnancy Childbirth. 2024;24(1):829. doi:10.1186/s12884-024-07045-2
38. Farías-Antúnez S, Santos IS, Matijasevich A, de Barros AJD. Maternal mood symptoms in pregnancy and postpartum depression: association with exclusive breastfeeding in a population-based birth cohort. Soc Psychiatry Psychiatr Epidemiol. 2020;55(5):635–643. doi:10.1007/s00127-019-01827-2
39. Wen H, Li X, Tan N. Inverse association between uric acid levels and muscle quality index in adults: a cross-sectional analysis of NHANES 2011-2014. BMC Public Health. 2024;24(1):3109. doi:10.1186/s12889-024-20559-w
40. Tantai X, Ran Q, Wen Z, et al. Low muscle quality index is associated with increased risk of advanced fibrosis in adult patients with nonalcoholic fatty liver disease: NHANES 2011-2014. Sci Rep. 2024;14(1):19883. doi:10.1038/s41598-024-71096-w
 © 2026 The Author(s). This work is published and licensed by Dove Medical Press Limited. The
full terms of this license are available at https://www.dovepress.com/terms
and incorporate the Creative Commons Attribution
- Non Commercial (unported, 4.0) License.
By accessing the work you hereby accept the Terms. Non-commercial uses of the work are permitted
without any further permission from Dove Medical Press Limited, provided the work is properly
attributed. For permission for commercial use of this work, please see paragraphs 4.2 and 5 of our Terms.
© 2026 The Author(s). This work is published and licensed by Dove Medical Press Limited. The
full terms of this license are available at https://www.dovepress.com/terms
and incorporate the Creative Commons Attribution
- Non Commercial (unported, 4.0) License.
By accessing the work you hereby accept the Terms. Non-commercial uses of the work are permitted
without any further permission from Dove Medical Press Limited, provided the work is properly
attributed. For permission for commercial use of this work, please see paragraphs 4.2 and 5 of our Terms.