Back to Journals » Diabetes, Metabolic Syndrome and Obesity » Volume 10
Association between metabolic syndrome and sensorineural hearing loss: a cross-sectional study of 11,114 participants
Authors Aghazadeh-Attari J, Mansorian B, Mirza-Aghazadeh-Attari M ![]() , Ahmadzadeh J
, Ahmadzadeh J ![]() , Mohebbi I
, Mohebbi I
Received 5 September 2017
Accepted for publication 3 October 2017
Published 6 November 2017 Volume 2017:10 Pages 459—465
DOI https://doi.org/10.2147/DMSO.S150893
Checked for plagiarism Yes
Review by Single anonymous peer review
Peer reviewer comments 2
Editor who approved publication: Professor Ming-Hui Zou
Javad Aghazadeh-Attari,1 Behnam Mansorian,2 Mohammad Mirza-Aghazadeh-Attari,3 Jamal Ahmadzadeh,2 Iraj Mohebbi2
1Social Determinants of Health Research Center, Department of Neurosurgery, 2Social Determinants of Health Research Center, Occupational Medicine Center, Urmia University of Medical Sciences, Urmia, 3Medical Philosophy and History Research Center, Tabriz University of Medical Sciences, Tabriz, Iran
Background/objectives: Hearing loss (HL) is associated with certain diseases and affects health, resulting in a low quality of life. Some components of the metabolic syndrome (MetS) coincide with the risk factors for sensorineural hearing loss (SNHL). To date, very few studies have examined the link between MetS and HL. The aim of the current study was to try to understand the potential association between MetS and HL.
Methods: Using Iranian health surveys of professional drivers, we enrolled 11,114 individuals aged 20–60 years, whose main job is to operate a motor vehicle. We examined participants for the presence and absence of SNHL and the components of the MetS. Additionally, we investigated the relationship between MetS and the pure tone air conduction hearing thresholds of participants with SNHL, including low-frequency and high-frequency thresholds.
Results: This cross-sectional study consisted of 11,114 participants: 3202 (28.81%) diagnosed with MetS and 7911 (71.18%) without and 2772 (24.94%) with SNHL and 8432 (75.86%) without. Participants with SNHL had a higher number of components of MetS (P<0.001 for all components).
Conclusion: Our results demonstrated that an association possibly exists between different components of MetS (obesity, hypertension, hypertriglyceridemia, high fasting glucose levels, and waist circumference) and SNHL in a population of West Azerbaijan drivers. Therefore, it is important to schedule periodic checkups for drivers to detect and avoid the increase in MetS components at an early stage in this population.
Keywords: metabolic syndrome, obesity, sensorineural hearing loss, a cross-sectional study
Introduction
Hearing loss (HL) is a sensory deficit that is becoming a severe social and health problem. It can also lead to impaired verbal language processing, thereby limiting meaningful communication and social connectivity. Such communication difficulties negatively affect work productivity and cognitive and emotional statuses.1 The increase in the prevalence of HL may be due to the aging of the population and exposure to noise
There is an association between the risk factors of cardiovascular disease and age-associated HL in adults.2 The environmental factors related to HL have been studied. HL associated with noise exposure is sensorineural, bilateral, and symmetrical, and it is likely that irreversible hearing impairment gradually develops over a period of 5–20 years by general exposure at all different locations.3 Individuals with this condition likely have a prolonged history of exposure to noise, which has caused a notch configuration at 3–6 kHz on a pure tone audiogram, most often caused by steady-state noise exposure, although impulse noise is more detrimental.4 It has been estimated that ~600 million workers worldwide, 10% of the total American population and 20% of the European workers, are exposed to hazardous noise levels at work.5,6 In addition to environmental factors, it is suggested that several medical risk factors have an influence on hearing. Some components of the metabolic syndrome (MetS) coincide with risk factors associated with sensorineural hearing loss (SNHL), such as increased blood pressure, hyperlipidemia, and low level of high-density lipoprotein. Hyperlipidemia impairs the morphology and function of the cochlea.7,8 The MetS increases the risk of cardiovascular events and progression to diabetes mellitus.9–11 Interestingly, there is an association between high-frequency sensorineural hearing impairment and diabetes mellitus.12,13 The pathophysiological mechanisms of the relationship between MetS and HL are poorly understood.14 To date, only a few studies have specifically addressed the role of MetS in HL, and little effort has been made to examine the relationship between MetS and HL. The present study was conducted to assess the relationship between MetS and HL in a population of professional drivers from the West Azerbaijan province.
Methods
Ethics statement
The study protocol was approved by the ethics committee of Medical Sciences at the Urmia University, and participants provided written informed consent at recruitment.
Study population
Between 2014 and 2016, the Iranian Health Department conducted a series of surveys among professional drivers of commercial motor vehicles. During this 2-year period, more than 24,000 individuals, who operated motor vehicles over long distances, were referred to the occupational medicine center for a fitness to work assessment. All drivers were men and residents of the West Azerbaijan province of Iran. Of the participants who participated in this cross-sectional study, half of them aged between 20 and 60 years were selected for an audiometric assessment. From the total of 24,277 participants, a random selection of 12,138 participants was made for this hearing test. This number was reduced to 11,114 participants by exclusion criteria.
Written consent to participate in the research study was obtained from each participant. The participants were asked to complete a comprehensive questionnaire on basic information about their demographics, medical history, medication use, and social and family history.
Exclusion criteria
The questionnaire, audiometric tests, and otoscopic examinations were assessed, and participants were excluded if they met any of the following criteria: unreliable audiometric measurements (i.e., there was a 10 dB difference between the 1000 Hz test and retest thresholds [n=547]), nonresponse code to audiometric testing (n=79), and a history of ear surgery, ototoxic drug use (such as cisplatin or aminoglycosides), severe or frequent ear infection, hypothyroidism, and/or unilateral (difference between ears in air conduction threshold was >40 dB for at least two frequencies at 500, 1000, and/or 2000 Hz) or conductive HL (n=398).
Audiometric measurements
The hearing acuity assessments were performed by a qualified audiologist using a diagnostic audiometer (Model AD 229e; Interacoustic Denmark Co. Ltd.) in an isolated acoustic room. All tests met the requirements of ANSI S3.1-1991. Standardized audiometric procedures were applied assuring at least 14 hours of noise avoidance by the participants.
The pure tone conduction hearing thresholds for the left and right ears were measured at 500, 1000, 2000, 3000, 4000, 6000, and 8000 Hz over an intensity range of -10 to 120 dB. The pure tone average (PTA) at 500, 1000, and 2000 Hz was defined as low PTA, while the PTA at 3000, 4000, 6000, and 8000 Hz was defined as high PTA.
In this study, sensorineural hearing impairment was defined with the following criteria: the difference in the threshold at the frequency of 4000 and 1000 Hz was >30 dB, or the hearing threshold at 4000 Hz in the ear with better hearing was >25 dB.
The hearing assessment was performed twice in each ear at the frequency of 1000 Hz to verify the reliability of each participant’s responses. The impaired audiometric configurations were classified according to one of three pattern types: flat, down-sloping, and noise-induced high-tone loss. The criteria that were applied to determine the various audiometric configurations were as follows:
- Flat: transgression of hearing threshold at all frequencies was >25 dB HL, but the difference between the average at the lower two (1000 and 2000 Hz), mid two (3000 and 4000 Hz) or upper two (6000 and 8000 Hz) frequencies was <10 dB HL.
- Down-sloping: the average of thresholds at the higher two frequencies (6000 and 8000 Hz) was ≥10 dB HL than that at the mid two frequencies (3000 and 4000 Hz), but the difference between the average at the lower two (1000 and 2000 Hz) and mid two frequencies (3000 and 4000 Hz) was <10 dB HL.
- Noise-induced high-tone loss: elevated thresholds were observed in the 3000–6000 Hz region of the audiogram with HL at frequencies of 3000–6000 Hz at least 10 dB worse than the worst hearing threshold values at 500 or 1000 Hz, and hearing thresholds at 8000 Hz were at least 10 dB better than the worst threshold at 3000, 4000, or 6000 Hz.
Definition of MetS
All participants were screened for MetS using International Diabetes Federation criteria that consisted of the presence of central adiposity on the basis of waist circumference ≥94 cm plus two or more of the following four factors: concentration of triglycerides (TGs) ≥150 mg/dL (1.7 mmol/L), concentration of high-density lipoprotein cholesterol (HDL-c) <40 mg/dL (1.03 mmol/L), systolic blood pressure ≥130 mmHg or diastolic blood pressure ≥85 mmHg, and fasting blood glucose (FBG) concentration ≥100 mg/dL (5.6 mmol/L).15
Evaluation of potential risk factors
Anthropometric and clinical data were obtained using physical examinations, as previously described.16,17 Briefly, all participants were required to fast overnight before blood sampling and blood pressure measurements were performed. At each visit, data on blood pressure, anthropometric measures (e.g., waist circumference, height, and weight), and routine laboratory measures (e.g., FBG, TG, and HDL-c) were collected. Body mass index (BMI) was calculated as the ratio of weight and squared height. In accordance with the criteria of the World Health Organization, normal weight was defined as BMI <25 kg/m2, overweight as BMI ≥25 kg/m2, and obesity as BMI ≥30 kg/m2.
A complete smoking history was also evaluated that included the number of years the patient had been smoking and the average number of cigarettes smoked per day. Smoking pack-years were calculated, and the participants were allocated into one of four smoking categories: non-smoker, ≤10 smoking pack-years, 11–20 smoking pack-years, and >20 smoking pack-years.
Statistical analysis
All statistical analyses were performed using SPSS, version 20. Quantitative measurements were expressed as the mean and standard deviation. Qualitative variables were presented as absolute frequency and percentage. Logistic regression was used to analyze the association of various risk factors with SNHL and to identify the relationship. Linear regression was used to analyze the relationship between MetS and PTA hearing threshold. The correlation between various components of MetS and SNHL was measured using Spearman’s correlation coefficient. A P-value of <0.05 was considered as significant.
Results
We enrolled 11,114 professional drivers in this study. Of these, 3202 (28.81%) were diagnosed with MetS and 7911 (71.18%) without MetS and 2772 (24.94%) with SNHL and 8432 (75.86%) without SNHL. The quantitative and qualitative characteristics of participants are summarized in Table 1.
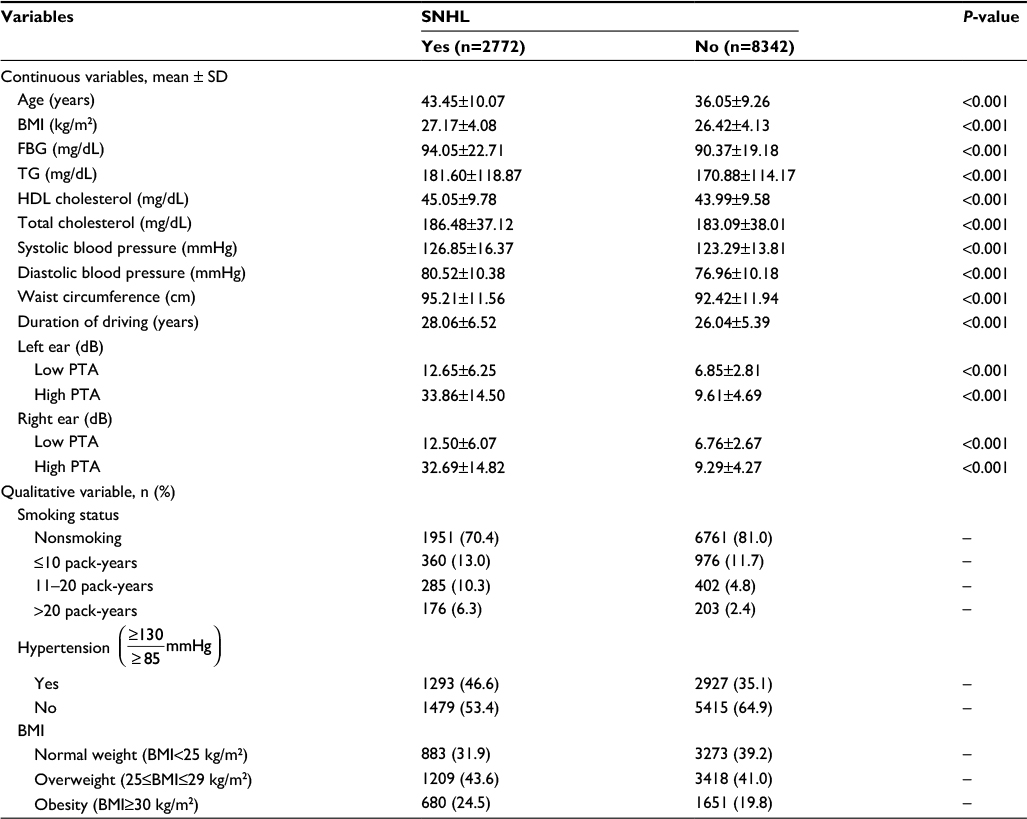 | Table 1 Characteristics of participants with and without SNHL Abbreviations: SNHL, sensorineural hearing loss; SD, standard deviation; BMI, body mass index; FBG, fasting blood glucose; TG, triglyceride; HDL, high-density lipoprotein; low PTA, pure tone average at low frequencies; high PTA, pure tone average at high frequencies. |
Table 1 shows that the participants with SNHL were older; had a higher BMI; had higher levels of FBG, TG, HDL-c, and low-density lipoprotein cholesterol; had higher systolic blood pressure, diastolic blood pressure, and waist circumference; and had longer duration of driving than those without SNHL.
The association of various potential risk factors on SNHL was investigated by calculating odds ratios (ORs). There were statistically significant differences in the following risk factors between participants with and without SNHL: MetS, hypertension, smoking, BMI, age, and duration of driving (Table 2).
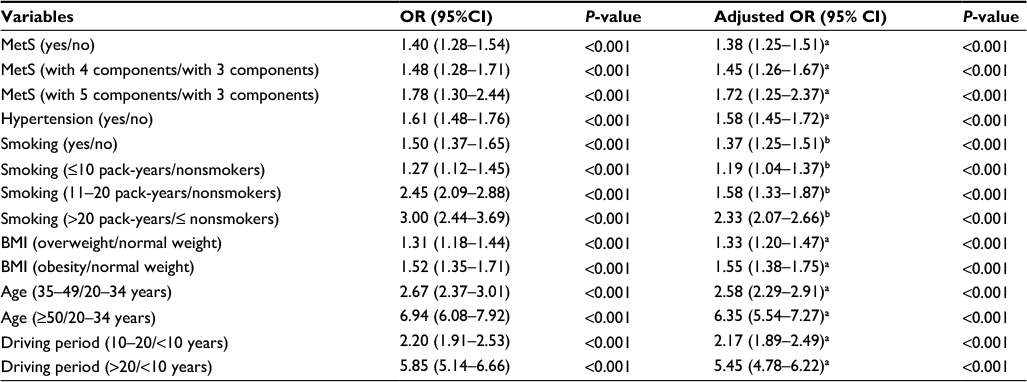 | Table 2 Associations between various potential risk factors and SNHL (yes/no) Notes: aAdjusted for smoking. bAdjusted for age. Abbreviations: SNHL, sensorineural hearing loss; OR, odds ratio; CI, confidence interval; MetS, metabolic syndrome; BMI, body mass index. |
Table 3 shows that in addition to MetS, other potential risk factors, such as BMI, smoking, and duration of driving, are also significantly associated with different categories of SNHL.
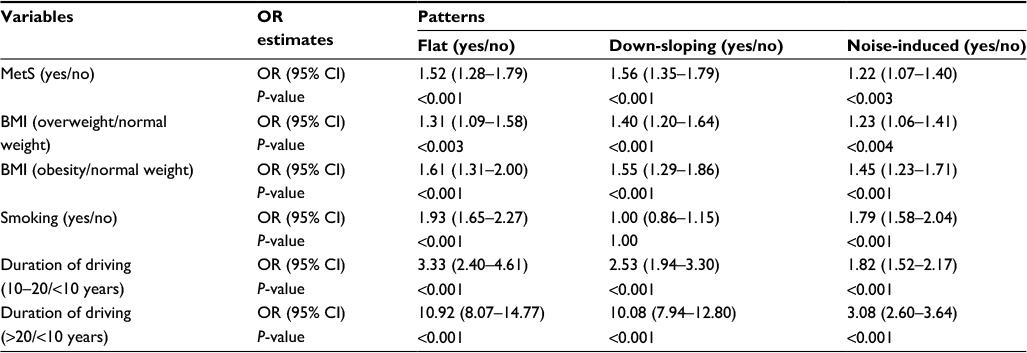 | Table 3 Associations between potential risk factors and different categories of SNHL Abbreviations: SNHL, sensorineural hearing loss; MetS, metabolic syndrome; OR, odds ratio; CI, confidence interval; BMI, body mass index. |
Table 4 shows that the β coefficients of hearing threshold of participants with MetS were 0.060 in the unadjusted model and 0.051 (Model 1) and 0.059 (Model 2) in the adjusted mode for the high PTA and 0.006 in the unadjusted model and 0.005 (Model 1) and 0.005 (Model 2) in the adjusted mode for the low PTA.
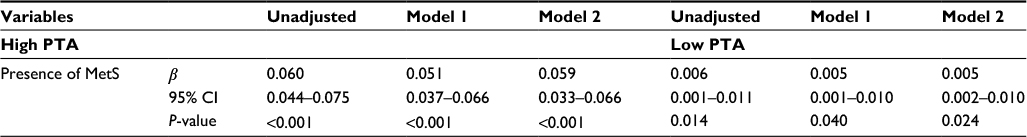 | Table 4 Regression coefficients for hearing threshold in the presence of MetS Notes: Model 1 adjusted for age, duration of driving, and smoking. Model 2 adjusted for age, duration of driving, smoking, and BMI. Abbreviations: MetS, metabolic syndrome; low PTA, pure tone average at low frequencies; high PTA, pure tone average at high frequencies; CI, confidence interval; BMI, body mass index. |
Discussion
This cross-sectional study is one of the first studies to investigate the association between MetS and SNHL and reports on a novel finding regarding this association. By analyzing data on 11,114 drivers of the West Azerbaijan province, we found that 28.81% of them met the criteria for MetS. This ratio was higher than the values that were previously reported by other authors.18,19 One of the reasons for this difference is the drivers’ lifestyle, making them more likely to develop MetS components. Another reason for high prevalence in this study might be sampling bias (all of including population was professional drivers).
The prevalence of 24.94% for SNHL in the present study is slightly higher than reported in other studies.18,19 Differences in reported prevalence are most likely due to the sample size of the study, different criteria for the diagnosis, or genetics.
We found a strong association between different components of MetS (obesity, hypertension, hypertriglyceridemia, high fasting glucose levels, and waist circumference) with SNHL. As mentioned in the Results section, the risk of having SNHL in individuals with MetS compared to participants without MetS was 1.40 (95% confidence interval [CI]: 1.28–1.54). Compared to all the three categories of the SNHL, the OR for MetS with four components was 1.48 (95% CI: 1.28–1.71) and that for MetS with five components was 1.78 (95% CI: 1.30–2.44). This finding shows that MetS is a risk factor for SNHL, and with an increase in the number of MetS components, the risk of HL was also increased. On the other hand, MetS as a risk factor for different categories of SNHL should also be considered (Table 3).17 This issue needs further investigation in separate studies by other researchers.
Univariate and multivariate linear regression analyses showed that low PTA and high PTA thresholds were positively associated with MetS. Interestingly, after adjusting for objective confounders including age, duration of driving as a marker of noise exposure, and smoking in Model 1 and confounders in Model 1 and BMI in Model 2, there is a trend in the β coefficients of hearing threshold in the presence of MetS (Table 4).
Another important finding is the relationship between HL and hypertension. The OR of SNHL for individuals with hypertension was 1.61 (95% CI: 1.48–1.76) compared to individuals with normal blood pressure. Although the mechanisms that underlie this relationship are poorly understood, Duck et al20 have shown that hypertension potentially interacts with diseases like diabetes mellitus and therefore plays a role in the pathogenesis of SNHL.
Driving duration as an indicator of long-term exposure to noise and vibration may play a key role in hearing impairment. Our data strongly support that an increase in the number of driving years increases the risk of HL. The OR for SNHL for those who had 10–20 driving years was 2.20 (95% CI: 1.91–2.53) compared to drivers who had <10 driving years, and the OR in those who had >20 driving years was 5.85 (95% CI: 5.14–6.66) compared to participants with <10 driving years. This issue requires a separate investigation.
Our findings in Table 2 strongly support the relationship between smoking and HL. By increasing the number of cigarettes pack-years by professional drivers, their risk of HL increases. Indeed, several studies revealed a significant association between tobacco smoking and HL.21–23 The best predictor for NSHL of the anthropometric indices that results in the MetS remains unknown, but our results together with a report by Curhan et al24 suggest that being overweight and obese is associated with SNHL. Some studies showed associations between hearing impairment and BMI, with BMI as a classical indicator of obesity. The authors suggested that by increasing BMI, the risk of HL is increased.25,26
This study had some limitations. First, it was a cross-sectional study, and therefore, the evaluation of the relationship between the past exposure and the current outcome was weak. Prospective analysis, which includes follow-up data, is required to confirm the correlations between MetS and SNHL that were identified in this study. Second, the effect of recall bias on the data on habitual parameters, such as the number of cigarette packs smoked and pack-years, cannot be excluded.
Conclusion
In summary, our results demonstrated that an association possibly exists between MetS components to predicting hearing impairment.
Acknowledgments
This work was supported by the Urmia University of Medical Sciences (grant no. 2146), but the funder had no role in the study design, collection, analysis and interpretation of the data, writing of the report, and decision to submit this paper for publication. This research is dedicated to Dr. M.M. Dilar. The authors thank the staff of Occupational Medicine Center at Urmia University of Medical Sciences and the staff of referral lab of Urmia University of Medical Sciences for their help.
Author contributions
All authors contributed toward data analysis, drafting and critically revising the paper and agree to be accountable for all aspects of the work.
Disclosure
The authors report no conflicts of interest in this work.
References
Ciorba A, Bianchini C, Pelucchi S, Pastore A. The impact of hearing loss on the quality of life of elderly adults. Clin Interv Aging. 2012;7(6):159–163. | ||
Helzner EP, Patel AS, Pratt S, et al. Hearing sensitivity in older adults: associations with cardiovascular risk factors in the health, aging and body composition study. J Am Geriatr Soc. 2011;59(6):972–979. | ||
El Dib RP, Silva EM, Morais JF, Trevisani VF. Prevalence of high frequency hearing loss consistent with noise exposure among people working with sound systems and general population in Brazil: a cross-sectional study. BMC Public Health. 2008;8(1):151. | ||
Gratton MA, Wright CG. Alterations of inner ear morphology in experimental hypercholesterolemia. Hear Res. 1992;61(1):97–105. | ||
May JJ. Occupational hearing loss. Am J Ind Med. 2000;37(1):112–120. | ||
Nelson DI, Nelson RY, Concha-Barrientos M, Fingerhut M. The global burden of occupational noise-induced hearing loss. Am J Ind Med. 2005;48(6):446–458. | ||
Demir MG, Aydin S. The effect of the cholesterol levels on noise-induced hearing loss. Int Arch Otorhinolaryngol. 2017. Available from: https://www.thieme-connect.com/products/ejournals/html/10.1055/s-0037-1602774. Accessed October 25, 2017. | ||
Kimitsuki T. Cholesterol influences potassium currents in inner hair cells isolated from guinea pig cochlea. Auris Nasus Larynx. 2017;44(1):46–51. | ||
Meigs JB, Wilson PW, Fox CS, et al. Body mass index, metabolic syndrome, and risk of type 2 diabetes or cardiovascular disease. J Clin Endocrinol Metab. 2006;91(8):2906–2912. | ||
Mansouri B, Kivelevitch D, Natarajan B, et al. Comparison of coronary artery calcium scores between patients with psoriasis and type 2 diabetes. JAMA Dermatol. 2016;152(11):1244–1253. | ||
Malik S, Wong ND, Franklin SS, et al. Impact of the metabolic syndrome on mortality from coronary heart disease, cardiovascular disease, and all causes in United States adults. Circulation. 2004;110(10):1245–1250. | ||
Vaughan N, James K, McDermott D, Griest S, Fausti S. A 5-year prospective study of diabetes and hearing loss in a veteran population. Otol Neurotol. 2006;27(1):37–43. | ||
AlJasser A, Uus K, Baker R, Plack C. Sub-clinical auditory neural deficits in patients with type 1 diabetes mellitus. J Acoust Soc Am. 2016;140(4):3158–3158. | ||
Sun Y-S, Fang W-H, Kao T-W, et al. Components of metabolic syndrome as risk factors for hearing threshold shifts. PLoS One. 2015;10(8):e0134388. | ||
Alberti KG, Zimmet P, Shaw J. Metabolic syndrome—a new world‐wide definition. A consensus statement from the international diabetes federation. Diabet Med. 2006;23(5):469–480. | ||
Mohebbi I, Saadat S, Aghassi M, Shekari M, Matinkhah M, Sehat S. Prevalence of metabolic syndrome in Iranian professional drivers: results from a population based study of 12,138 men. PLoS One. 2012;7(2):e31790. | ||
Mohebbi I, Shateri K, Seyedmohammadzad M. The relationship between working schedule patterns and the markers of the metabolic syndrome: comparison of shift workers with day workers. Int J Occup Med Environ Health. 2012;25(4):383–391. | ||
Vartiainen E, Karjalainen S. Prevalence and etiology of unilateral sensorineural hearing impairment in a Finnish childhood population. Int J Pediatr Otorhinolaryngol. 1998;43(3):253–259. | ||
Prasansuk S. Incidence/prevalence of sensorineural hearing impairment in Thailand and Southeast Asia: incidencia/prevalencia de los trastornos auditivos sensorineurales en Tailandia y el Sudeste Asiatico. Audiology. 2000;39(4):207–211. | ||
Duck SW, Prazma J, Bennett PS, Pillsbury HC. Interaction between hypertension and diabetes mellitus in the pathogenesis of sensorineural hearing loss. Laryngoscope. 1997;107(12):1596–1605. | ||
Mohammadi S, Mazhari MM, Mehrparvar AH, Attarchi MS. Cigarette smoking and occupational noise-induced hearing loss. Eur J Public Health. 2010;20(4):452–455. | ||
Pouryaghoub G, Mehrdad R, Mohammadi S. Interaction of smoking and occupational noise exposure on hearing loss: a cross-sectional study. BMC Public Health. 2007;7(1):137. | ||
Nomura K, Nakao M, Morimoto T. Effect of smoking on hearing loss: quality assessment and meta-analysis. Prev Med. 2005;40(2):138–144. | ||
Curhan SG, Eavey R, Wang M, Stampfer MJ, Curhan GC. Body mass index, waist circumference, physical activity, and risk of hearing loss in women. Am J Med. 2013;126(12):1142.e1–8. | ||
Fransen E, Topsakal V, Hendrickx J-J, et al. Occupational noise, smoking, and a high body mass index are risk factors for age-related hearing impairment and moderate alcohol consumption is protective: a European population-based multicenter study. J Assoc Res Otolaryngol. 2008;9(3):264–276. | ||
Cruickshanks KJ, Nondahl DM, Dalton DS, et al. Smoking, central adiposity, and poor glycemic control increase risk of hearing impairment. J Am Geriatr Soc. 2015;63(5):918–924. |
 © 2017 The Author(s). This work is published and licensed by Dove Medical Press Limited. The
full terms of this license are available at https://www.dovepress.com/terms
and incorporate the Creative Commons Attribution
- Non Commercial (unported, 3.0) License.
By accessing the work you hereby accept the Terms. Non-commercial uses of the work are permitted
without any further permission from Dove Medical Press Limited, provided the work is properly
attributed. For permission for commercial use of this work, please see paragraphs 4.2 and 5 of our Terms.
© 2017 The Author(s). This work is published and licensed by Dove Medical Press Limited. The
full terms of this license are available at https://www.dovepress.com/terms
and incorporate the Creative Commons Attribution
- Non Commercial (unported, 3.0) License.
By accessing the work you hereby accept the Terms. Non-commercial uses of the work are permitted
without any further permission from Dove Medical Press Limited, provided the work is properly
attributed. For permission for commercial use of this work, please see paragraphs 4.2 and 5 of our Terms.