Back to Journals » Clinical Interventions in Aging » Volume 16
Association Between Geriatric Nutritional Risk Index and Frailty in Older Hospitalized Patients
Authors Zhao Y ![]() , Lin T, Hou L, Zhang M, Peng X, Xie D, Gao L, Shu X, Yue J
, Lin T, Hou L, Zhang M, Peng X, Xie D, Gao L, Shu X, Yue J ![]() , Wu C
, Wu C
Received 1 April 2021
Accepted for publication 14 June 2021
Published 28 June 2021 Volume 2021:16 Pages 1241—1249
DOI https://doi.org/10.2147/CIA.S313827
Checked for plagiarism Yes
Review by Single anonymous peer review
Peer reviewer comments 4
Editor who approved publication: Dr Zhi-Ying Wu
Yanli Zhao, 1 Taiping Lin, 1 Lisha Hou, 1 Meng Zhang, 1 Xuchao Peng, 1 Dongmei Xie, 1 Langli Gao, 1 Xiaoyu Shu, 1 Jirong Yue, 1 Chenkai Wu 2
1Department of Geriatrics and National Clinical Research Center for Geriatrics, West China Hospital, Sichuan University, Chengdu, Sichuan, 610041, People’s Republic of China; 2Global Health Research Center, Duke Kunshan University, Kunshan, 215300, Jiangsu, People’s Republic of China
Correspondence: Jirong Yue
Department of Geriatrics and National Clinical Research Center for Geriatrics, West China Hospital, Sichuan University, Chengdu, Sichuan Province, 610041, People’s Republic of China
Tel +86 18980601143
Email [email protected]
Objective: Previous studies have explored the association between malnutrition and frailty, but no study has investigated whether the Geriatric Nutritional Risk Index (GNRI), a simple and objective nutritional risk screening tool, is associated with the frailty of older adults. The study aimed to examine the relationship between nutrition-related risk, as assessed by the GNRI, and frailty among older hospitalized patients.
Methods: A cross-sectional study was conducted in the West China Hospital of Sichuan University with 740 patients aged ≥ 70 years between March 2016 and Jan 2017. Nutritional and frailty status was evaluated with the GNRI and FRAIL scale, respectively. The adjusted and unadjusted ordinal logistic regression analyses were used to examine the relationship between nutritional risk and frailty. The ability of GNRI in detecting frailty was assessed by receiver operating characteristic (ROC) curve analysis.
Results: The prevalence of low, moderate, and severe nutritional risk among frail patients were 30.1%, 27.6%, and 12.5%, respectively. Ordinal logistic regression analysis showed that malnutrition assessed by the GNRI had a significant association with frailty after adjustment of age, sex, polypharmacy, comorbidity, vision impairment, hearing impairment, cognitive impairment, and depression. In the ROC analysis, the area under the curve for GNRI identifying frailty was 0.698 (95% CI: 0.66– 0.74; P< 0.001), and the optimal cut-point value was 97.16 (sensitivity: 64.3%; specificity: 66.9%).
Conclusion: Nutrition-related risk screened by the GNRI was independently associated with frailty. The GNRI could be used as a simple tool in detecting nutritional risk and frailty status of older patients.
Keywords: frailty, malnutrition, Geriatric Nutritional Risk Index, older people
Introduction
Frailty is a multidimensional geriatric syndrome characterized by a loss of physiological reserves and decreased resistance to stressors. The prevalence of frailty in older hospitalized patients is 48.8%.1 Frailty has been shown to be associated with adverse health outcomes, such as hospitalization, mortality, disability, morbidity, falls, and prolonged length of hospital.2,3
Malnutrition is also a common geriatric syndrome and often coexists with frailty; both syndromes are closely related and establish a vicious circle.4 On the one hand, malnutrition results in lower protein synthesis rate and muscle catabolism, increasing the risk of sarcopenia characterized by a decline in muscle mass and strength, exhaustion, and reduced physical function, all of which comprise the frailty definition.2,5 On the other hand, frail older patients are often accompanied by chewing and swallowing difficulties, poor appetite, and insufficient food intake, consequently leading to malnutrition.6 Hence, screening and management of nutritional status should be implemented in frail older adults’ routine care.
Recently, several nutritional screening methods have been developed for older hospitalized patients.7 The Mini Nutritional Assessment-Short Form (MNA-SF) is a widely used nutritional screening method, but it requires patient cooperation and is not applicable for patients with communication disabilities. The Geriatric Nutritional Risk Index (GNRI), an objective and easy screening method, has been introduced to evaluate older people’s nutritional outcomes.8 This method could be performed by non-specialized staff quickly because it is only based on height, weight, and serum albumin level.8 More recently, the GNRI has been reported to be a useful tool to assess older patients’ adverse outcomes, including mortality, a longer length of hospital stay, surgical site infection, and cardiovascular events.9–12 However, evidence on the relationship between the GNRI and frailty is still scarce.
Thus, we investigated the relationship between nutrition-related risk, as evaluated by the GNRI, and frailty in older hospitalized patients, aiming to assess the usefulness of the GNRI in detecting frailty. We hypothesized that GNRI could be used as a simple method to identify older hospitalized patients’ frailty.
Methods
Study Design and Sample
A cross-sectional study was conducted between March 2016 and Jan 2017 in the Department of Geriatric (across four floors), West China Hospital of Sichuan University. Each floor is equipped with 65 beds and treats internal medical older patients. Patients aged 70 years or older and admitted consecutively to the Department of Geriatric ward were eligible for inclusion. Exclusion criteria included (1) a terminal condition with life expectancy of less than six months (eg, metastatic cancer, pancreatic cancer, or receiving end-of-life care); (2) inability to complete questionnaires because of severe dementia, severe blindness, or severe deafness; (4) a documented history of schizophrenia or psychosis; (5) incomplete data. The study was performed according to the Declaration of Helsinki and approved by the Ethics Committee of West China Hospital, Sichuan University (West China Hospital #201440; date 15 April 2014).
Data Collection
All the assessments were performed through interviews by trained nurses within 24 hours of admission. We collected the following sociodemographic and clinical data: age, gender, living situation, educational level, marriage status, smoking, alcohol intake, primary diagnosis, and admission type. Polypharmacy was defined as prescribing more than five medications simultaneously.13 Cognitive status was evaluated using the Short Portable Mental Status Questionnaire (SPMSQ),14 consisting of 10 items and three domains (orientation, memory, attention). Comorbidity was evaluated by the Charlson Comorbidity Index (CCI),15 which encompasses 19 comorbid conditions weighted 1–6. The total score ranges from 0 to 37, with higher scores indicating more comorbidity. Depression symptoms were assessed using the 15-item Geriatric Depression Scale (GDS-15), with scores ranging from 0 (no depression) to 15 (severe depression).16 We assessed visual and hearing ability using the Snellen eye chart and the whispered voice test, respectively.
Frailty Assessment
Frailty was evaluated with the FRAIL scale,17 a validated frailty screening tool and has been extensively used to assess older people’s frailty status. The FRAIL scale is based on five criteria: fatigue, resistance (inability to climb a single flight of stairs), ambulation (inability to walk alone for 100 m), illnesses (the presence of 5 or more of theses diseases: hypertension, diabetes, cancer, chronic lung disease, heart attack, congestive heart failure, angina, asthma, arthritis, stroke, kidney disease), and loss of weight (unintentional weight loss of more than 5% in the past year). Frailty level was identified by the number of criteria met. Patients with none were considered “non-frail”; those meeting one or two criteria were considered “pre-frail”; those with three to five criteria were defined as “frail”.
Nutritional Risk Assessment
Body weight, height, and serum albumin were collected by trained nurses within 24 hours of admission. Body weight was measured using a standardized scale placed on a hard-floor surface (without shoes and with light clothing) and recorded to the nearest 0.5 kg. Height was measured using a length scale (without shoes) and recorded to the nearest 0.1 cm. Eight to 12-h fasting venous blood samples were drawn for the evaluation of serum albumin.
Nutrition-related risk was determined using the GNRI; an objective screening tool was developed to predict the risk of nutrition-related complications in older people.8 The GNRI was calculated as the following formula: GNRI= [1.489×serum albumin (g/L)]+[41.7×(present weight/ideal weight (Kg))]. We calculated the ideal body weight through the following Lorentz equations:8 0.75×height (cm) – 62.5 for men, 0.60×height (cm) – 40 for women. When present weight/ideal body weight was ≥1, the ratio was set to 1. Patients were categorized according to the following threshold values: major risk (GNRI<82), moderate risk (GNRI 82 to <92), low risk (GNRI 92 to ≤98), and no risk (GNRI >98).8
Statistical Analysis
Categorical variables are expressed as numbers (percentages), and non-normally distributed continuous variables are presented as medians with interquartile range (IQR). Comparisons between groups were performed using Kruskal–Wallis test (continuous variables) or chi-square test (categorical variables). Univariate ordinal logistic regression analyses were performed to test the association between potential risk factors and frailty. Multivariate ordinal logistic regression analysis was further used to investigate the relationship between GNRI and frailty, controlling for age, male, polypharmacy, vision impairment, hearing impairment, cognitive impairment, depression, and CCI. The GNRI was included in regression models as continuous and categorical variables, respectively. Ordinal regression model, also known as the proportional odds model, estimates a single summary odds ratio (OR) and 95% confidence interval to describe the association of the outcome with the independent variable. We used the parallel lines test to verify the validity of the ordinal regression model and found that the proportional odds assumption was not significant in our data (P=0.209), indicating this model was valid.
The ability of GNRI scores in identifying frailty was examined by receiver operating characteristic (ROC) curve analysis. We determined the cut-off value of GNRI for identifying frailty based on the maximum Youden index (sensitivity + specificity-1). The usefulness of the cut-off value of GNRI in evaluating frailty was also assessed by the sensitivity, specificity, positive prediction value (PPV), and negative prediction value (NPV).
SPSS version 21.0 (IBM Crop., Armonk, NY) was used for statistical analysis. P-value ≤0.05 was considered to be statistically significant.
Results
A total of 1169 patients were eligible for the study; 107 patients were excluded for terminal condition, 113 for severe dementia, 119 for severe sensorial impairment, and 90 for missing data; 740 subjects were included in the final analysis. The median age was 84 years (IQR: 79–87) and males accounted for 71.2% (n=527) of the patients. Based on the GNRI, 207 (28%) patients were low risk, 129 (17.4%) were moderate risk, and 47 (6.4%) were major risk. According to the FRAIL scale, the prevalence of frailty and pre-frailty was 36.8% (n=272) and 38.9% (n=288). The sociodemographic and clinical characteristics of all participants are summarized in Table 1.
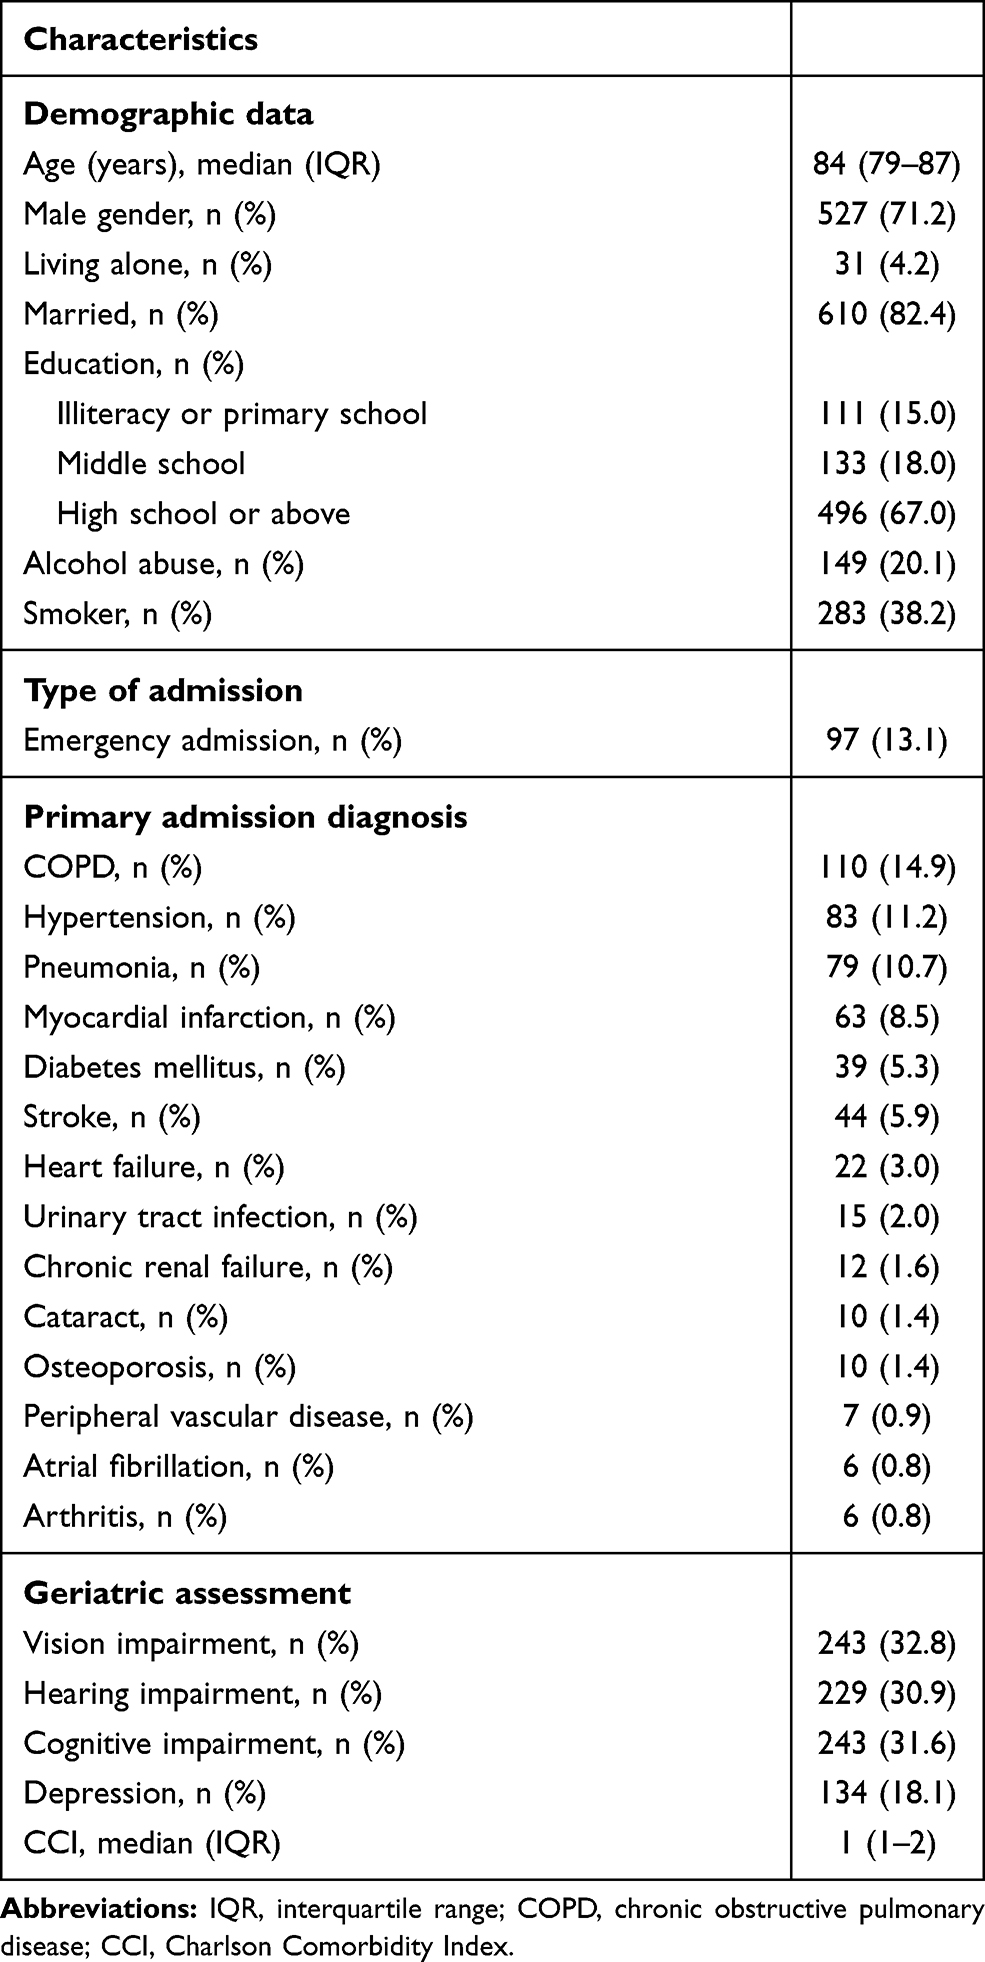 |
Table 1 Baseline Characteristics of the Study Participants |
The characteristics of the patients based on the degree of frailty are shown in Table 2. Compared to the robust patients, pre-frail and frail patients were significantly more likely to be older, more cognitively impaired, and had lower education. Besides, polypharmacy, emergency admission, impaired hearing, depression, comorbidity, and malnutrition were significantly more common among frail patients. The features of the population by nutritional risk are presented in Table 3. Major nutritional risk patients and no risk patients had a similar median age, but moderate risk patients were significantly older than those with no risk. Emergency admission, cognitive impairment, depression, and comorbidity were significantly found more often among major risk patients.
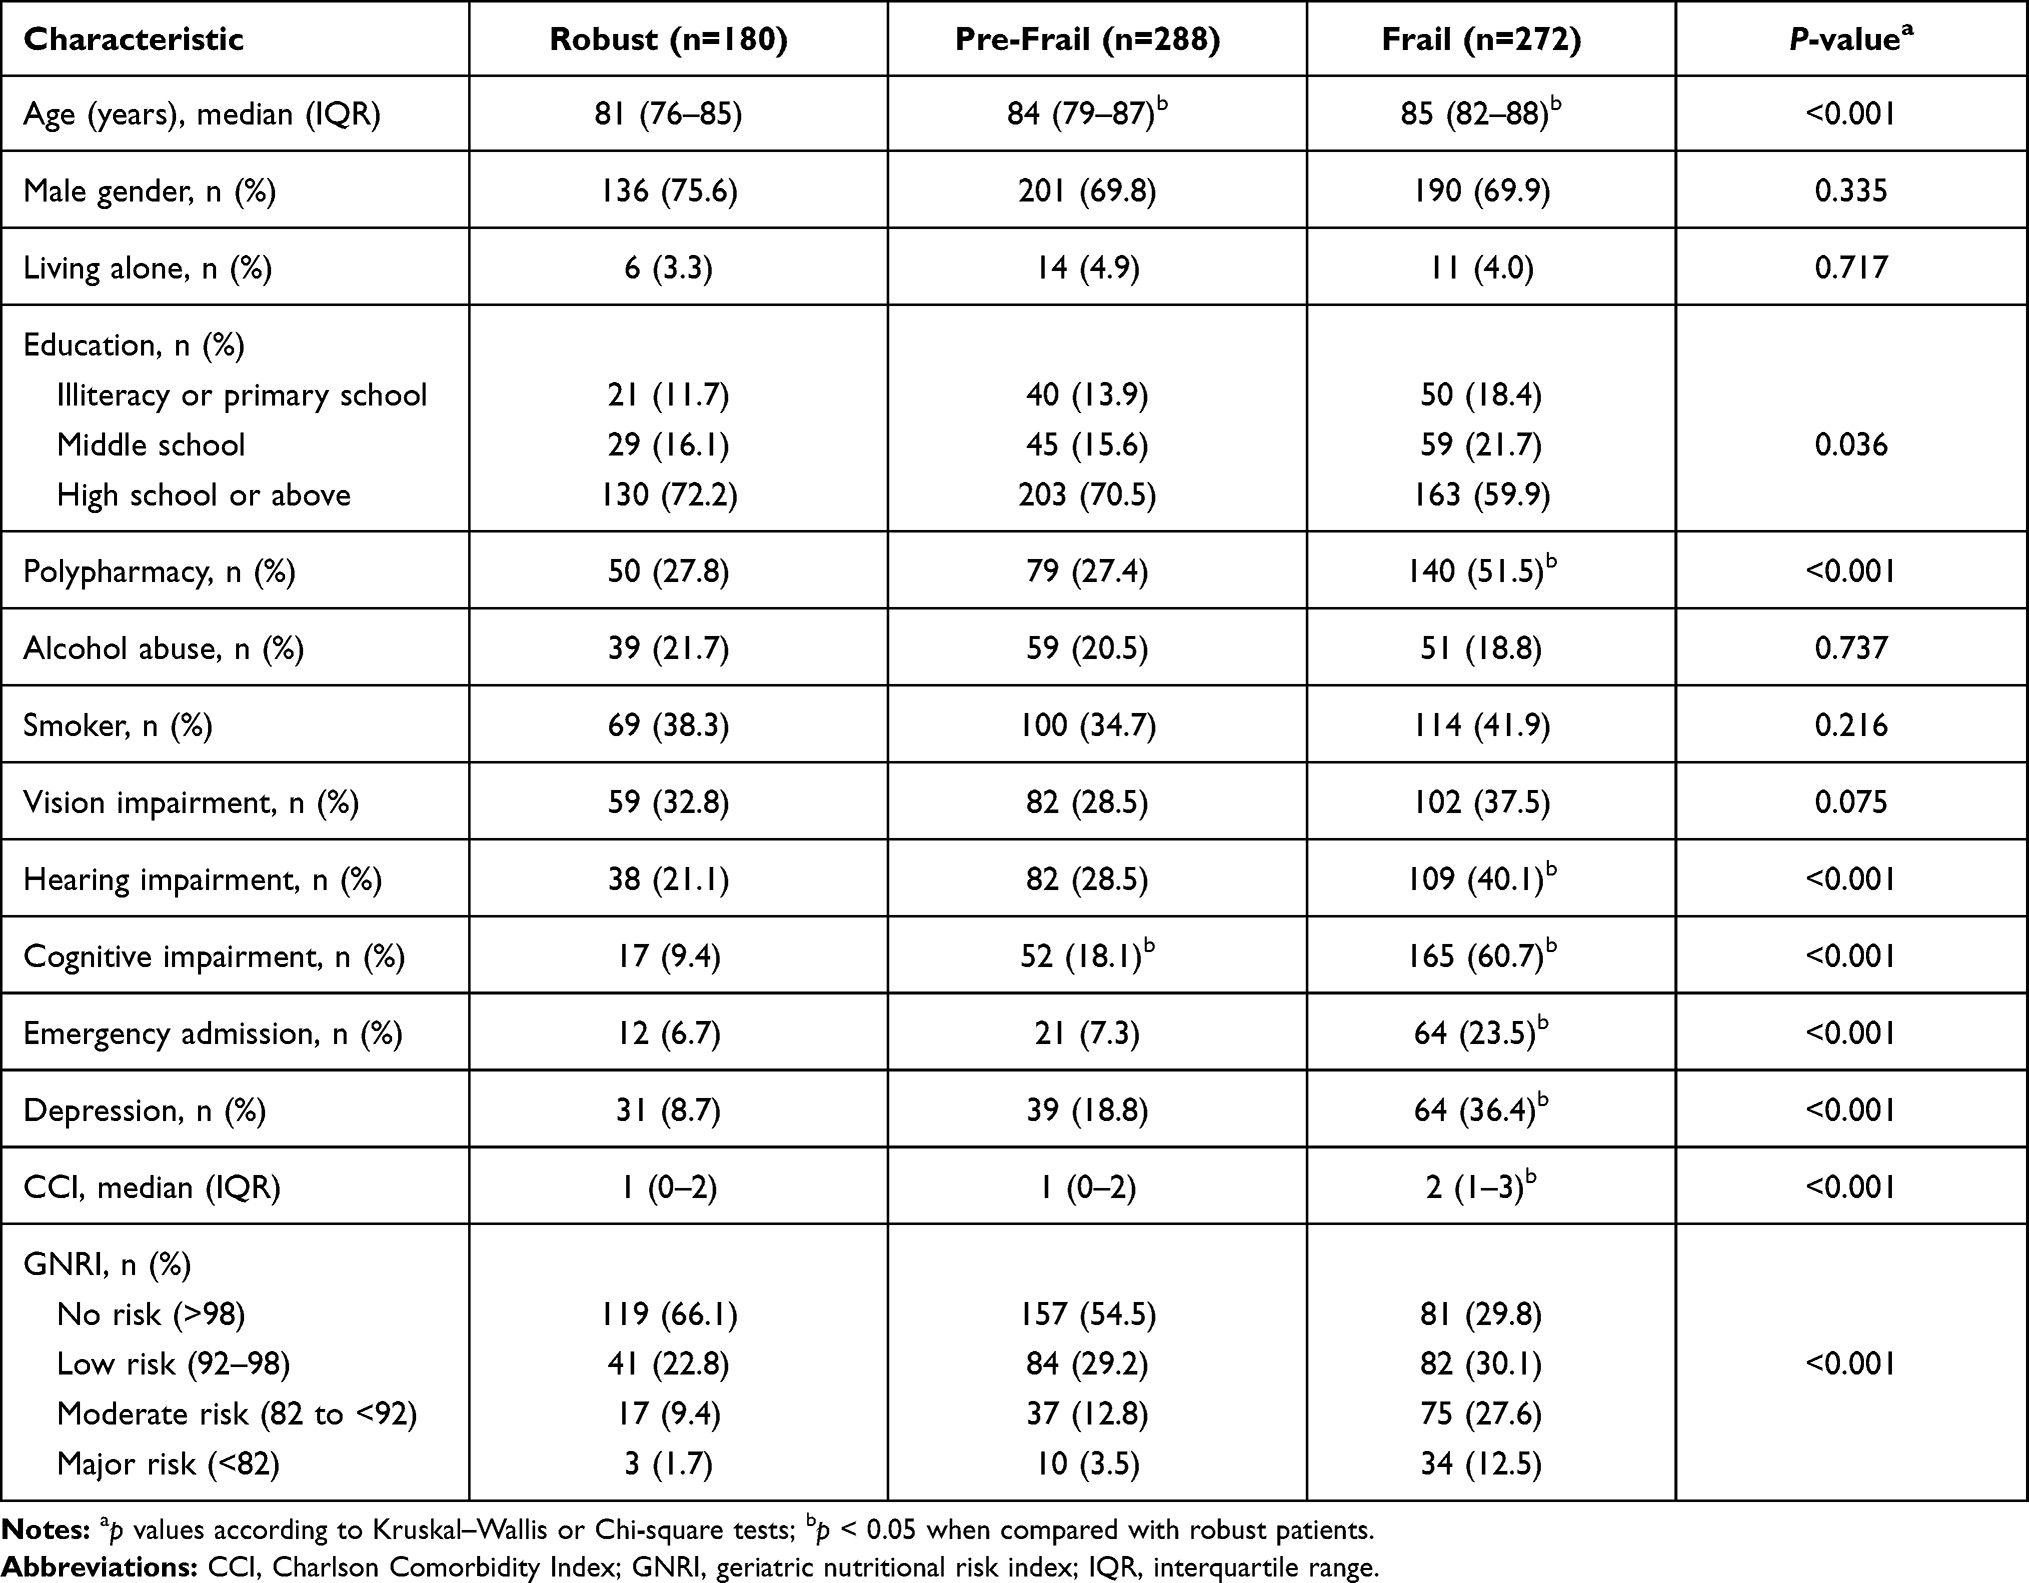 |
Table 2 Characteristics of Participants According to Frailty Status |
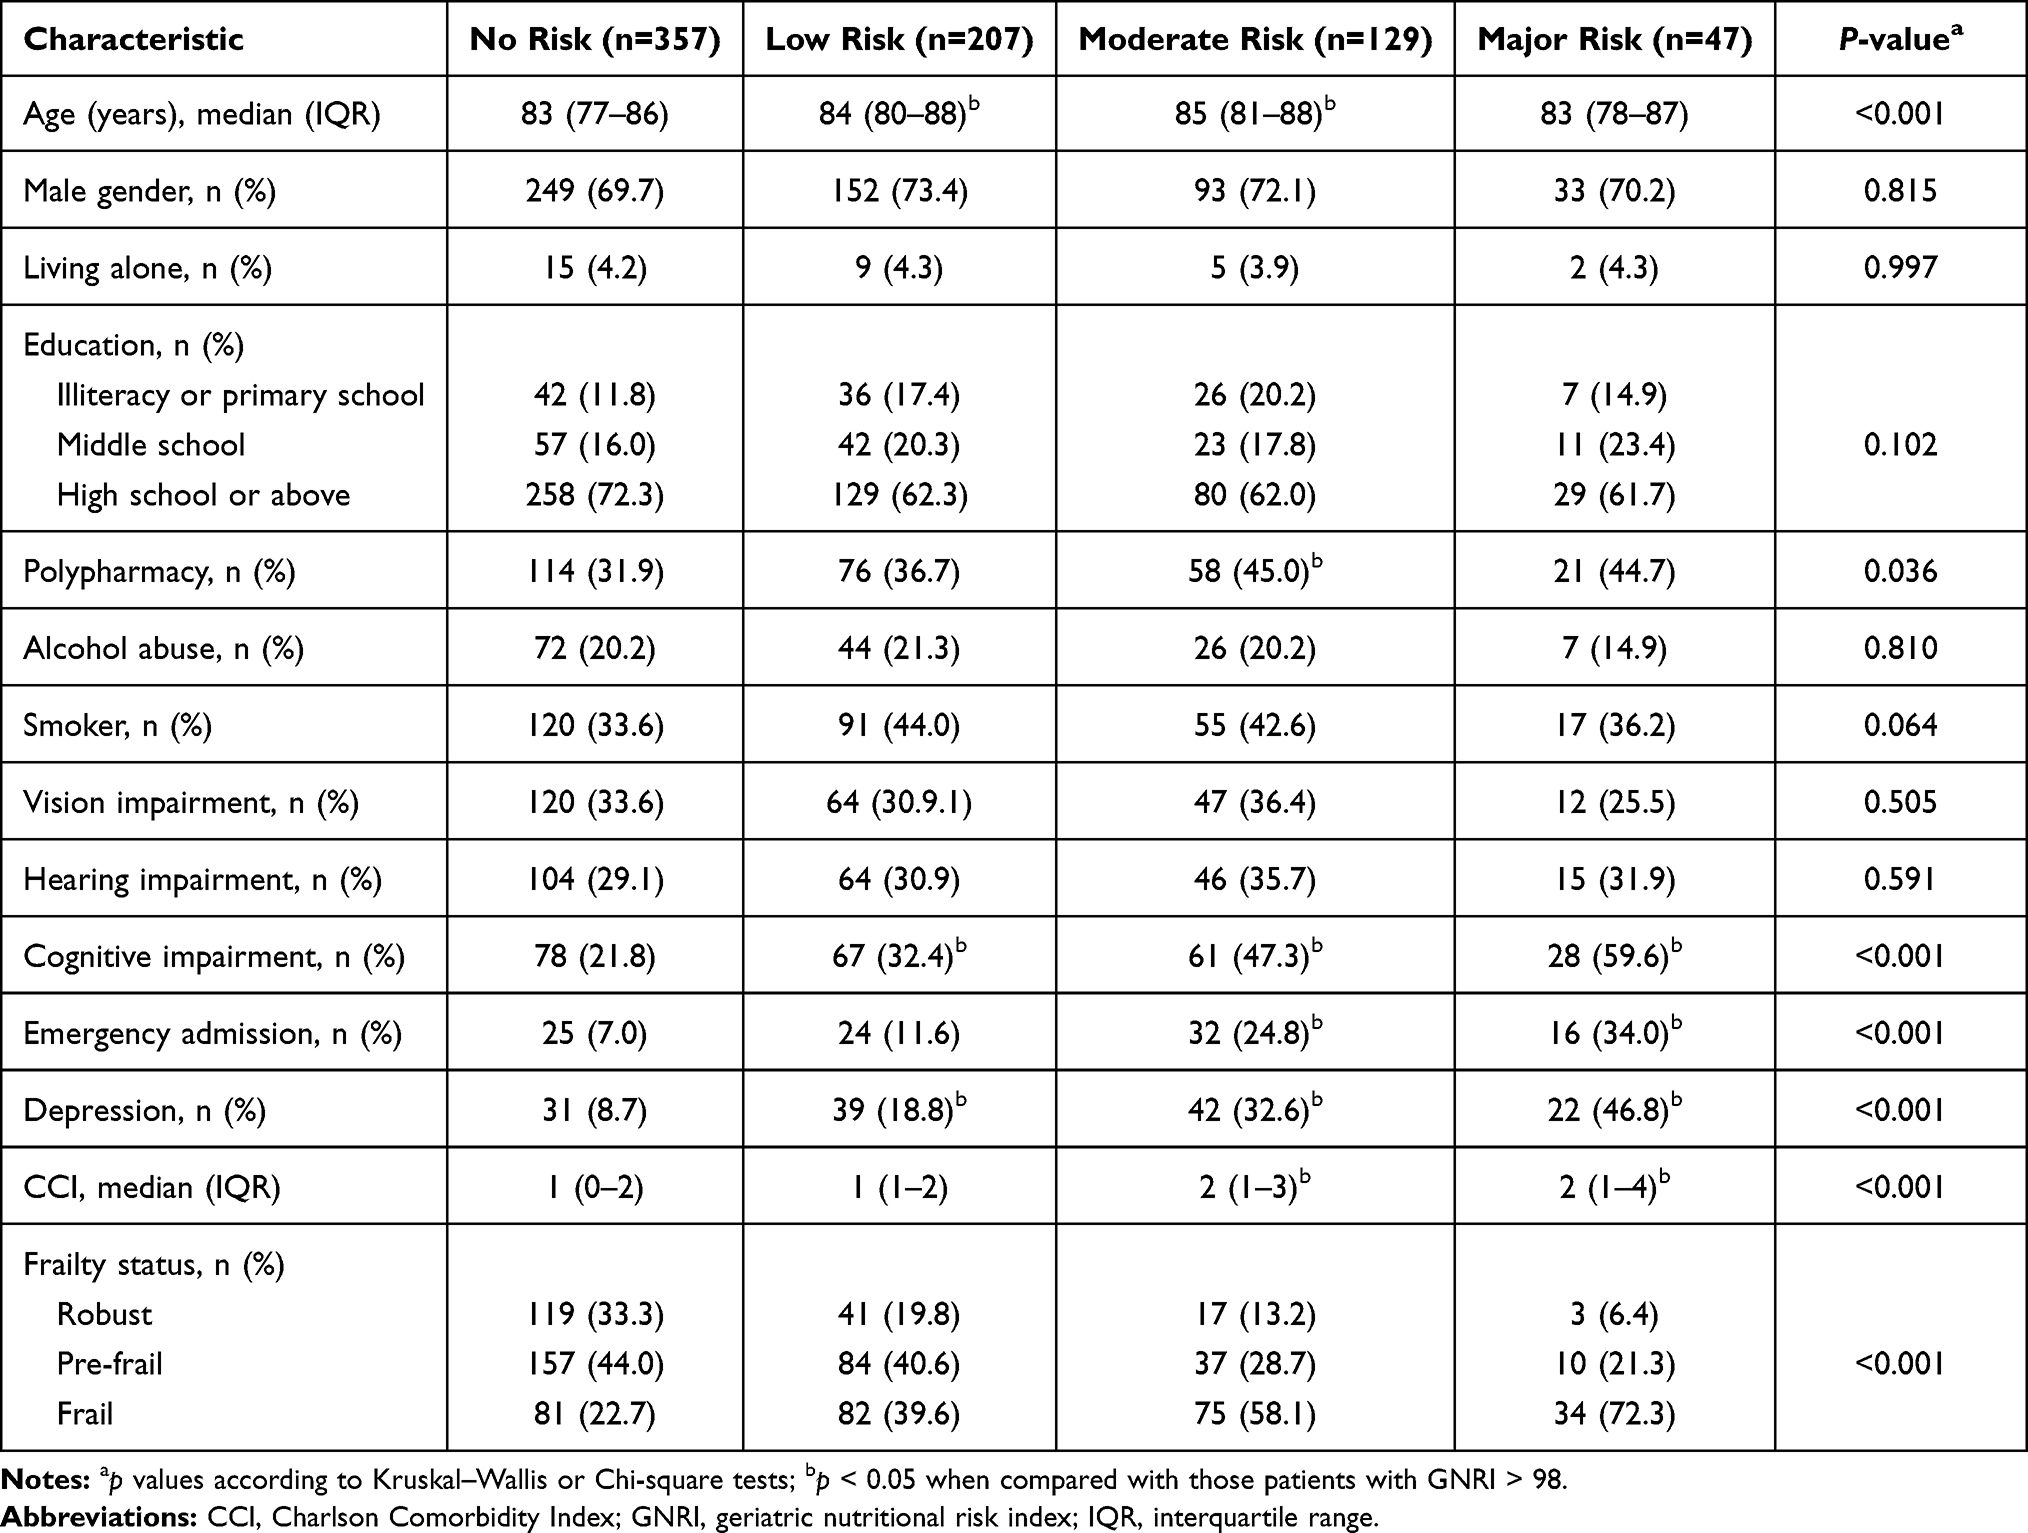 |
Table 3 Characteristics of Participants According to the GNRI |
Univariate ordinal logistic regression analysis revealed that frailty was significantly associated with age, polypharmacy, hearing impairment, cognitive impairment, depression, CCI, and the GNRI. Meanwhile, multivariable ordinal logistic regression analysis indicated that GNRI, modeled as categorical or continuous variable, was independently associated with frailty. Patients with higher risk of malnutrition had greater odds of frailty (Table 4).
 |
Table 4 Univariate and Multivariable Ordinal Logistic Regression Analyses of Potential Risk Factors for Frailty |
A ROC curve analysis was performed to test the ability of the GNRI in detecting frailty. As shown in Figure 1, the area under the ROC curve (AUC) was 0.698 (95% CI: 0.66–0.74; P<0.001). The optimal cut-off value for GNRI scores to identify frailty based on the highest Youden index was 97.16, with a sensitivity of 64.3% and specificity of 66.9%, while PPV and NPV were 46.97% and 76.3%, respectively.
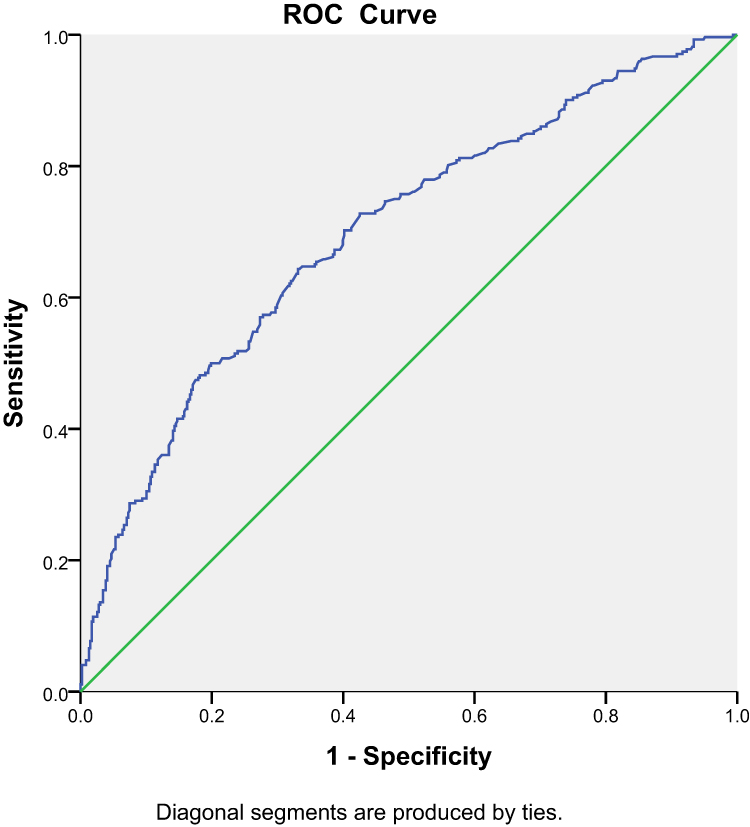 |
Figure 1 Receiver operating characteristics (ROC) of the GNRI to detect the risk of frailty. |
Discussion
Despite the extensive literature on the relationship of malnutrition with frailty, little is known about using the GNRI as a tool for detecting frailty status in older hospitalized patients. The present study, performed in a population of older hospitalized patients, found that nutrition-related risk assessed by the GNRI is independently associated with frailty. We particularly found that there was a dose–effect relationship between nutritional risk and frailty. Compared to those with no nutritional risk, the relative odds of frailty for those with low, moderate, and major nutritional risk were 1.61, 2.31, and 4.02, respectively. Therefore, this study demonstrates that the GNRI is a simple and useful tool to screen the frailty of older adults.
In the present study, only 13.1% of patients were from emergency departments. It is partially because that the geriatric department in a typical Chinese hospital has a distinct system. Wait lists for admission are common and few patients are admitted through emergency departments, resulting in admission from outpatient clinic still higher than from emergency department. The prevalence of frailty in our study population was found to be 36.8%. This finding agrees with previous literature showing that the prevalence of frailty ranged from 18% to 54% among older inpatients across different regions in China.18 The current study found that 51.8% of the participants were at risk of malnutrition and the prevalence of major nutritional risk was 6.4%. Cereda et al demonstrated similar results using the GNRI, with approximately 49.7% of older inpatients showing nutritional impairment (low, moderate, and major nutritional risk).19 However, our study’s prevalence of major nutritional risk was lower than that reported by their study (18.3%). A possible reason for this difference is that acutely hospitalized older people included in this previous study were more likely to have acute life-threatening complications, which may contribute to a higher level of nutritional risk.
In the present study, we found that the sensitivity and the AUC for the GNRI were somewhat inadequate. This could be explained by the fact that the GNRI only consists of objective parameters (height, weight, and serum albumin), but the FRAIL scale includes subjective questions, such as level of physical activity and functional status. Hence, it is worth combining the GNRI with functional status to detect the risk of frailty in future studies.
Advantages of the GNRI include that it is readily available to clinicians and requires low participation from patients.20 Moreover, the GNRI appears feasible in different healthcare settings because it is only based on objective parameters.20,21 Recent studies have demonstrated that poor nutritional status, screened by the MNA-SF or the full MNA, and frailty are closely related in hospitalized older patients,22–25 but data on the relationship of GNRI with frailty were lacking. Before designing the present study, only a small study by Rasheedy et al,26 including 150 hospitalized older patients, used the GNRI to assess its potential in identifying frailty and found a significant association between the GNRI and frailty status. Our results were consistent with the previous finding, but there was a large sample size in our study. Therefore, our findings expand knowledge about the nutritional status of the frail hospitalized older patients.
The nutritional evaluation is an important component for frailty screening because frail participants are a primary target for nutritional intervention.27 Thus, a number of screening tools of frailty, such as the Fried’s criteria, FRAIL scale, and the Edmonton scale, include at least one item about nutritional status.2,17,28 In addition, majority of these tools are time-consuming and require high level of patient cooperation.29 Therefore, easily applicable and time-saving tools are needed to screen the risk of frailty among older adults in busy clinical settings. Moreover, previous studies have found that serum albumin and body mass index (BMI), both are components of the GNRI, were independently correlated with frailty.30,31 Furthermore, body weight is a common element between structures of the GNRI and the FRAIL scale. Taken together, use of the GNRI, a simple and readily available index, in routine clinical practice may be help clinicians quickly detect patients who are at risk of frailty, and allowing for early nutritional intervention.
Yanagita et al31 revealed that patients with lower serum albumin had a higher incidence of frailty, suggesting that low serum albumin could be a risk factor for frailty. However, albumin is variant by dehydration, trauma, and hepatic or renal impairment, which prevents it from being a sensitive and specific nutritional marker.32 It is necessary to combine serum albumin with a more stable indicator such as body weight to predict nutrition-related risk. Additionally, previous studies have demonstrated that the GNRI, which combines serum albumin and body weight, had better performance in detecting nutrition-related complications than serum albumin alone.8 Thus, we considered that the GNRI might be a better method to identify the risk of frailty than albumin.
Malnutrition and frailty are prevalent in hospitalized older patients, and these two conditions are closely related in that they may share similar mechanisms. Malnutrition can lead to functional impairment, depression, falls, impaired immune function, and cognitive impairment, all of which are strongly associated with frailty.33–36 Moreover, malnutrition can result in a loss of muscle mass and strength due to an imbalance between muscle protein synthesis and degradation, consequently causing the development and progression of sarcopenia, which is an important etiological factor in developing frailty.2,37,38 Additionally, frailty, in turn, accelerates age-related decline in muscle mass, increasing the risk of impaired mobility,39 which further exacerbates the state of malnutrition.
Interestingly, we also found that nutritional risk was associated in a dose-effect manner with frailty. This finding suggests that there may be a continuum between the degree of malnutritional risk and risk of frailty. Accordingly, awareness of the potential benefits of good nutritional status in older adults may reduce the prevalence of frailty and prevent its progression. Even though the FRAIL scale is easy to administer, this tool requires more collaboration from patients than the GNRI. Thus, we propose the GNRI as a valid and effective tool for determining nutritional risk and risk of frailty simultaneously.
This study had several limitations. First, this is a cross-sectional study. Second, this was a single-center study; the results may not be generalizable to other clinical settings. Third, patients with severe dementia, severe sensorial impairment, or psychiatric illness were excluded because these subjects are unable to complete questionnaires. Finally, several measurements in our study were based on self-reported, which may result in misclassification bias.
In conclusion, the nutrition-related risk evaluated by the GNRI is strongly associated with frailty. These results suggest that the GNRI may serve as a simple and effective tool for identifying both nutritional risk and frailty status simultaneously in hospitalized older patients. The screening of nutrition-related risk in clinical practice may help clinicians to early identify patients with risk of frailty, and provide timely nutritional support to these patients. In the future, longitudinal research is necessary to investigate whether malnutrition is a useful independent predictor of frailty.
Abbreviations
GNRI, geriatric nutritional risk index; MNA-SF, Mini Nutritional Assessment-Short Form; SPMSQ, Short Portable Mental Status Questionnaire; CCI, Charlson Comorbidity Index; GDS-15, 15-item Geriatric Depression Scale; ROC, receiver operating characteristic; AUC, area under the curve; PPV, positive prediction value; NPV, negative prediction value.
Data Sharing Statement
There are no linked research data sets for this paper. Data will be made available on reasonable request to the corresponding author.
Ethical Approval and Informed Consent
Ethical approval was obtained from the Institutional Review Boards of West China Hospital, Sichuan University (West China Hospital #201440). All participants provided written informed consent prior to the interview.
Acknowledgments
We would like to thank the staff of the Department of Geriatrics Medicine, West China Hospital and all participants for their great contribution. Thanks to Dr Hui Wang (Department of Geriatrics and National Clinical Research Center for Geriatrics, West China Hospital of Sichuan University, China) for the statistical analyses.
Author Contributions
All authors made a significant contribution to the work reported, whether that is in the conception, study design, execution, acquisition of data, analysis and interpretation, or in all these areas; took part in drafting, revising or critically reviewing the article; gave final approval of the version to be published; have agreed on the journal to which the article has been submitted; and agree to be accountable for all aspects of the work.
Funding
This study was supported by Health Research of Cadres in Sichuan province (2019-106); the Chinese National Science & Technology Pillar Program (2020YFC2005600/02); Sichuan Science and Technology Program (2019YFS0277); National Clinical Research Center for Geriatrics, West China Hospital, Sichuan University (Z20191003, Z2018B13); and the 1.3.5 Project for Disciplines of Excellence-Clinical Research Incubation Project, West China Hospital, Sichuan University (19HXFH012).
Disclosure
The authors declare that they have no conflicts of interest.
References
1. Richards SJG, D’Souza J, Pascoe R, Falloon M, Frizelle FA. Prevalence of frailty in a tertiary hospital: a point prevalence observational study. PLoS One. 2019;14(7):e0219083. doi:10.1371/journal.pone.0219083
2. Fried LP, Tangen CM, Walston J, et al. Frailty in older adults: evidence for a phenotype. J Gerontol a Biol Sci Med Sci. 2001;56(3):M146–156. doi:10.1093/gerona/56.3.M146
3. Clegg A, Young J, Iliffe S, Rikkert MO, Rockwood K. Frailty in elderly people. Lancet. 2013;381(9868):752–762. doi:10.1016/S0140-6736(12)62167-9
4. Ates Bulut E, Soysal P, Isik AT. Frequency and coincidence of geriatric syndromes according to age groups: single-center experience in Turkey between 2013 and 2017. Clin Interv Aging. 2018;13:1899–1905. doi:10.2147/CIA.S180281
5. Yanai H. Nutrition for sarcopenia. J Clin Med Res. 2015;7(12):926–931. doi:10.14740/jocmr2361w
6. Hathaway B, Vaezi A, Egloff AM, Smith L, Wasserman-Wincko T, Johnson JT. Frailty measurements and dysphagia in the outpatient setting. Ann Otol Rhinol Laryngol. 2014;123(9):629–635. doi:10.1177/0003489414528669
7. Dent E, Hoogendijk EO, Visvanathan R, Wright ORL. Malnutrition screening and assessment in hospitalised older people: a review. J Nutr Health Aging. 2019;23(5):431–441. doi:10.1007/s12603-019-1176-z
8. Bouillanne O, Morineau G, Dupont C, et al. Geriatric nutritional risk index: a new index for evaluating at-risk elderly medical patients. Am J Clin Nutr. 2005;82(4):777–783. doi:10.1093/ajcn/82.4.777
9. Lee MJ, Kwon YE, Park KS, et al. Changes in geriatric nutritional risk index and risk of major adverse cardiac and cerebrovascular events in incident peritoneal dialysis patients. Kidney Res Clin Pract. 2017;36(4):377–386. doi:10.23876/j.krcp.2017.36.4.377
10. Cereda E, Klersy C, Pedrolli C, et al. The geriatric nutritional risk index predicts hospital length of stay and in-hospital weight loss in elderly patients. Clin Nutr. 2015;34(1):74–78. doi:10.1016/j.clnu.2014.01.017
11. Lee JS, Choi HS, Ko YG, Yun DH. Performance of the geriatric nutritional risk index in predicting 28-day hospital mortality in older adult patients with sepsis. Clin Nutr. 2013;32(5):843–848. doi:10.1016/j.clnu.2013.01.007
12. Funamizu N, Nakabayashi Y, Iida T, Kurihara K. Geriatric nutritional risk index predicts surgical site infection after pancreaticoduodenectomy. Mol Clin Oncol. 2018;9(3):274–278. doi:10.3892/mco.2018.1671
13. Viktil KK, Blix HS, Moger TA, Reikvam A. Polypharmacy as commonly defined is an indicator of limited value in the assessment of drug-related problems. Br J Clin Pharmacol. 2007;63(2):187–195. doi:10.1111/j.1365-2125.2006.02744.x
14. Pfeiffer E. A short portable mental status questionnaire for the assessment of organic brain deficit in elderly patients. J Am Geriatr Soc. 1975;23(10):433–441. doi:10.1111/j.1532-5415.1975.tb00927.x
15. Charlson ME, Pompei P, Ales KL, MacKenzie CR. A new method of classifying prognostic comorbidity in longitudinal studies: development and validation. J Chronic Dis. 1987;40(5):373–383. doi:10.1016/0021-9681(87)90171-8
16. D’Ath P, Katona P, Mullan E, Evans S, Katona C. Screening, detection and management of depression in elderly primary care attenders. I: the acceptability and performance of the 15 item geriatric depression scale (GDS15) and the development of short versions. Fam Pract. 1994;11(3):260–266. doi:10.1093/fampra/11.3.260
17. Morley JE, Malmstrom TK, Miller DK. A simple frailty questionnaire (FRAIL) predicts outcomes in middle aged African Americans. J Nutr Health Aging. 2012;16(7):601–608. doi:10.1007/s12603-012-0084-2
18. Liang YD, Zhang YN, Li YM, et al. Identification of frailty and its risk factors in elderly hospitalized patients from different wards: a cross-sectional study in China. Clin Interv Aging. 2019;14:2249–2259. doi:10.2147/CIA.S225149
19. Cereda E, Limonta D, Pusani C, Vanotti A. Geriatric nutritional risk index: a possible indicator of short-term mortality in acutely hospitalized older people. J Am Geriatr Soc. 2006;54(6):1011–1012. doi:10.1111/j.1532-5415.2006.00754.x
20. Cereda E, Pedrolli C. The geriatric nutritional risk index. Curr Opin Clin Nutr Metab Care. 2009;12(1):1–7. doi:10.1097/MCO.0b013e3283186f59
21. Cereda E, Limonta D, Pusani C, Vanotti A. Feasible use of estimated height for predicting outcome by the geriatric nutritional risk index in long-term care resident elderly. Gerontology. 2007;53(4):184–186. doi:10.1159/000099468
22. Dent E, Visvanathan R, Piantadosi C, Chapman I. Use of the mini nutritional assessment to detect frailty in hospitalised older people. J Nutr Health Aging. 2012;16(9):764–767. doi:10.1007/s12603-012-0405-5
23. Dorner TE, Luger E, Tschinderle J, et al. Association between nutritional status (MNA®-SF) and frailty (SHARE-FI) in acute hospitalised elderly patients. J Nutr Health Aging. 2014;18(3):264–269. doi:10.1007/s12603-013-0406-z
24. Hong X, Yan J, Xu L, Shen S, Zeng X, Chen L. Relationship between nutritional status and frailty in hospitalized older patients. Clin Interv Aging. 2019;14:105–111. doi:10.2147/CIA.S189040
25. Muszalik M, Gurtowski M, Doroszkiewicz H, Gobbens RJ, Kędziora-Kornatowska K. Assessment of the relationship between frailty syndrome and the nutritional status of older patients. Clin Interv Aging. 2019;14:773–780. doi:10.2147/CIA.S201835
26. Rasheedy D, El-Kawaly WH. The accuracy of the geriatric nutritional risk index in detecting frailty and sarcopenia in hospitalized older adults. Aging Clin Exp Res. 2020;32(12):2469–2477. doi:10.1007/s40520-020-01492-5
27. Lilamand M, Kelaiditi E, Cesari M, et al. Validation of the mini nutritional assessment-short form in a population of frail elders without disability. Analysis of the toulouse frailty platform population in 2013. J Nutr Health Aging. 2015;19(5):570–574. doi:10.1007/s12603-015-0457-4
28. Perna S, Francis MD, Bologna C, et al. Performance of Edmonton Frail Scale on frailty assessment: its association with multi-dimensional geriatric conditions assessed with specific screening tools. BMC Geriatr. 2017;17(1):1–8. doi:10.1186/s12877-016-0382-3
29. Ruiz JG, Priyadarshni S, Rahaman Z, et al. Validation of an automatically generated screening score for frailty: the care assessment need (CAN) score. BMC Geriatr. 2018;18(1):106. doi:10.1186/s12877-018-0802-7
30. Smit E, Winters-Stone KM, Loprinzi PD, Tang AM, Crespo CJ. Lower nutritional status and higher food insufficiency in frail older US adults. Br J Nutr. 2013;110(1):172–178. doi:10.1017/S000711451200459X
31. Yanagita I, Fujihara Y, Iwaya C, et al. Low serum albumin, aspartate aminotransferase, and body mass are risk factors for frailty in elderly people with diabetes-a cross-sectional study. BMC Geriatr. 2020;20(1):200. doi:10.1186/s12877-020-01601-z
32. Durán Alert P, Milà Villarroel R, Formiga F, Virgili Casas N, Vilarasau Farré C. Assessing risk screening methods of malnutrition in geriatric patients: mini nutritional assessment (MNA) versus geriatric nutritional risk index (GNRI). Nutr Hosp. 2012;27(2):590–598. doi:10.1590/S0212-16112012000200036
33. Chye L, Wei K, Nyunt MSZ, Gao Q, Wee SL, Ng TP. Strong relationship between malnutrition and cognitive frailty in the Singapore longitudinal ageing studies (SLAS-1 and SLAS-2). J Prev Alzheimers Dis. 2018;5(2):142–148. doi:10.14283/jpad.2017.46
34. Tavares D, Faria PM, Pegorari MS, Ferreira P, Nascimento JS, Marchiori GF. Frailty syndrome in association with depressive symptoms and functional disability among hospitalized elderly. Issues Ment Health Nurs. 2018;39(5):433–438. doi:10.1080/01612840.2018.1429035
35. Duarte GP, Santos JLF, Lebrão ML, Duarte YAO. Relationship of falls among the elderly and frailty components. Rev Bras Epidemiol. 2019;21(Suppl 02):e180017. doi:10.1590/1980-549720180017.supl.2
36. Wilson D, Jackson T, Sapey E, Lord JM. Frailty and sarcopenia: the potential role of an aged immune system. Ageing Res Rev. 2017;36:1–10. doi:10.1016/j.arr.2017.01.006
37. Morley JE, Vellas B, van Kan GA, et al. Frailty consensus: a call to action. J Am Med Dir Assoc. 2013;14(6):392–397. doi:10.1016/j.jamda.2013.03.022
38. Cruz-Jentoft AJ, Bahat G, Bauer J, et al. Sarcopenia: revised European consensus on definition and diagnosis. Age Ageing. 2019;48(1):16–31. doi:10.1093/ageing/afy169
39. Fashho E, Ahmed T, Garden G, et al. Investigating the prevalence of malnutrition, frailty and physical disability and the association between them amongst older care home residents. Clin Nutr ESPEN. 2020;40:231–236. doi:10.1016/j.clnesp.2020.09.014
 © 2021 The Author(s). This work is published and licensed by Dove Medical Press Limited. The
full terms of this license are available at https://www.dovepress.com/terms
and incorporate the Creative Commons Attribution
- Non Commercial (unported, 3.0) License.
By accessing the work you hereby accept the Terms. Non-commercial uses of the work are permitted
without any further permission from Dove Medical Press Limited, provided the work is properly
attributed. For permission for commercial use of this work, please see paragraphs 4.2 and 5 of our Terms.
© 2021 The Author(s). This work is published and licensed by Dove Medical Press Limited. The
full terms of this license are available at https://www.dovepress.com/terms
and incorporate the Creative Commons Attribution
- Non Commercial (unported, 3.0) License.
By accessing the work you hereby accept the Terms. Non-commercial uses of the work are permitted
without any further permission from Dove Medical Press Limited, provided the work is properly
attributed. For permission for commercial use of this work, please see paragraphs 4.2 and 5 of our Terms.