
Back to Journals » Clinical Ophthalmology » Volume 19
Assessment of Intraocular Pressure Measurement Between Goldmann Applanation Tonometer and Portable Non-Contact Tonometer (TH1U)
Authors Peng X  , Wang J, Chen J, Wu Y, Wang T , Li W, Xu X
Received 19 July 2025
Accepted for publication 1 November 2025
Published 11 November 2025 Volume 2025:19 Pages 4205—4215
DOI https://doi.org/10.2147/OPTH.S554838
Checked for plagiarism Yes
Review by Single anonymous peer review
Peer reviewer comments 4
Editor who approved publication: Dr John Miller
Xianyao Peng, Jiahui Wang, Jiaqi Chen, Yinan Wu, Tianyu Wang, Wuliang Li, Xiaoping Xu
Ningbo Key Laboratory of Medical Research on Blinding Eye Diseases, Ningbo Eye Institute, Ningbo Eye Hospital, Wenzhou Medical University, Ningbo, People’s Republic of China
Correspondence: Xiaoping Xu, Ningbo Key Laboratory of Medical Research on Blinding Eye Diseases, Ningbo Eye Institute, Ningbo Eye Hospital, Wenzhou Medical University, No. 599, Beimingcheng Road, Yinzhou District, Ningbo, Zhejiang, 315040, People’s Republic of China, Email [email protected]
Purpose: To investigate the consistency of intraocular pressure measurements between portable non-contact tonometer (PNCT) and Goldmann applanation tonometer (GAT).
Patients and Methods: A total of 81 participants (150 eyes) who were aged ≥ 18 years and had no history of eye surgery within 3 months were recruited. Eyes were categorized into three IOP groups: 7– 16 mmHg (n = 50, 33.3%), > 16 to < 23 mmHg (n = 50, 33.3%), and ≥ 23 mmHg (n = 50, 33.3%). All participants underwent PNCT and GAT intraocular pressure measurements in sequence, and central corneal thickness (CCT) was recorded. Pearson correlation analysis was used to evaluate the correlation between PNCT and GAT intraocular pressure results, and the intraclass correlation coefficient (ICC) and Bland-Altman method were used to evaluate the consistency. The effect of CCT on intraocular pressure measurement was further analyzed.
Results: A total of 81 subjects (150 eyes) were included. The mean intraocular pressure measured by GAT and PNCT was 21.1± 7.8mmHg and 21.4± 7.5mmHg, respectively, with no significant difference between the two (P> 0.05). The IOP values measured by the two devices were highly positively correlated (r²=0.934, P< 0.001), with an ICC of 0.933, indicating good consistency. Bland-Altman analysis showed that the mean difference between GAT and PNCT was − 0.2± 2.8mmHg, the limits of agreement (LoA) was +5.3 to − 5.8mmHg, and 93.33% of the differences fell within ± 5mmHg. CCT was significantly positively correlated with the IOP values measured by both devices, but did not significantly impact the agreement between them.
Conclusion: PNCT demonstrates high consistency with GAT and offers a reliable alternative for IOP monitoring. Its portability, non-contact operation, and automatic measurement function make it particularly suitable for home-based and long-term glaucoma management.
Keywords: intraocular pressure, goldmann applanation tonometer, portable non-contact tonometer, central corneal thickness
Introduction
Intraocular pressure (IOP) is a fundamental parameter in the diagnosis and management of ophthalmic diseases, particularly in the screening, diagnosis, and follow-up of glaucoma. Accurate IOP measurement is essential, as variations in IOP influence clinical decisions and disease prognosis. The first tonometer was introduced by Von Graefe in 1865, marking the beginning of quantitative IOP assessment.1 Since then, various tonometers have been developed, including the Maklakoff tonometer, Goldmann applanation tonometer (GAT), Perkins tonometer, rebound tonometers, and non-contact tonometer (NCT). Among these, GAT is considered the gold standard for IOP measurement. GAT estimates IOP based on the Imbert–Fick law and measuring the force required to flatten a known area of the central cornea.2 Despite its widespread use, GAT has certain limitations, such as the need for topical anesthesia, fluorescein staining, and dependence on both corneal properties and operator technique.
NCT has gained popularity in clinical and community settings due to its non-invasive nature, ease of use, and enhanced patient comfort.3,4 In January 2025, a newly developed portable non-contact tonometer (PNCT) was launched in China. It’s still a desktop device, but its compact design makes it very portable In addition to the conventional advantages of NCT, PNCT introduces a one-button automatic measurement feature, enabling patients to measure their IOP independently with voice prompts. This advancement reduces reliance on healthcare professionals and makes it suitable for a variety of scenarios, such as community hospitals, optometry centers, nursing homes, pharmacies, and homebased IOP monitoring. The present study aims to evaluate the measurement accuracy and consistency of PNCT compared to GAT.
Patients and Methods
Participants
From January 22 to May 7, 2025, adult participants (≥18 years old) were prospectively recruited from the outpatient department of Ningbo Eye Hospital. Eligible individuals included those with normal or elevated IOP and no history of ocular surgery within the preceding 3 months. Participants were divided into three groups (7 to 16 mmHg, >16 to <23 mmHg and ≥23 mmH), each including at least 40 eyes in accordance with ISO 8612:2009.5
Exclusion criteria were as follows: (1) monocular visual function; (2) poor fixation or eccentric fixation; (3) high corneal astigmatism (>3 diopters); (4) corneal scarring or history of corneal surgery; (5) axial length >26 mm or <19 mm; (6) contact lens wearers; (7) severe dry eye (tear break-up time <2 seconds); (8) eyelid squeezing; (9) nystagmus; (10) keratoconus; (11) any other corneal or conjunctival disease or active ocular infection. All participants provided written informed consent prior to enrollment. The study adhered to the tenets of the Declaration of Helsinki, and the appropriate study approval was obtained from the institutional ethics committee.
PNCT
The PNCT (Model TH1U, Zhejiang Jiamu Medical Technology Co., Ltd., China) is a portable non-contact tonometer that builds upon the advantages of conventional NCT by introducing a one-touch automatic measurement function. It utilizes two infrared CMOS cameras to capture corneal imaging and determine the optimal alignment between the cornea and the device. Based on the acquired data, the X/Y/Z axes are automatically adjusted by electric motors to position the device appropriately. Once aligned, the PNCT initiates IOP measurement and subsequently moves automatically to the contralateral eye to complete bilateral assessment.
Similar to GAT, PNCT estimates IOP based on the Imbert-Fick law. It delivers a controlled air puff to deform the central cornea, and a high-speed optical system records the deformation process. Advanced image-processing algorithms, combined with sensitive pressure sensors in the air pathway, are then used to calculate the applied force, thereby estimating the intraocular pressure.
Measurement Procedures
All participants underwent IOP measurement using PNCT followed by GAT in a fixed order. PNCT measurements were performed by participants themselves following the voice prompts broadcast of the device. Three valid measurements were obtained per eye, and the average was recorded by a single trained examiner in accordance with the manufacturer’s instructions. If the participants encountered difficulties, the examiner provided guidance.
GAT measurements were conducted by a designated ophthalmologist using a GAT (Model AT900, Haag-Streit, Switzerland) mounted on a slit-lamp biomicroscope (Model LSM-1ER, Topcon, Japan). One drop of proparacaine hydrochloride ophthalmic solution was instilled for topical anesthesia. Fluorescein dye was applied using a paper strip placed into the conjunctival sac, and excess tear film was removed with a cotton swab. Two measurements were taken per eye and averaged. If the two values differed by more than 2 mmHg, a third measurement was obtained, and the median value was used. PNCT and GAT measurements were performed by two independent examiners, with an interval of no more than 5 minutes between the tests.
Central corneal thickness (CCT) was measured using the Pentacam anterior segment imaging system (OCULUS, Model 70900, Germany). Axial length was measured using the IOLMaster 500 (Carl Zeiss Meditec, Jena, Germany).
Statistical Analysis
Statistical analyses were conducted using SPSS version 21.0 (IBM Corp., Armonk, NY, USA) and MedCalc version 22.0 (MedCalc Software, Belgium). The correlation between GAT and PNCT IOP measurements was assessed using Pearson correlation analysis. Agreement between the two devices was further evaluated using the intraclass correlation coefficient (ICC) and Bland–Altman plots. The percentages of IOP differences within ±2 mmHg, ±3 mmHg, and ±5 mmHg between GAT and PNCT were calculated. In addition, Pearson correlation analysis was used to assess the relationship between CCT and IOP values measured by both PNCT and GAT. To further examine the role of CCT, multiple linear regression analysis was performed with PNCT as the dependent variable and GAT and CCT as independent variables. Simple linear regression was also conducted to assess whether CCT predicts the measurement difference between GAT and PNCT. Statistical significance was set at P < 0.05.
Results
A total of 81 participants were enrolled in this study. Twelve eyes were excluded due to a history of ocular surgery within the preceding 3 months, resulting in a final sample of 150 eyes.
The mean age was 47.7 ± 16.8 years (range: 19–82 years). There were 48 males (59.3%) and 33 females (40.7%), Chi-square analysis showed no significant difference in gender distribution (χ² = 2.778, p = 0.096) (Table 1). The mean CCT was 554.7 ± 34.2 µm, ranging from 518 to 660 µm. Based on GAT measurements, eyes were categorized into three IOP groups: 7 to 16 mmHg (n = 50, 33.3%), >16 to <23 mmHg (n = 50, 33.3%), and ≥23 mmHg (n = 50, 33.3%) (Table 1).
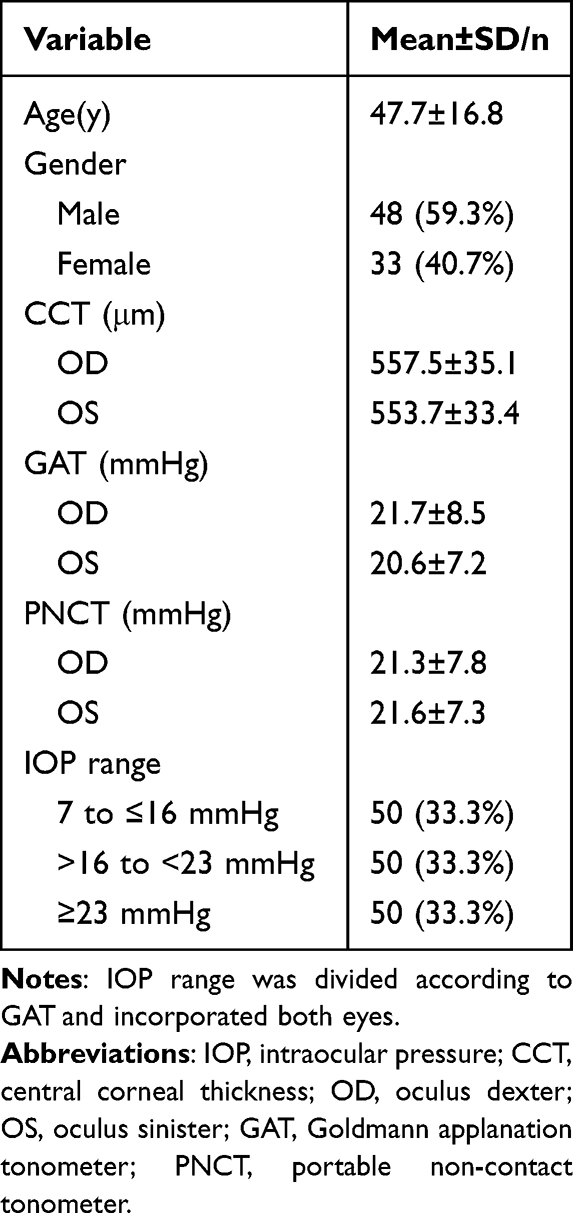 |
Table 1 Demographics and IOP of Study Population |
The mean IOP measured by PNCT was 21.4 ± 7.5 mmHg (range: 11.3–41.0 mmHg), while that measured by GAT was 21.1 ± 7.8 mmHg (range: 8.0–45.0 mmHg). The difference between the two methods was not statistically significant (P > 0.05) (Table 2). In the low IOP group (7 to 16 mmHg), mean IOP measured by GAT and PNCT was 14.1 ± 1.6 mmHg and 15.2 ± 2.0 mmHg, respectively, with a mean difference of –1.1 ± 2.0 mmHg (t = –3.734, P < 0.001). In the moderate IOP group (>16 to <23 mmHg), mean IOP values were 19.6 ± 1.8 mmHg for both GAT and PNCT, with a mean difference of 0.0 ± 2.6 mmHg (t = 0.000, P = 1.000). In the high IOP group (≥23 mmHg), mean IOP was 29.7 ± 7.4 mmHg for GAT and 29.4 ± 7.2 mmHg for PNCT, with a mean difference of 0.3 ± 3.5 mmHg,(t = 0.679, P = 0.500) (Table 3). Pearson correlation analysis demonstrated a strong positive correlation between PNCT and GAT measurements (r = 0.934, P < 0.001) (Figure 1). The ICC was 0.933, with 95% confidence interval (CI) ranging from 0.908 to 0.951 (P < 0.001), indicating excellent agreement between the two devices (Table 4).
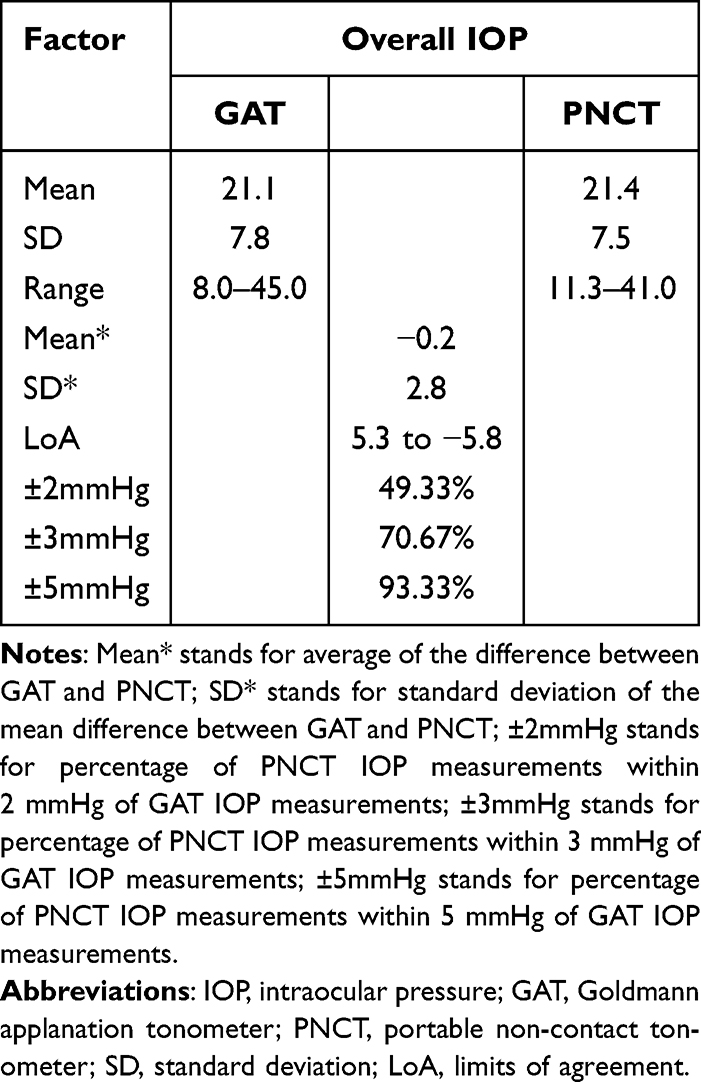 |
Table 2 Overview of Intraocular Pressure Measurements by PNCT and GAT |
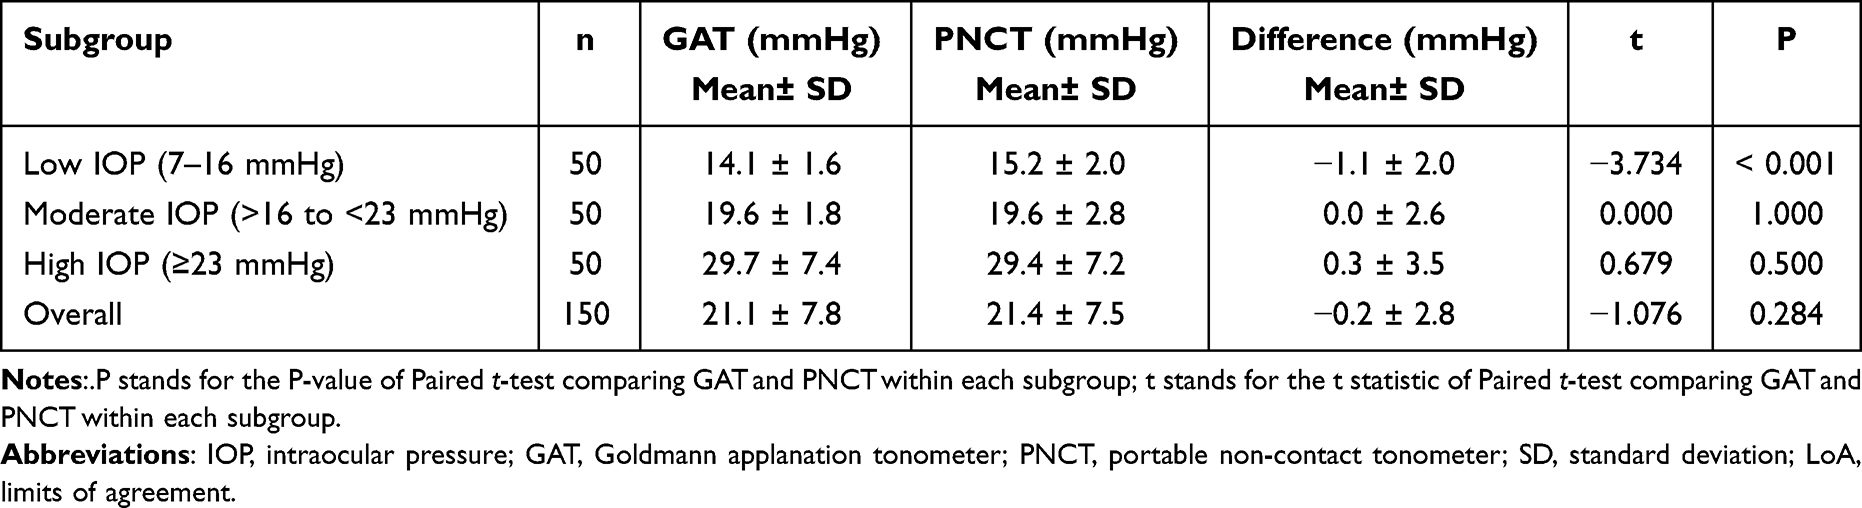 |
Table 3 Comparison of Intraocular Pressure Measurements Between GAT and PNCT Across Different Subgroups |
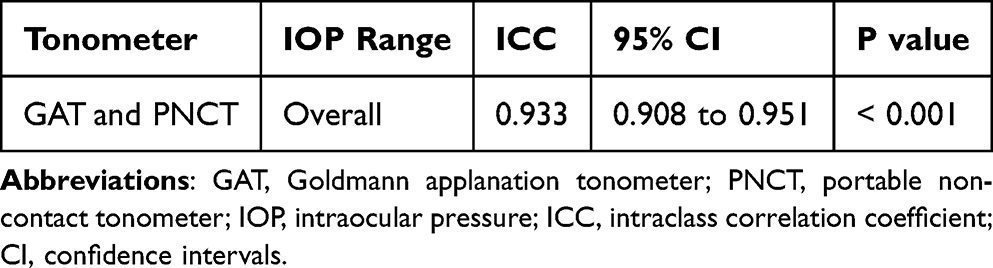 |
Table 4 Intraclass Correlation Coefficient Among GAT and PNCT |
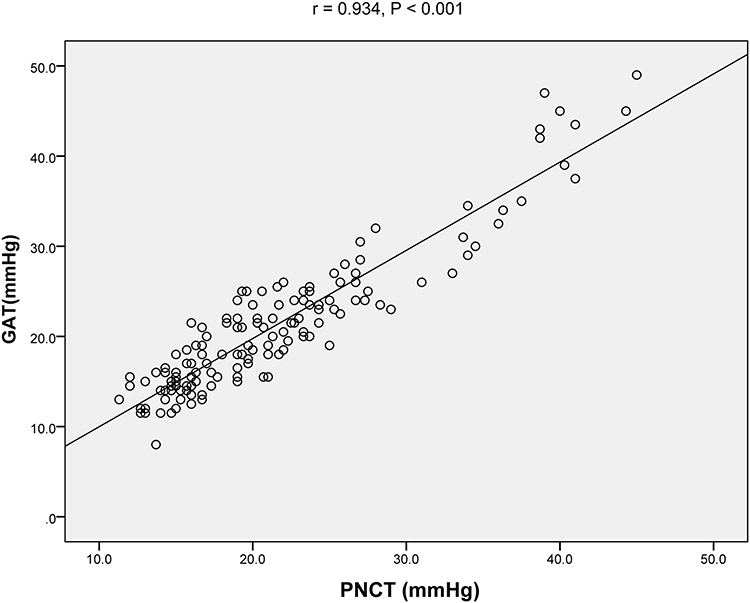 |
Figure 1 Correlation scatter plot of intraocular pressure (IOP) value measured by Goldmann applanation tonometer (GAT) and portable non-contact tonometer (PNCT), and fitted straight line correlation plot. A strong positive correlation was observed between the two devices (r=0.934, P < 0.001), indicating high measurement agreement. |
Bland–Altman analysis revealed that the overall mean difference between GAT and PNCT was −0.2 ± 2.8 mmHg, with 95% limits of agreement (LoA) ranging from +5.3 to –5.8 mmHg (Figure 2). One-sample t-test indicated no significant fixed bias (P = 0.194), and linear regression analysis demonstrated no significant proportional bias (slope = 0.049; 95% CI, −0.014 to 0.111; P = 0.125). The proportion of eyes with measurement differences within ±2 mmHg, ±3 mmHg, and ±5 mmHg were 49.33%, 70.67%, and 93.33%, respectively.
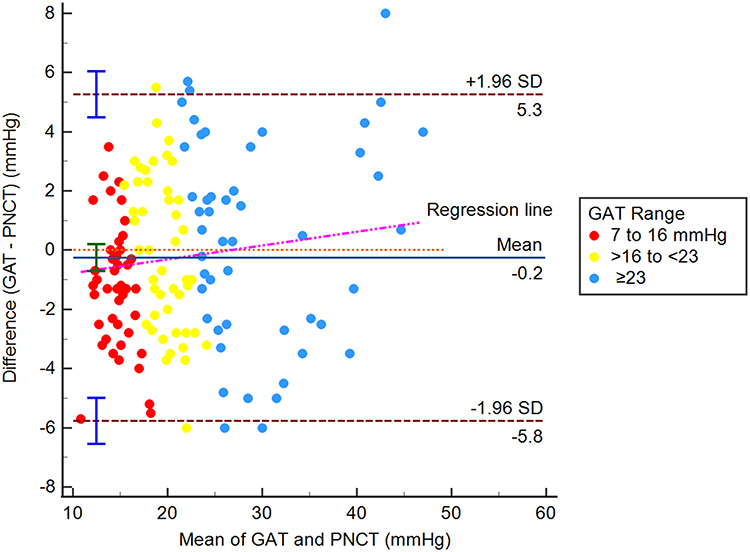 |
Figure 2 Bland-Altman plot comparing Goldmann applanation tonometer (GAT) and portable non-contact tonometer (PNCT) for all intraocular pressure (IOP) groups. The mean difference was −0.2 ± 2.8 mmHg, with 95% limits of agreement ranging from +5.3 to −5.8 mmHg. Linear regression analysis demonstrated no significant proportional bias (slope = 0.049; 95% CI, −0.014 to 0.111; P = 0.125). |
In the low-to-moderate IOP group (7 mmHg ≤ IOP < 23 mmHg), the mean difference between GAT and PNCT was −0.5 ± 2.4 mmHg, with LoA ranging from +4.1 to –5.2 mmHg (Figure 3). One-sample t-test indicated significant fixed bias (P < 0.05), and linear regression analysis demonstrated no significant proportional bias (slope = −0.016; 95% CI, −0.173 to 0.141; P = 0.840). In the high IOP group (IOP ≥ 23 mmHg), PNCT tended to slightly underestimate IOP compared to GAT, with a mean difference of 0.3 ± 3.5 mmHg and LoA from +7.1 to –6.5 mmHg (Figure 4). One-sample t-test indicated no significant fixed bias (P = 0.500), and linear regression analysis demonstrated no significant proportional bias (slope = 0.020; 95% CI, −0.122 to 0.162; P = 0.780).
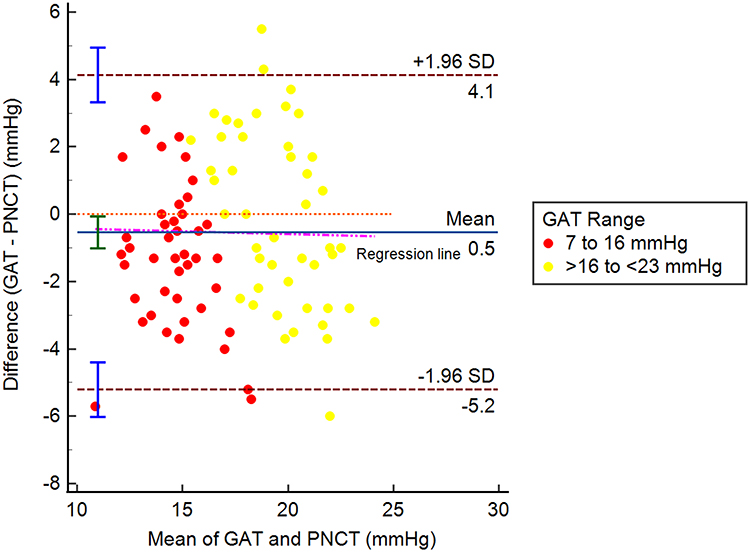 |
Figure 3 Bland-Altman plot comparing Goldmann applanation tonometer (GAT) and portable non-contact tonometer (PNCT) for the low-to-moderate intraocular pressure (IOP) group (7 mmHg ≤ IOP < 23 mmHg). The mean difference was −0.5 ± 2.4 mmHg, with limits of agreement between +4.1 and −5.2 mmHg. Linear regression analysis demonstrated no significant proportional bias (slope = −0.016; 95% CI, −0.173 to 0.141; P = 0.840). |
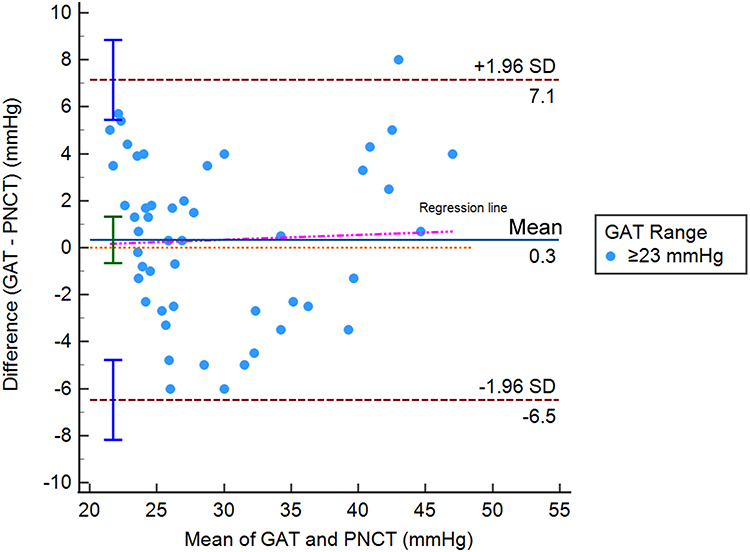 |
Figure 4 Bland-Altman plot comparing Goldmann applanation tonometer (GAT) and portable non-contact tonometer (PNCT) for the high intraocular pressure (IOP) group (IOP ≥ 23 mmHg). The mean difference of 0.3 ± 3.5 mmHg and limits of agreement between +7.1 and −6.5 mmHg. Linear regression analysis demonstrated no significant proportional bias (slope = 0.020; 95% CI, −0.122 to 0.162; P = 0.780). |
Pearson correlation analysis demonstrated a significant positive correlation between PNCT and CCT (r = 0.281, P < 0.05) (Figure 5A), as well as between GAT and CCT (r = 0.239, P < 0.05) (Figure 5B). However, the difference between PNCT and GAT measurements showed no correlation with CCT (r = 0.084, P = 0.312) (Figure 5C). Multiple linear regression showed that GAT was a strong independent predictor of PNCT measurements (unstandardized β = 0.884; 95% CI, 0.828–0.940; P < 0.001; standardized β = 0.923). Although CCT demonstrated a trend toward significance (unstandardized β = 0.008; 95% CI, 0.000–0.016; P = 0.059; standardized β = 0.056), the effect size was clinically negligible. The model explained 88.1% of the variance in PNCT (r² = 0.881; adjusted r² = 0.879). In a separate simple linear regression, CCT was not a significant predictor of the inter-device measurement difference (β = 0.007; 95% CI, –0.006 to 0.021; P = 0.281; r² = 0.008), as the confidence interval included zero.
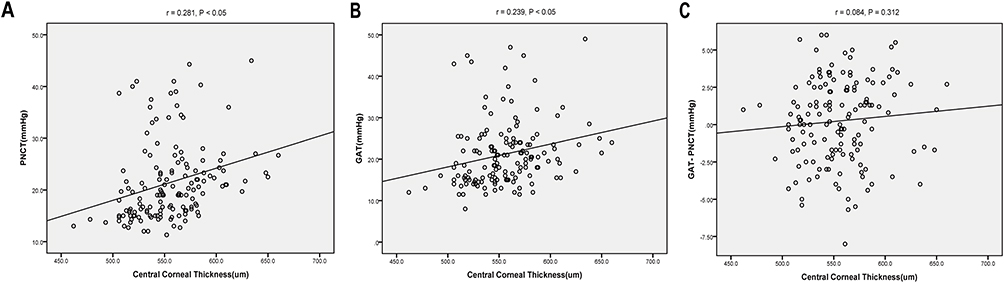 |
Figure 5 Correlation between central corneal thickness (CCT) and intraocular pressure (IOP). (A) Correlation between CCT and IOP measured by Goldmann applanation tonometer (GAT); (B) Correlation between CCT and IOP measured by portable non-contact tonometer (PNCT); (C) Correlation between CCT and the difference between GAT and PNCT. |
Discussion
The GAT is widely regarded as the “gold standard” for measuring IOP. However, GAT has certain limitations, including the requirement for topical anesthesia, susceptibility to corneal conditions and operator skills, and an increased risk of corneal infection. In contrast, NCT has become one of the most widely used methods in clinical practice due to its advantages such as being noninvasive, easy to operate, more comfortable for patients, and associated with a lower risk of corneal injury and infection. In recent years, the development of novel tonometers has accelerated. PNCT adds the advantages of portability and self-measurement to NCT, making it suitable for various scenarios. The strong correlation and agreement between PNCT and GAT observed in our study suggest that PNCT can serve as a reliable alternative for IOP measurement in clinical practice.
Our study showed that the mean IOP values measured by PNCT and GAT were 21.4 ± 7.5 mmHg and 21.1 ± 7.8 mmHg, respectively, with no statistically significant difference between them (P > 0.05). This indicates that the IOP readings obtained by the two devices were comparable. Similarly, a study measured IOP in 249 patients diagnosed with glaucoma or ocular hypertension using GAT and two NCT devices (Tomey NCT and Corvis ST), they found that the mean values from GAT and Corvis ST were similar, whereas both differed significantly from Tomey NCT, which tended to produce lower IOP readings.6 Another study also compared GAT with two NCT devices (Reichert 7CR and Corvis ST) in 90 patients with primary open-angle glaucoma and observed that GAT and Corvis ST differed significantly in non-corneal-compensated mode, while no significant difference was noted between GAT and Reichert 7CR.7 In a review which analyzed comparative studies between GAT and NCT from 2005 to 2020, seven out of thirteen NCT devices showed no significant difference from GAT (P < 0.05), whereas six devices did (P > 0.05).8 These findings suggest that, in addition to technical parameters, operator-related variability, pressure dynamics, and corneal thickness, the specific brand and model of NCT may also influence measurement outcomes.
In addition to comparing mean IOP values, evaluating the agreement between PNCT and GAT is essential to determine their interchangeability in clinical diagnosis and management of ocular diseases.9 In our study, Pearson correlation analysis revealed a strong correlation between PNCT and GAT measurements (r = 0.934, P < 0.001), and the intraclass correlation coefficient (ICC) was 0.933, indicating a high level of agreement between the two devices. These results support the potential interchangeability of PNCT with the current gold standard, GAT. Similar findings have been reported in recent comparative studies between various NCT devices and GAT.8,10–12
Furthermore, the Bland-Altman analysis confirmed the strong agreement between GAT and PNCT. Across all IOP values, the mean difference between the two devices was only −0.2 ± 2.8 mmHg, with 95% LoA ranging from +5.3 to −5.8 mmHg. This support the potential interchangeability of PNCT and GAT in clinical settings. Although in our study, 70.67% of measurements fell within ±3 mmHg and 93.33% within ± 5 mmHg, which did not falls within the acceptable tolerance range of ±5 mmHg outlined by ISO 8612 standards for new tonometers5 compared with GAT. Previous studies have also employed Bland-Altman plots to evaluate agreement between NCT and GAT. A study evaluated the TRK-3 OMNIA NCT and GAT, reporting a mean difference of −0.2 mmHg and LoA ranging from −5.0 to +4.6 mmHg.10 Similarly, another study conducted a meta-analysis of eight tonometers and found that NCT had the smallest discrepancy with GAT, with a mean difference of 0.2 mmHg and LoA from −3.8 to +4.3 mmHg.13 These findings are consistent with our results.
In addition, our subgroup analysis revealed that baseline IOP levels may influence the measurement discrepancy between GAT and PNCT. In the low IOP group (7 to 16 mmHg), PNCT significantly overestimated IOP compared to GAT (15.2 ± 2.0 mmHg vs 14.1 ± 1.6 mmHg, P < 0.001), with the difference being statistically significant. In the moderate IOP group (>16 to <23 mmHg), the two methods showed perfect agreement, with identical mean values and mean difference (P = 1.000). In the high IOP group (≥23 mmHg), PNCT showed a tendency to slightly underestimate IOP (29.4 ± 7.2 mmHg vs 29.7 ± 7.4 mmHg, P = 0.500). In the low-to-moderate IOP group (7 mmHg ≤ IOP < 23 mmHg), the mean difference was −0.5 ± 2.4 mmHg, with LoA from +4.1 to −5.2 mmHg. In the high IOP group (IOP ≥ 23 mmHg), PNCT tended to slightly underestimate IOP, with a mean difference of 0.3 ± 3.5 mmHg and LoA ranging from +7.1 to −6.5 mmHg. These findings suggest a tendency of PNCT to overestimate IOP in lower pressure ranges and slightly underestimate it at higher levels, when compared to GAT. Similar trends were reported by Chaglasian,10 who observed that NCT overestimated IOP in low-pressure eyes (mean difference: +2.1 mmHg; LoA: −1.2 to +5.4 mmHg) and underestimated in high-pressure eyes (mean difference: −2.4 mmHg; LoA: −5.9 to +1.1 mmHg), though they used a different classification scheme. Another study confirmed that when IOP exceeded 21 mmHg, NCT readings were significantly lower than those obtained via GAT (P = 0.016).7 However, a study reported an opposite trend, where NCT overestimated at high IOP and underestimated at low IOP.14 Another study also observed a general tendency of NCT to overestimate IOP across all pressure ranges.15 These inconsistencies may be attributable to differences in air-puff calibration, sensor sensitivity, limitations intrinsic to NCT technology, or biomechanical changes in the cornea at varying IOP levels.10 From a biomechanical perspective, the observed IOP-dependent measurement discrepancies can be explained by changes in corneal rigidity and deformation resistance at different pressure levels.16 Under elevated IOP, increased corneal stiffness may impede the air-puff-induced deformation necessary for accurate NCT readings, potentially leading to underestimation.17 In contrast, GAT’s direct contact method with operator-controlled force may be less affected by these rigidity changes.1 Additionally, reduced corneal hysteresis at higher IOP levels14 and individual variations in corneal biomechanical properties18 can differentially affect NCT versus GAT measurements. Regardless of the direction of bias, these findings underscore that higher IOP levels are associated with greater inaccuracy in NCT readings.19 Clinically, overestimation in low IOP cases may lead to unnecessary treatment escalation, whereas underestimation at high IOP could delay timely intervention. Therefore, understanding the degree and direction of deviation from GAT, the clinical reference standard, is critical in patient management.
CCT is a well-recognized factor influencing IOP measurements, particularly for applanation-based and non-contact tonometry methods, where its impact cannot be overlooked.20–22 In our study, both GAT and PNCT showed statistically significant positive correlations with CCT (PNCT: r = 0.281, P < 0.05; GAT: r = 0.239, P < 0.05). Porwal et al also reported significant correlations between CCT and all types of tonometers examined, noting that NCT exhibited the highest correlation (r = 0.4037).11 Similar findings have been corroborated in other studies.23,24 To further clarify the role of CCT, we performed regression analyses. Multiple linear regression revealed that while CCT showed a marginal trend toward affecting PNCT measurements after controlling for GAT (P = 0.059), the effect size was clinically negligible (β = 0.008 mmHg per 1 μm increase in CCT). More importantly, simple linear regression demonstrated that CCT was not a significant predictor of the measurement difference between GAT and PNCT (P = 0.281, r² = 0.008), with the 95% CI for the regression coefficient including zero. This indicates that although both GAT and PNCT are influenced by CCT to some degree, this does not compromise the agreement between them. This finding supports the applicability of PNCT across populations with varying corneal thickness.
This study has several limitations. First, it was conducted at a single center with a relatively limited sample size. Specific subgroups such as pediatric patients, post-operative cases, or individuals with abnormal corneal conditions were not included, and the applicability of PNCT in these populations remains to be validated. Second, all participants were measured in the fixed order of PNCT followed by GAT, which could introduce a slight systematic bias. Furthermore, as a newly released device, the long-term stability and measurement repeatability of PNCT warrant further investigation in larger, multicenter studies with extended follow-up periods.
Conclusion
Our findings demonstrate a high degree of correlation and agreement between PNCT and GAT in measuring intraocular pressure, although measurements did not fall within the acceptable tolerance range of ±5 mmHg. Nevertheless, further studies are warranted to evaluate its long-term performance and broader applicability across diverse clinical settings and patient populations.
Abbreviations
IOP, Intraocular pressure; PNCT, portable non-contact tonometer; GAT, Goldmann applanation tonometer; CCT, central corneal thickness; ICC, intraclass correlation coefficient; CI, confidence interval; LoA, limits of agreement.
Data Sharing Statement
The datasets created and analyzed during the current study available from the corresponding author on reasonable request.
Ethics Approval
Ethics approval was obtained from the research ethics committee of the Ningbo Eye Hospital by number 2024-81(K)-C1.
Author Contributions
All authors made a significant contribution to the work reported, whether that is in the conception, study design, execution, acquisition of data, analysis and interpretation, or in all these areas; took part in drafting, revising or critically reviewing the article; gave final approval of the version to be published; have agreed on the journal to which the article has been submitted; and agree to be accountable for all aspects of the work.
Funding
Xianyao Peng was supported by the Ningbo Eye Hospital Science and Technology Project under No. 2024YB011.
Disclosure
The authors report no conflicts of interest in this work.
References
1. Stamper RL. A history of intraocular pressure and its measurement. Optom Vis Sci. 2011;88(1):E16–28. doi:10.1097/OPX.0b013e318205a4e7
2. Walker HK, Hall WD, Hurst JW. Clinical Methods: The History, Physical, and Laboratory Examinations.
3. Vernon SA, Henry DJ, Cater L, Jones SJ. Screening for glaucoma in the community by non-ophthalmologically trained staff using semi automated equipment. Eye. 1990;4(Pt 1):89–97. doi:10.1038/eye.1990.10
4. Vernon SA. Non-contact tonometry in the postoperative eye. Br J Ophthalmol. 1989;73(4):247–249. doi:10.1136/bjo.73.4.247
5. ISO 8612:2009; ophthalmic instruments—tonometers. international organization for standardization: Geneva, Switzerland. 2009. Available from: https://www.iso.org/standard/44536.html.
6. Luebke J, Bryniok L, Neuburger M, et al. Intraocular pressure measurement with Corvis ST in comparison with applanation tonometry and Tomey non-contact tonometry. Int Ophthalmol. 2019;39(11):2517–2521. doi:10.1007/s10792-019-01098-5
7. Nakao Y, Kiuchi Y, Okimoto S. A comparison of the corrected intraocular pressure obtained by the corvis ST and reichert 7CR tonometers in glaucoma patients. PLoS One. 2017;12(1):e0170206. doi:10.1371/journal.pone.0170206
8. Stock RA, Ströher C, Sampaio RR, Mergener RA, Bonamigo EL. A comparative study between the goldmann applanation tonometer and the non-contact air-puff tonometer (Huvitz HNT 7000) in normal eyes. Clin Ophthalmol. 2021;15:445–451. doi:10.2147/OPTH.S294710
9. Brusini P, Salvetat ML, Zeppieri M. How to measure intraocular pressure: an updated review of various tonometers. J Clin Med. 2021;10(17):3860. doi:10.3390/jcm10173860
10. Chaglasian M, Hou H, Tafreshi M, et al. Clinical assessment of automated non-contact tonometer: interchangeability with goldmann applanation tonometry and repeatability. J Clin Med. 2025;14(8):2726. doi:10.3390/jcm14082726
11. Porwal AC, Shrishrimal M, Punamia RP, Mathew BC. Assessment of intraocular pressure measurement between goldman applanation tonometer, rebound tonometer, non-contact tonometer, and its correlation with central corneal thickness. Indian J Ophthalmol. 2023;71(5):1927–1931. doi:10.4103/ijo.IJO_1982_22
12. Duran M. Comparison of intraocular pressure measurements obtained by icare pro tonometer, non-contact tonometer and Goldmann applanation tonometer in healthy individuals. J Fr Ophtalmol. 2023;46(10):1195–1203. doi:10.1016/j.jfo.2023.01.042
13. Ja C, Ap B, E A, et al. Systematic review of the agreement of tonometers with goldmann applanation tonometry. Ophthalmology. 2012;119(8). doi:10.1016/j.ophtha.2012.02.030
14. Tonnu PA, Ho T, Sharma K, White E, Bunce C, Garway-Heath D. A comparison of four methods of tonometry: method agreement and interobserver variability. Br J Ophthalmol. 2005;89(7):847–850. doi:10.1136/bjo.2004.056614
15. Li HG, Chen YH, Lin F, et al. Agreement of intraocular pressure measurement with Corvis ST, non-contact tonometer, and Goldmann applanation tonometer in children with ocular hypertension and related factors. Int J Ophthalmol. 2023;16(10):1601–1607. doi:10.18240/ijo.2023.10.07
16. Elsheikh A, Wang D, Pye D. Determination of the modulus of elasticity of the human cornea. J Refract Surg. 2007;23(8):808–818. doi:10.3928/1081-597X-20071001-11
17. Jaycock PD, Lobo L, Ibrahim J, et al. Interferometric technique to measure biomechanical changes in the cornea induced by refractive surgery. J Cataract Refract Surg. 2005;31(1):175–184. doi:10.1016/j.jcrs.2004.10.038
18. Whitacre MM, Stein R. Sources of error with use of Goldmann-type tonometers. Surv Ophthalmol. 1993;38(1):1–30. doi:10.1016/0039-6257(93)90053-a
19. Farhood QK. Comparative evaluation of intraocular pressure with an air-puff tonometer versus a Goldmann applanation tonometer. Clin Ophthalmol. 2013;7:23–27. doi:10.2147/OPTH.S38418
20. Ko YC, Liu C, Hsu WM. Varying effects of corneal thickness on intraocular pressure measurements with different tonometers. Eye. 2005;19(3):327–332. doi:10.1038/sj.eye.6701458
21. Nuyen B, Mansouri K. Fundamentals and Advances in Tonometry. Asia-Pac J Ophthalmol. 2015;4(2):66–75. doi:10.1097/APO.0000000000000118
22. Bader J, Zeppieri M, Havens SJ. Tonometry. In: StatPearls. Treasure Island, FL: StatPearls Publishing; 2023.
23. Erdogan H, Akingol Z, Cam O, et al. A comparison of NCT, goldman application tonometry values with and without fluorescein. Clin Ophthalmol. 2018;12:2183–2188. doi:10.2147/OPTH.S177870
24. Kyei S, Assiamah F, Kwarteng MA, et al. The association of central corneal thickness and intraocular pressure measures by non-contact tonometry and goldmann applanation tonometry among glaucoma patients. Ethiop J Health Sci. 2020;30(6):999–1004. doi:10.4314/ejhs.v30i6.18
 © 2025 The Author(s). This work is published and licensed by Dove Medical Press Limited. The
full terms of this license are available at https://www.dovepress.com/terms
and incorporate the Creative Commons Attribution
- Non Commercial (unported, 4.0) License.
By accessing the work you hereby accept the Terms. Non-commercial uses of the work are permitted
without any further permission from Dove Medical Press Limited, provided the work is properly
attributed. For permission for commercial use of this work, please see paragraphs 4.2 and 5 of our Terms.
© 2025 The Author(s). This work is published and licensed by Dove Medical Press Limited. The
full terms of this license are available at https://www.dovepress.com/terms
and incorporate the Creative Commons Attribution
- Non Commercial (unported, 4.0) License.
By accessing the work you hereby accept the Terms. Non-commercial uses of the work are permitted
without any further permission from Dove Medical Press Limited, provided the work is properly
attributed. For permission for commercial use of this work, please see paragraphs 4.2 and 5 of our Terms.