Back to Journals » Medical Devices: Evidence and Research » Volume 13
Assessment of Glycemic Control Protocol (STAR) Through Compliance Analysis Amongst Malaysian ICU Patients
Authors Abdul Razak A ![]() , Abu-Samah A
, Abu-Samah A ![]() , Abdul Razak NN
, Abdul Razak NN ![]() , Jamaludin U, Suhaimi F, Ralib A, Mat Nor MB, Pretty C, Knopp JL, Chase JG
, Jamaludin U, Suhaimi F, Ralib A, Mat Nor MB, Pretty C, Knopp JL, Chase JG
Received 20 September 2019
Accepted for publication 15 January 2020
Published 4 June 2020 Volume 2020:13 Pages 139—149
DOI https://doi.org/10.2147/MDER.S231856
Checked for plagiarism Yes
Review by Single anonymous peer review
Peer reviewer comments 2
Editor who approved publication: Dr Scott Fraser
Athirah Abdul Razak,1 Asma Abu-Samah,2 Normy Norfiza Abdul Razak,1 Ummu Jamaludin,3 Fatanah Suhaimi,4 Azrina Ralib,5 Mohd Basri Mat Nor,6 Christopher Pretty,7 Jennifer Laura Knopp,7 James Geoffrey Chase7
1College of Engineering, Universiti Tenaga Nasional, Kajang, Malaysia; 2Department of Electrical, Electronics and Systems, Faculty of Engineering and Built Environment, Universiti Kebangsaan Malaysia, Bangi, Malaysia; 3Department of Mechanical Engineering, Universiti Malaysia Pahang, Kuantan, Malaysia; 4Advanced Medical and Dental Institute, Universiti Sains Malaysia, Pulau Pinang, Malaysia; 5Department of Anesthesiology, International Islamic University Malaysia, Kuantan, Malaysia; 6Intensive Care Unit, International Islamic University Medical Centre, Kuantan, Malaysia; 7Department of Mechanical Engineering, University of Canterbury, Christchurch, New Zealand
Correspondence: Normy Norfiza Abdul Razak; Athirah Abdul Razak Email [email protected]; [email protected]
Purpose: This paper presents an assessment of an automated and personalized stochastic targeted (STAR) glycemic control protocol compliance in Malaysian intensive care unit (ICU) patients to ensure an optimized usage.
Patients and Methods: STAR proposes 1– 3 hours treatment based on individual insulin sensitivity variation and history of blood glucose, insulin, and nutrition. A total of 136 patients recorded data from STAR pilot trial in Malaysia (2017–quarter of 2019*) were used in the study to identify the gap between chosen administered insulin and nutrition intervention as recommended by STAR, and the real intervention performed.
Results: The results show the percentage of insulin compliance increased from 2017 to first quarter of 2019* and fluctuated in feed administrations. Overall compliance amounted to 98.8% and 97.7% for administered insulin and feed, respectively. There was higher average of 17 blood glucose measurements per day than in other centres that have been using STAR, but longer intervals were selected when recommended. Control safety and performance were similar for all periods showing no obvious correlation to compliance.
Conclusion: The results indicate that STAR, an automated model-based protocol is positively accepted among the Malaysian ICU clinicians to automate glycemic control and the usage can be extended to other hospitals already. Performance could be improved with several propositions.
Keywords: compliance, glycemic control, diabetes, stochastic targeted prediction, model-based control
Introduction
Intensive care unit (ICU) patients are predisposed to stress hyperglycemia due to insulin resistance arising from the initial insult.1–3 It is associated with increased risks of multiple organ failures, sepsis, and mortality.4–7 Glycemic control (GC) has been used to reduce hyperglycemia and mortality.8–11 However, other studies were unable to produce the same results.12,13 Only one study reduced both mortality and hypoglycemia,11 where increased hypoglycemic risk was an independent risk factor for increased mortality.14,15
Glycemic control in the ICU becomes more challenging when there is a transition of conventional therapy using manual insulin treatment towards automated personalized treatments. For example, a “one size fits all method” or ad-hoc insulin therapy normally used as GC guidelines for fast clinical decision but the GC treatment may not necessarily effective, productive or cost-saving.16,17 As each patient is different, the clinical treatment needed could be different, and patient’s safety is also counted for GC primary consideration. Whereas manual insulin therapy or ad-hoc protocols used in the ICU patients need to rely on “one size fits all method” for clinical judgement rather than patient-specific variability.18 Thus, if more advanced technologies treatment is used for an effective GC, all of the challenges rise need to be countered.
Recent studies have shown safe, effective control for almost all patients is critical to improve outcomes,19–21 validating other analyses showing time in band is associated with survival.22–26 For better, more personalised control, fixed insulin protocols have been replaced by automated patient-specific model-based glycemic control.17,27-32 The stochastic targeted (STAR), in particular, is focused on using patient-specific time-varying insulin sensitivity33 to provide safe, effective control to essentially all patients with reduced workload and increased nutrition delivery.34–37
STAR uses a well-validated physiological model38 and a user-friendly interface designed for accuracy39,40 to dose insulin based on risk of future changes in insulin sensitivity (SI),41,42 an approach proven to generalise across adult37,43 and neonatal ICUs,44–46 as well as with other technologies.47,48 This protocol was adopted in Malaysia29 after successful studies internationally.27,31,37,49 Initial assessment of the first Malaysian pilot trial showed the control was safe. However, the percentage of blood glucose (BG) within the Malaysian target band of 6.0–10.0 mmol/L (108–180 mg/dL) was 60.7%, which is much lower than expected50 and lower than in other studies with lower target bands and equal safety in other countries.37
Despite very positive feedback from clinicians through a survey conducted at the International Islamic University Malaysia Medical Centre (IIUMMC) using the protocol,51 this paper presents a compliance analysis to identify the level of clinician adherence to STAR protocol recommendations. The assessment covers three years of patient data using STAR, covering compliance to insulin and nutrition recommendations.
Methods
Retrospective data from 170 IIUMMC patients (equivalent to 349 episodes of glycemic control) in the general ICU from 2017 to 2019* were retrieved from the STAR cloud database. The data in 2019* were used until the first quarter of 2019. Collected patients' data have received IIUMMC consent under ethics IREC 657 and Malaysian National Institute of Health (NIH). Patient diagnosis was unavailable for now in this study due to incomplete overall data.
A patient can have multiple episodes of STAR GC if control was stopped and then restarted, which happens when patients meet stopping criteria but re-develop hyperglycemia, or when patients leave the ICU for surgery or imaging, to name a few possibilities. From 349 episodes, 78 episodes were excluded because there were only 1–2 BG points and were too short for assessment. As a result, there were 136 patients (271 episodes) with 12,153 total hours of data analysed. A total of 67 (49.2%) and 69 (50.8%) were male and female patients. Table 1 shows the median and interquartile range of patient’s age, height, and length of glycemic control (LGC), separated into the 3 years analysed. The number of patients were the lowest in 2019* as data were up only until April. Analysis of Variance (ANOVA) comparison scores on age (P=0.58), weight (P=0.62), LGC (P=0.97), and Acute Physiological and Chronic Health (APACHE) (P=0.87) II score show no significant difference between the three years data.
 |
Table 1 Patient’s Demographic |
STAR Protocol in Malaysia
STAR is implemented in tablets that record all historical data, from all measurements, recommendations, to all chosen treatments performed. It was launched in a newly operated university hospital IIUMMC in mid-January 2017 with three tablets. At IIUMMC, the BG control target range was 6.0–10.0 mmol/L (108–180 mg/dL) instead of a tighter and lower BG target of 4.4–8.0 mmol/L (79–144 mg/dL) used elsewhere.28 It provides 1-hour, 2-hour, or 3-hour treatment option recommendations for both insulin and nutrition delivery, modulating both inputs for control.
The STAR protocol implementation framework in Malaysia includes:
STAR starts when BG measurements were more than 10.0 mmol/L (180 mg/dL) for two consecutive hours.
STAR stops when BG measurements were stable for five to six hours defined as not receiving more than 2 U insulin for three consecutive BG measurement intervals below 10.0 mmol/L.
The default insulin band given in STAR was 0.0–8.0 U/hr with allowable increments of +0.5 U to +2 U. IIUMMC can manually modify the proposed insulin with highest insulin given capped at 10 U/hr. Modifications are recorded in STAR. Nutrition was provided with a non-protein goal of 20–25 kcal/g/day and protein supplied to be at least 1.2–1.5 g/kg/day.52 Differences in nutrition given from the selected recommendation are recorded in STAR by attending clinical staff.
Compliance Assessment
STAR provides up to three different recommendations from which to choose the next interval’s insulin and nutrition input. Any modification made by clinicians were recorded in STAR. Compliance is assessed to identify clinical adherence to the model-based protocol recommendations. In this case, compliance is assessed by the number of time clinician’s follow the dose/amount of the chosen recommendation, quantified:
(1)
Compliance was assessed for each year (2017, 2018, 2019*). ANOVA test was assessed between the compliance and non-compliance interventions in three different years where p-value less than 0.05 suggests the statistical difference. Per-patient compliance is illustrated through a single CDF graph each, to study the level or magnitude of non-compliance and its trends. Compliance needs to be assessed and audited from time to time since compliance may impact GC performances.1,18 Moreover, given STAR is a clinical practice change, shifting from a sliding-scale to a model-based protocol, it is interesting to see whether the level of trust increases over the years. The magnitude and extent of non-compliance can also provide insight into the reasons for specific clinical choices and/or the lack of trust in new protocol.53
Associated Performances and Safety
Performance and safety assess control quality by year and thus if compliance influences patient control performance outcomes. Cumulative distribution frequency plots (CDF) of BG for three years and overall are plotted where glycemic variabilities for per-patient can be referred. Median, interquartile range, and ANOVA test were assessed between the three different years to show the performance and safety results statistical difference. Specific metrics assessed include:
- Performance: Percentage of time in targeted bands (TIB); 4.4–8.0 mmol/L (79–144 mg/dL) and 6.0–10.0 mmol/L (108–180 mg/dL). The first target band was chosen based on default and proposed STAR target band.22–26 The second was the band used in IIUMMC based on the standard Malaysian ICU protocol.52 Clinical trial BG, insulin, and feed were also assessed.
- Safety: Percentage of BG>10.0 mmol/L (180 mg/dL) (hyperglycemia), BG<4.4 mmol/L (79 mg/dL), BG<4.0 mmol/L (72 mg/dL) (mild hypoglycemia), and BG<2.2 mmol/L (39 mg/dL) (severe hypoglycemia).
Results
Table 2 shows compliance assessment results for insulin and nutrition administration. Overall average compliance was 98.8% and 97.7% for insulin and nutrition, respectively. Administered insulin compliance increased by 2.5% from 97.2% in 2017 to 99.7% in 2018 and 2019*. Compliance to nutrition recommendations was relatively constant but fluctuating with 98.6%, 96.7%, and 98.8% for the three years, respectively. Table 2 also shows the clinical trial’s glycemic control and intervention results. The insulin and nutrition administered were similar across the three years. Relative to compliance, total insulin administered was lower than recommended, but far closer in 2019* than in the first year, 2017. Workload, measured as number of BG measurements, averaged 17 per day across all three years, indicating nurses were selecting shorter treatment intervals than offered. The statistical test between compliance and non-compliance for insulin and feed interventions as shown in Table 2 is significantly different where all the p-values were less than 0.05.
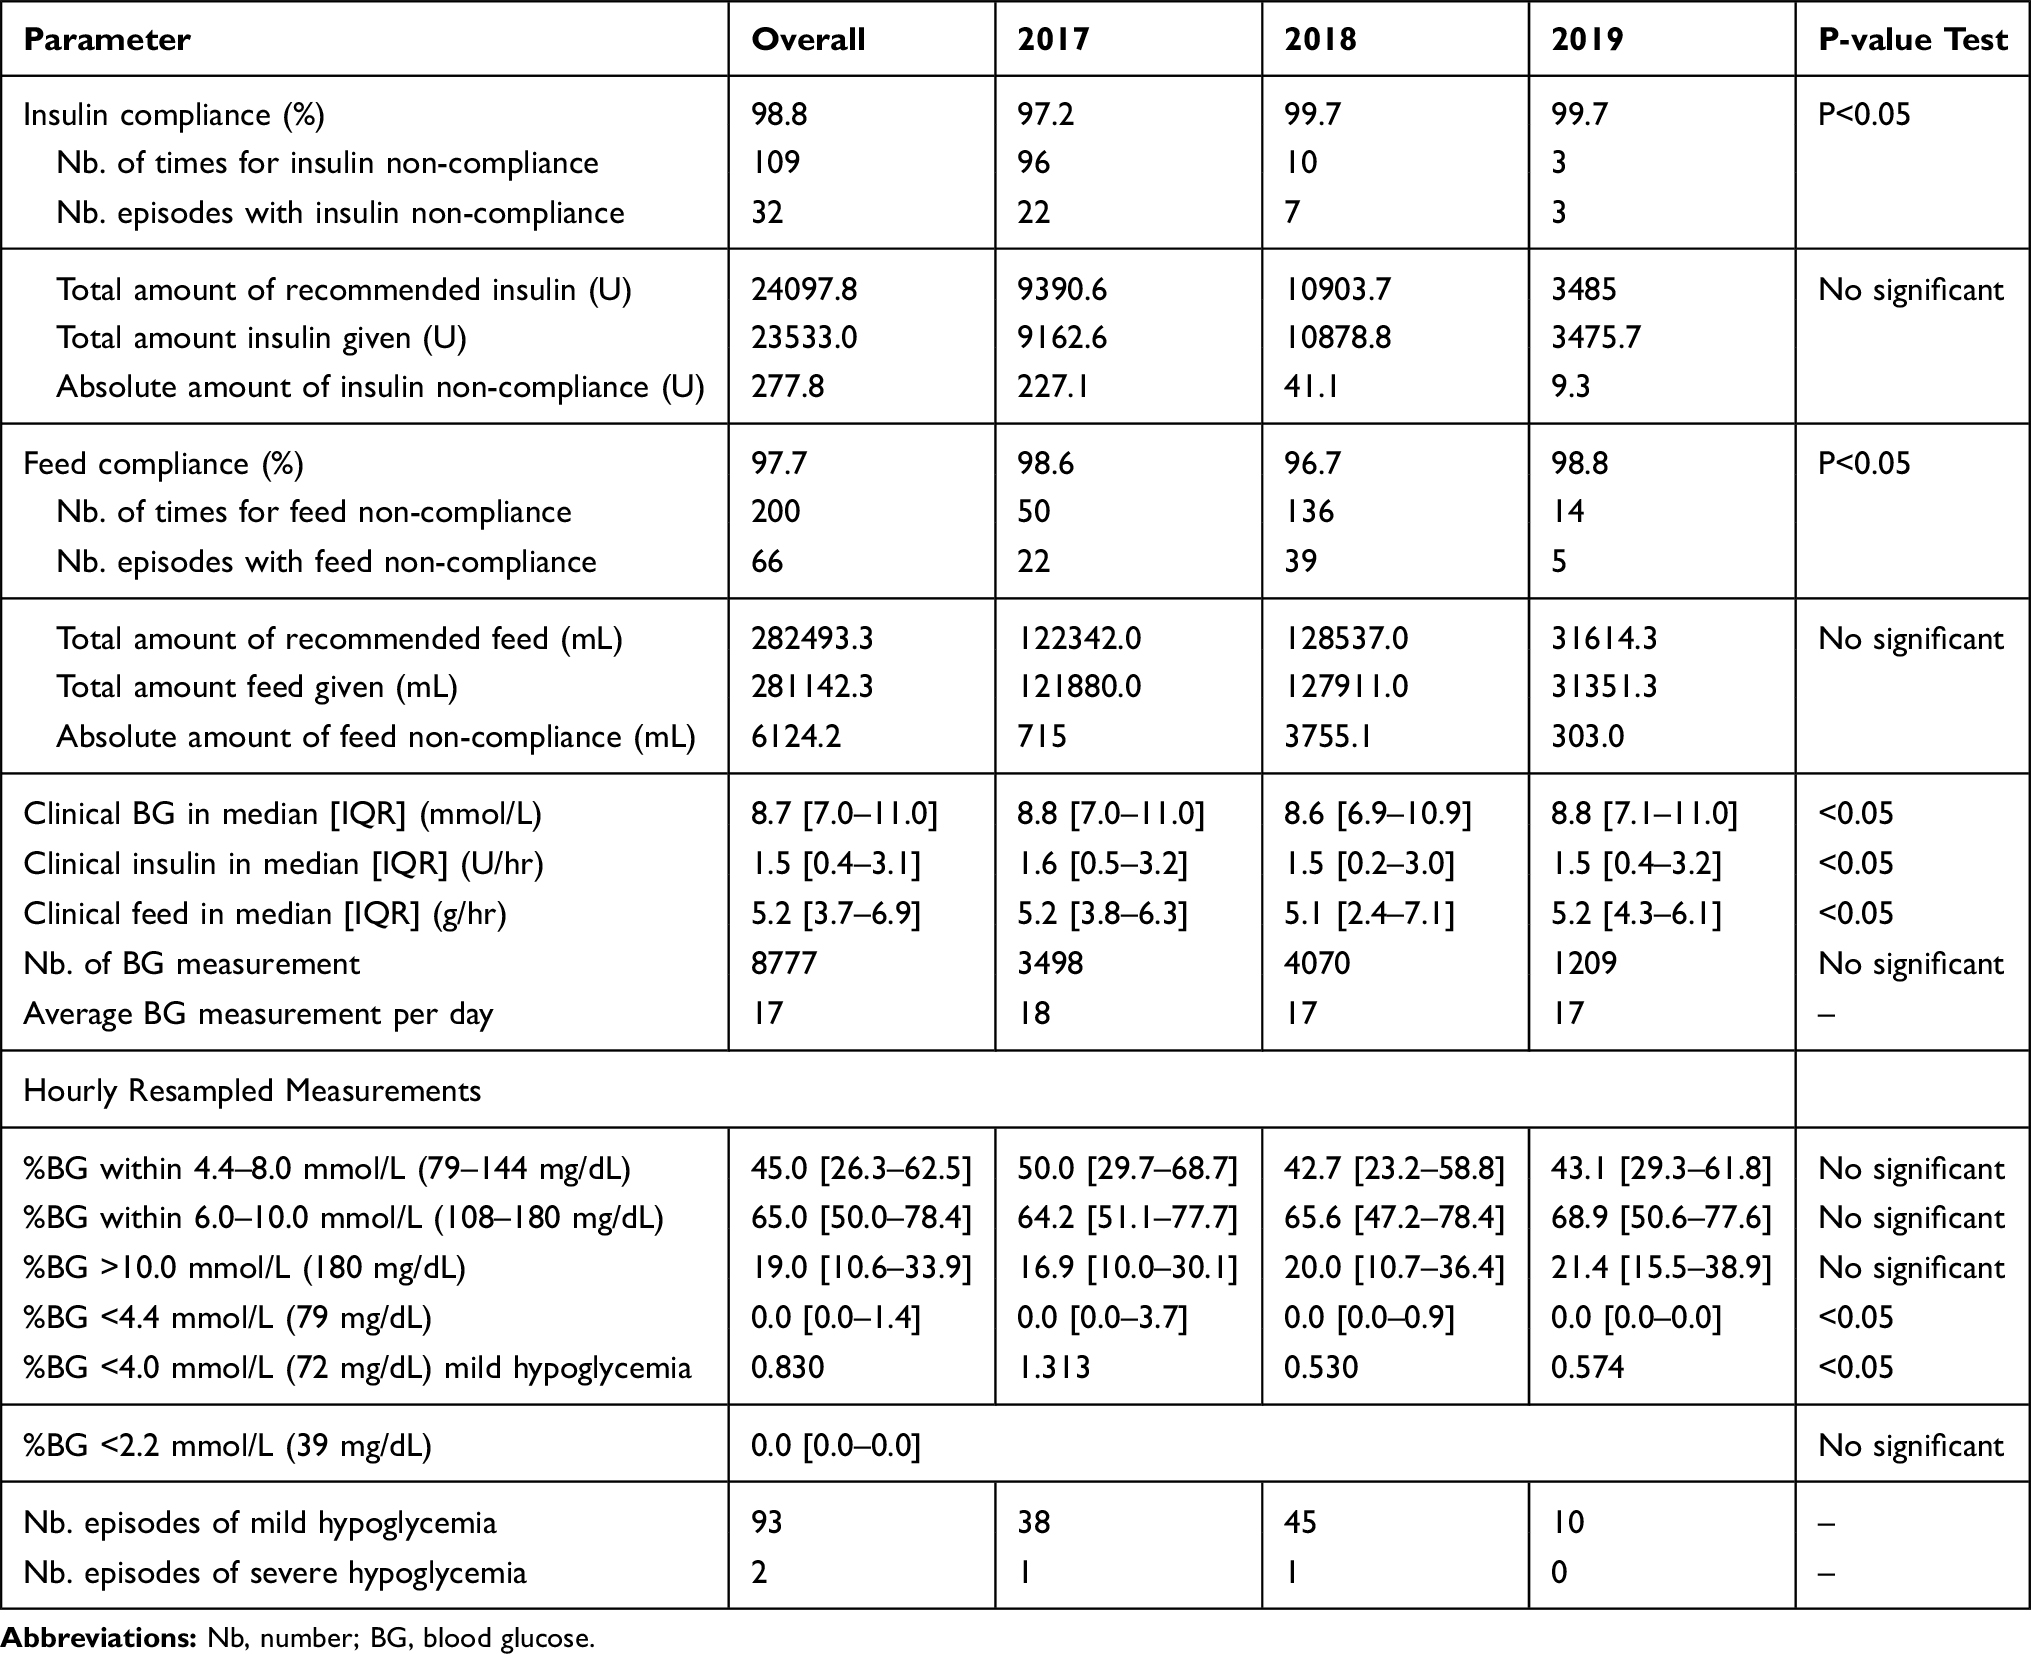 |
Table 2 Results of Compliance and Clinical Trials of IIUMMC Patients |
In terms of the performance and safety, the median BG was a relatively constant 8.8 mmol/L to 8.6 mmol/L to 8.8 mmol/L, in all three years. Per-patient % BG between 4.4–8.0 mmol/L in 2017 and 6.0–10.0 mmol/L in 2019* varied reflecting small shifts in control or patients, but variations were not large, where the p-value test showed in Table 2 are not statistically significant. Mild hypoglycemia fluctuated across years, but the overall hypoglycemia cases is lower than 1% which shows STAR personalized care improved hypo cases over the years. Hyperglycemia rate for %BG > 10.0 mmol/L was relatively constant between 16–20% of measurements, and showed no significant different . Figure 1 shows all per-patient BG CDF plots and the median (dotted line), IQR of 25% to 75% (dark blue range), and 5% to 95% (light blue range) of per-patient responses for each year and overall, where 2017 and 2018 are qualitatively similar and 2019* is narrower. Overall, performance was similar, and hypoglycemia cases decreased over years. Thus, compliance which was relatively high does not appear to affect GC results in this case.
Figure 2 shows example patient episodes for Patient 68 (Compliant patient) and Patient 8 (Non-compliant patient). Patient 68’s compliance for administered insulin and nutrition was 100%, while Patient 8 was 73.6% (insulin) and 98.75% (nutrition), showing potential significant reluctance to use insulin for fear of hypoglycemia. Another example of patient 11 (referring to Figure 2C) shows compliance of insulin and nutrition was 39.2% and 98%. Patient 8 and 11 had lesser GC performance and higher BG values, indicating compliance percentage below 80% for insulin interventions did affect both patients, and those other patients with significant non-compliance were similar. The BG, insulin, and feed interventions between compliant and non-compliant showed in Table 2 are statistically different where the p-value was less than 0.05. However, the clinical difference is not evident in the overall cohort.
 |
Figure 1 BG cumulative distribution frequency (CDF) for (A) Overall (B) 2017 (C) 2018 and (D) 2019*. |
 |
Figure 2 Profile figures of (A) compliant episode (patient 68), and (B) non-compliant episode (Patient 8) under STAR protocol. The first panel represents blood glucose (BG) mmol/L. The cross (x) is the BG clinical reading and the line is fitted BG using integral fitting method. The dashed line represents the BG limit target of 6–10.0 mmol/L (108–180 mg/dL). The second panel shows the plasma insulin (I) mU/L (dashed line) and interstitial insulin (Q) mU/L (straight line). The third panel is patient’s insulin sensitivity and the last panel represents insulin administered and feed given, straight line for insulin (U/hr), dashed line for Enteral feed (g/hr), and dashed dotted line for Parenteral feed (g/hr). |
Figures 3 and 4 show the per-episode non-compliant amount of insulin and nutrition for each year. These figures illustrate the difference between selected recommendation and the real amount given, summed in total. Negative values mean the amount given was more than recommended. 2018 has the highest nutrition non-compliance amount (700.4 mL for Patient 5) and rate of occurrence. For insulin, 2017 is the most non-compliant year by rate of occurrence, and Patient 11 had the distinctive case with a difference of 57.4 U, noting a significant under-dosing compared to recommended values and treatments selected. Notably, insulin non-compliance is all under-dosing (positive values) in Figure 4, where there is some spread in Figure 3 for nutrition administration.
 |
Figure 3 Non-compliance nutrition amount (mL) per episode for each year. It is clear non-compliance occurs primarily in 2017–18 . |
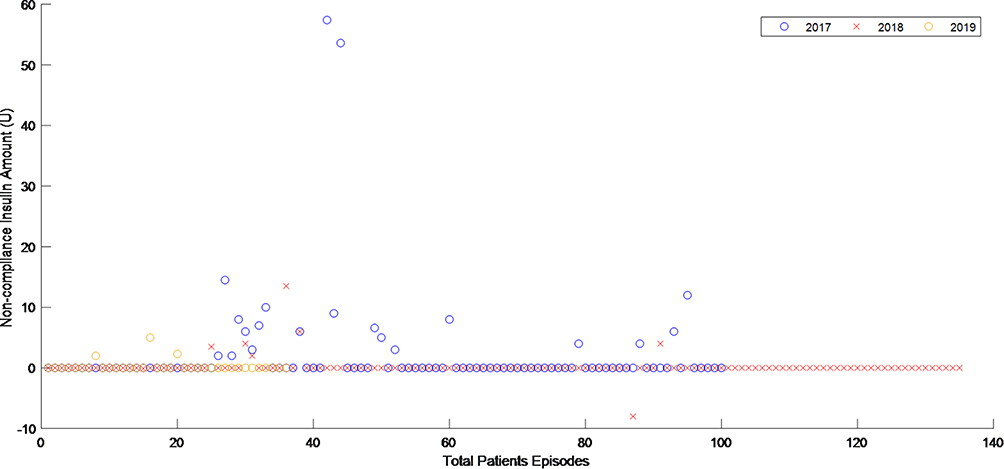 |
Figure 4 Non-compliance in total recommended insulin amount (U) per episode for each year. It is clear non-compliance occurs primarily in 2017 . |
Table 3 summarizes the availability and the number of times 1-hour, 2-hour, or 3-hour interval interventions were chosen, in three contexts, i) only option 1-hour available, ii) only option 1-hour and 2-hours available, and iii) All 3 options available.
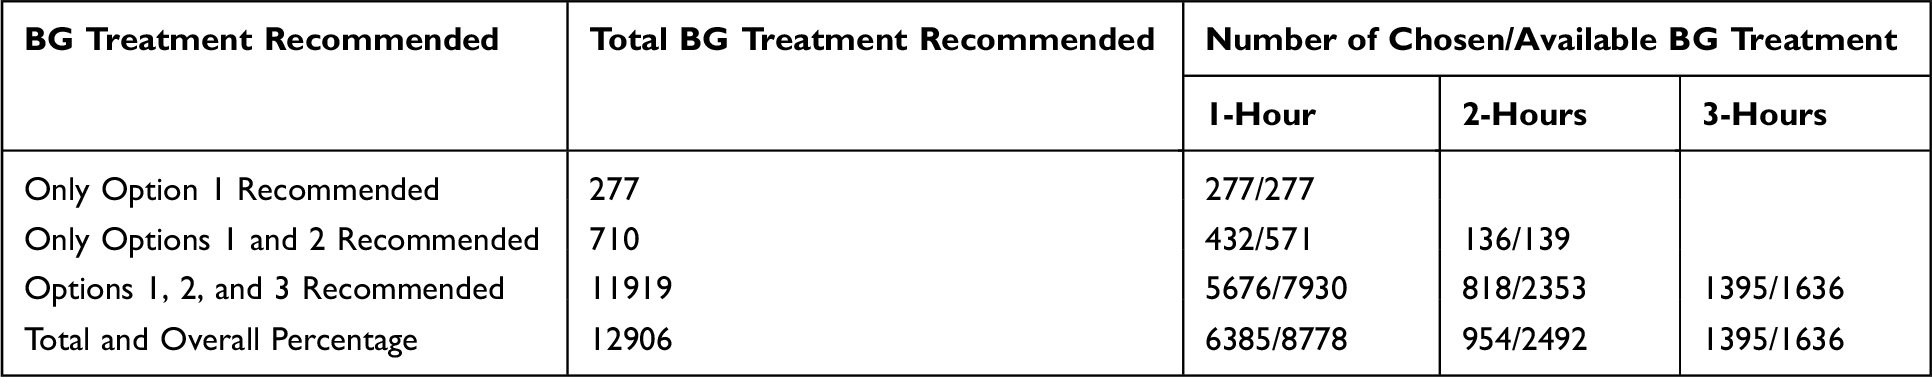 |
Table 3 The Availability and Number of Times 1-, 2-, and 3-Hour Interval Interventions Chosen |
Discussion
Overall, the results show good compliance where clinicians followed STAR recommendations even though it was a major change in practice. The comparison between the compliance and non-compliance interventions for both insulin (P=5.4 x 10⁻¹⁵) and nutrition (P=0) demonstrated statistical difference with p-values less than 0.05. In particular, compliance to dosing recommendations increased over the years. In addition, the level of non-compliance seen in the rate of occurrence per-patient and amount or magnitude of difference fell. Insulin compliance was more notable, and always an under-dosing compared to recommendation, reflecting a well-known fear of hypoglycemia.53–55
In-contrast, non-compliance to nutrition recommendations was slightly more common, and in most cases represented increases to meet a certain standard. There is a need to scrutinize these episodes in particular to consolidate the ICU’s nutrition guidelines and goals more clearly,56 including correlation with glycemic control performance as STAR has been shown to be able to provide world-best nutrition delivery, in practice as well as in (fully compliant) virtual trials.35,36 STAR control provides balance in insulin and nutrition automated clinical care treatment. In this study, the percentage of compliance interventions was high which demonstrated the acceptance of transition in automated technology and personalized treatment.
Workload was higher than other cases internationally with 17 measurements per day versus 12 per day in other centres.37 The issue is that there were far fewer times where longer intervals were offered. They were highly selected when they were offered, as seen in Table 3. The issue is the short length of episodes compared to other centres and high initial BG values meaning there was a lower time in band, as noted in Table 2, and higher proportion of hyperglycemia (Table 2) than other centres.37 These results ensure that there is a greater proportion of 1-hour only options available in control, where longer stay allows patients to be more stably controlled and thus longer options to be chosen. This issue might be better addressed by considering any of a lower target band, as per other centres,37 a more difficult stopping criteria requiring BG under 8.0 mmol/L and low insulin dosing for stopping instead of BG < 10.0 mmol/L as now, and/or earlier commencement where initial high BG values make control workload harder as longer intervals are not available until BG is in the goal band. These considerations require further study and consultation with clinical staff, although clinically validated virtual trials show the potential.34,43,50,57-62
Finally, except for improving compliance, specifically in insulin delivery, there was no clear pattern across the years. This result clearly shows the STAR protocol was taken up and that confidence in its insulin dosing rose over time with nursing and clinical staff. It also demonstrates the consistency in control quality seen in studies across other centres.37 Both outcomes are positive for the protocol in general.
This study has at least 2 limitations. First, important details pertaining to patient demographics and diagnoses, such as morbidities and type of ICU admission are not available for now as we only have these data on the earliest 30 patients thus were not included for this study. As a result, a more in-depth study on possible root causes for non-compliance cannot be made, nor can non-compliance be associated with a particular patient type of diagnosis group. In addition, as noted, results are influenced by the relatively short length of patient episode on GC. Instead of grouping data by years, a study with patients/episodes grouped by length of stay and length of glycemic control in the ICU might be more informative. Equally, a further study considering stopping criteria that administered insulin longer could reduce the effect of having multiple short episodes in lieu of a single longer episode per patient as is more common in other centres.37
Conclusion
The STAR protocol was well accepted at IIUMMC as a new model-based control protocol to replace a fixed insulin therapy approach. Compliance analysis showed high compliance to insulin and nutrition administration recommendations of over ~96%. These values were relatively constant over the three years considered, but increased for insulin showing increasing confidence in the protocol over time, although initial levels were very high. Control safety and performance were similar for all periods and overall were acceptable, showing no noticeable impact of compliance. Performance could be improved with a range of options from different target bands to changed stopping criteria that required more stable control performance before stopping glycemic control. STAR is expected to be used in other ICUs in Malaysia.
Abbreviations
GC, glycemic control; BG, blood glucose; STAR, stochastic targeted; ICU, intensive care unit; SI, insulin sensitivity; Nb, number; IQR, interquartile range; IIUMMC, International Islamic University Malaysia Medical Centre.
Ethics Approval and Consent to Participate
All data used were approved under ethics collaboration with International Islamic University Malaysia (IIUM) Medical Centre. The ethics number is IREC 657. All patient’s data have been de-identified and received consent for this study which is under IIUMMC data provision.
Acknowledgment
Special thanks to IIUMMC for the data provision which was approved by IIUMMC and National Institute Healthy Malaysia under ethics (IREC 657). This research has been funded by Universiti Tenaga Nasional (UNITEN) internal grants (UNIIG and BOLD) and Ministry of Higher Education through Fundamental Research Grant Scheme (FRGS).
Disclosure
The authors report no conflicts of interest in this work.
References
1. Zochios V, Wilkinson J, Perry J. Current state of glycemic control in critically ill subjects in a general intensive care unit. Int J Gen Med. 2012;5:23. doi:10.2147/IJGM.S28570
2. Ali Abdelhamid Y, Kar P, Finnis ME, et al. Stress hyperglycaemia in critically ill patients and the subsequent risk of diabetes: a systematic review and meta-analysis. Crit Care. 2016;20(1):1–9. doi:10.1186/s13054-016-1471-6
3. Silva-Perez LJ, Benitez-Lopez MA, Varon J, Surani S. Management of critically ill patients with diabetes. World J Diabetes. 2017;8(3):89. doi:10.4239/wjd.v8.i3.89
4. Srinivasan V. Stress hyperglycemia in pediatric critical illness: the intensive care unit adds to the stress! J Diabetes Sci Technol. 2012;6(1):37–47. doi:10.1177/193229681200600106
5. Dungan KM, Braithwaite SS, Preiser JC. Stress hyperglycaemia. Lancet. 2009;373(9677):1798–1807. doi:10.1016/S0140-6736(09)60553-5
6. Salinas PD, Mendez CE. Glucose management technologies for the critically Ill. J Diabetes Sci Technol. 2019;193229681882283. doi:10.1177/1932296818822838
7. Suhaimi FM, Jamaludin UK, Razak NNA, et al. Insulin sensitivity and blood glucose level of sepsis patients in the intensive care unit.
8. Van den Berghe G, Mesotten D, Vanhorebeek I. Intensive insulin therapy in the intensive care unit. CMAJ. 2009;180(8):799–800. doi:10.1503/cmaj.090500
9. Van den Berghe G, Wouters P, Weekers F, et al. Intensive insulin therapy in critically ill patients. N Engl J Med. 2001;345(19):1359–1367. doi:10.1056/NEJMoa011300
10. Krinsley JS. Effect of an intensive glucose management protocol on the mortality of critically ill adult patients. Mayo Clin Proc. 2004;79(8):992–1000. doi:10.4065/79.8.992
11. Chase JG, Shaw G, Le CA, et al. Implementation and evaluation of the SPRINT protocol for tight glycaemic control in critically ill patients: a clinical practice change. Crit Care. 2008;12(2):R49. doi:10.1186/cc6868
12. Preiser JC, Chase JG, Hovorka R, et al. Glucose control in the ICU: a continuing story. J Diabetes Sci Technol. 2016;10(6):1372–1381. doi:10.1177/1932296816648713
13. Brunkhorst FM, Engel C, Bloos F, et al. Intensive insulin therapy and pentastarch resuscitation in severe sepsis. N Engl J Med. 2008;358(2):125–139. doi:10.1056/NEJMoa070716
14. Finfer S, Liu B, Chittock DR, et al. Hypoglycemia and risk of death in critically ill patients. N Engl J Med. 2012;367(12):1108–1118. doi:10.1056/NEJMoa1204942
15. Krinsley JS. Glycemic variability: a strong independent predictor of mortality in critically ill patients*. Crit Care Med. 2008;36(11):3008–3013. doi:10.1097/CCM.0b013e31818b38d2
16. Amerling R, Winchester JF, Ronco C. Guidelines have done more harm than good. Blood Purif. 2008;26(1):73–76. doi:10.1159/000110569
17. Chase JG, Benyo B, Desaive T. Glycemic control in the intensive care unit: a control systems perspective. Annu Rev Control. 2019;48:359–368. doi:10.1016/j.arcontrol.2019.03.007
18. Dickson JL, Chase JG. Clinical compliance in personalised model-based medical decision support: do computers and interfaces yield better compliance? IFAC-PapersOnLine. 2019;51(34):341–346. doi:10.1016/j.ifacol.2019.01.021
19. Uyttendaele V, Dickson JL, Shaw GM, Desaive T, Chase JG. Untangling glycaemia and mortality in critical care. Crit Care. 2017;21(1):152. doi:10.1186/s13054-017-1725-y
20. Chase JG, Pretty CG, Pfeifer L, et al. Organ failure and tight glycemic control in the SPRINT study. Crit Care. 2010;14(4):R154. doi:10.1186/cc9224
21. Uyttendaele V, Knopp JL, Shaw GM, Desaive T, Chase JG. Is intensive insulin therapy the scapegoat for or cause of hypoglycaemia and poor outcome? IFAC J Syst Control. 2019;9:100063. doi:10.1016/j.ifacsc.2019.100063
22. Signal M, Le Compte A, Shaw GM, Chase JG. Glycemic levels in critically ill patients: are normoglycemia and low variability associated with improved outcomes? J Diabetes Sci Technol. 2012;6(5):1030–1037. doi:10.1177/193229681200600506
23. Penning S, Pretty C, Preiser J-C, Shaw GM, Desaive T, Chase JG. Glucose control positively influences patient outcome: a retrospective study. J Crit Care. 2015;30(3):455–459. doi:10.1016/j.jcrc.2014.12.013
24. Krinsley JS, Preiser J-C. Time in blood glucose range 70 to 140 mg/dl >80% is strongly associated with increased survival in non-diabetic critically ill adults. Crit Care. 2015;19(1):179. doi:10.1186/s13054-015-0908-7
25. Penning S, Chase JG, Preiser JC, et al. Does the achievement of an intermediate glycemic target reduce organ failure and mortality? A post hoc analysis of the Glucontrol trial. J Crit Care. 2014;29(3):374–379. doi:10.1016/j.jcrc.2014.01.013
26. Lanspa MJ, Krinsley JS, Hersh AM, et al. Percentage of time in range 70 to 139 mg/dL is associated with reduced mortality among critically ill patients receiving IV insulin infusion. Chest. 2019:1–9. doi:10.1016/j.chest.2019.05.016.
27. Penning S, Le Compte AJ, Moorhead KT, et al. First pilot trial of the STAR-Liege protocol for tight glycemic control in critically ill patients. Comput Methods Programs Biomed. 2012;108(2):844–859. doi:10.1016/j.cmpb.2011.07.003
28. Evans A, Le Compte A, Tan C-S, et al. Stochastic targeted (STAR) glycemic control: design, safety, and performance. J Diabetes Sci Technol. 2012;6(1):102–115. doi:10.1177/193229681200600113
29. Abu-samah A, Ahamad NH, Razak NN, et al. Model-based insulin-nutrition administration for glycemic control in Malaysian critical care: first pilot trial. IFMBE Proc. 2017;67:189–196. doi:10.1007/978-981-10-7554-4_33
30. Blaha J, Barteczko-Grajek B, Berezowicz P, et al. Space GlucoseControl system for blood glucose control in intensive care patients - a European multicentre observational study. BMC Anesthesiol. 2016;16(1):8. doi:10.1186/s12871-016-0175-4
31. Uyttendaele V, Knopp JL, Pirotte M, et al. Preliminary results from the STAR-Liège clinical trial: virtual trials, safety, performance, and compliance analysis. IFAC-PapersOnLine. 2018;51(27):355–360. doi:10.1016/j.ifacol.2018.11.614
32. Tanenberg RJ, Hardee S, Rothermel C, Drake AJ. Use of a computer-guided glucose management system to improve glycemic control and address national quality measures: a 7-year, retrospective observational study at a tertiary care teaching Hospital. Endocr Pract. 2016;23(3):331–341. doi:10.4158/ep161402.or
33. Chase JG, Le Compte AJ, Preiser JC, et al. Insulin Sensitivity, Its Variability and Glycemic Outcome: A Model-Based Analysis of the Difficulty in Achieving Tight Glycemic Control in Critical Care. Vol. 18. IFAC; 2011. doi:10.3182/20110828-6-IT-1002.01281
34. Razak NN, Razak AA, Pretty CG, Ahamad NH, Suhaimi FM, Jamaluddin U Virtual trial protocol analysis of nursing workload intensity within ICU.
35. Stewart KW, Chase JG, Pretty CG, Shaw GM. Nutrition delivery, workload and performance in a model-based ICU glycaemic control system. Comput Methods Programs Biomed. 2018;166:9–18. doi:10.1016/j.cmpb.2018.09.005
36. Stewart KW, Chase JG, Pretty CG, Shaw GM. Nutrition delivery of a model-based ICU glycaemic control system. Ann Intensive Care. 2018;8(1):4. doi:10.1186/s13613-017-0351-9
37. Stewart KW, Pretty CG, Tomlinson H, et al. Safety, efficacy and clinical generalization of the STAR protocol: a retrospective analysis. Ann Intensive Care. 2016;6(1):24. doi:10.1186/s13613-016-0125-9
38. Lin J, Razak NN, Pretty CG, et al. A physiological Intensive Control Insulin-Nutrition-Glucose (ICING) model validated in critically ill patients. Comput Methods Programs Biomed. 2011;102(2):192–205. doi:10.1016/j.cmpb.2010.12.008
39. Ward L, Steel J, Le Compte A, et al. Data entry errors and design for model-based tight glycemic control in critical care. J Diabetes Sci Technol. 2012;6(1):135–143. doi:10.1177/193229681200600116
40. Ward L, Steel J, Le Compte A, et al. Interface design and human factors considerations for model-based tight glycemic control in critical care. J Diabetes Sci Technol. 2012;6(1):125–134. doi:10.1177/193229681200600115
41. Lin J, Lee D, Chase JG, et al. Stochastic modelling of insulin sensitivity and adaptive glycemic control for critical care. Comput Methods Programs Biomed. 2008;89(2):141–152. doi:10.1016/j.cmpb.2007.04.006
42. Lin J, Lee D, Chase JG, et al. Stochastic modelling of insulin sensitivity variability in critical care. Biomed Signal Process Control. 2006;1(3):229–242. doi:10.1016/j.bspc.2006.09.003
43. Dickson JL, Stewart KW, Pretty CG, et al. Generalisability of a virtual trials method for glycaemic control in intensive care. IEEE Trans Biomed Eng. 2018;65(7):1543–1553. doi:10.1109/TBME.2017.2686432
44. Le Compte AJ, Lynn AM, Lin J, Pretty CG, Shaw GM, Chase JG. Pilot study of a model-based approach to blood glucose control in very-low-birthweight neonates. BMC Pediatr. 2012;12(1):117. doi:10.1186/1471-2431-12-117
45. Knopp JL, Lynn AM, Shaw GM, Chase JG. Safe and effective glycaemic control in premature infants: observational clinical results from the computerised STAR-GRYPHON protocol. Arch Dis Child Fetal Neonatal Ed. 2019;104(2):F205–F211. doi:10.1136/archdischild-2017-314072
46. Le Compte AJ, Lee DS, Chase JG, Lin J, Lynn A, Shaw GM. Blood glucose prediction using stochastic modeling in neonatal intensive care. IEEE Trans Biomed Eng. 2010;57(3):509–518. doi:10.1109/TBME.2009.2035517
47. Chase JG, Hann CE, Jackson M, et al. Integral-based filtering of continuous glucose sensor measurements for glycaemic control in critical care. Comput Methods Programs Biomed. 2006;82(3):238–247. doi:10.1016/j.cmpb.2006.03.004
48. Zhou T, Dickson JL, Shaw GM, Chase JG. Continuous glucose monitoring measures can be used for glycemic control in the ICU: an in-silico study. J Diabetes Sci Technol. 2018;12(1):7–19. doi:10.1177/1932296817738791
49. Penning S, Le Compte AJ, Massion P, et al. Second pilot trials of the STAR-Liege protocol for tight glycemic control in critically ill patients. Biomed Eng Online. 2012;11(1):58. doi:10.1186/1475-925X-11-58
50. Abu-Samah A, Dickson JL, Abdul Razak NN, et al. Model-based glycemic control in a Malaysian intensive care unit: performance and safety study. Med Devices Evid Res. 2019;12:215–226. doi:10.2147/MDER.S187840
51. Razak AA, Abu-Samah A, Razak NN, et al. Assessment of Malaysian ICU staff perceptions towards STAR glycaemic control protocol.
52. Malaysian Society of Intensive Care. Management Protocols in ICU Malaysia; 2012.
53. Chase JG, Andreassen S, Jensen K, Shaw GM. Impact of human factors on clinical protocol performance: a proposed assessment framework and case examples. J Diabetes Sci Technol. 2008;2(3):409–416. doi:10.1177/193229680800200310
54. Anger KE, Szumita PM. Barriers to glucose control in the intensive care unit. Pharmacotherapy. 2006;26(2):214–228. doi:10.1592/phco.26.2.214
55. Aragon D. Evaluation of nursing work effort and perceptions about blood glucose testing in tight glycemic control. Am J Crit Care. 2006;15(4):370–377. doi:10.4037/ajcc2006.15.4.370
56. Zafirah RC, Ummu KJ, Khalijah K, et al. Study on the blood glucose management with controlled goal feed in Malaysian critically ill patients. IOP Conf Ser Mater Sci Eng. 2019;469:012097. doi:10.1088/1757-899X/469/1/012097
57. Jamaludin UK, Dzaharudin F, Razak NNA. Performance of STAR virtual trials for diabetic and non-diabetic in HTAA intensive care unit.
58. Razak A, Razak NN, Ahamad N, Suhaimi F, Jamaluddin U. Virtual trial and monte-carlo analysis of model-based glycaemic control protocol with reduced nursing effort. J Teknol. 2015;77(7):55–59. doi:10.11113/jt.v77.6248
59. Ahamad N, Razak N, Pretty C, Chase G. Efficacy and safety of SPRINT and STAR protocol on Malaysian critically-ill patients.
60. Abdul Razak NN, Ahamad N, Suhaimi F, Jamaluddin U, Ralib AM. Feasibility of an intensive control insulin nutrition glucose model ‘ICING’ with Malaysian critically-ill patient. Int J Pharm Pharm Sci. 2016;8(2):40. doi:10.22159/ijpps.2016v8s2.15218
61. Chase JG, Desaive T, Bohe J, et al. Improving glycemic control in critically ill patients: personalized care to mimic the endocrine pancreas. Crit Care. 2018;22(1):182. doi:10.1186/s13054-018-2110-1
62. Chase JG, Preiser J-C, Dickson JL, et al. Next-generation, personalised, model-based critical care medicine: a state-of-the art review of in silico virtual patient models, methods, and cohorts, and how to validation them. Biomed Eng Online. 2018;17(1):24. doi:10.1186/s12938-018-0455-y
 © 2020 The Author(s). This work is published and licensed by Dove Medical Press Limited. The
full terms of this license are available at https://www.dovepress.com/terms
and incorporate the Creative Commons Attribution
- Non Commercial (unported, 3.0) License.
By accessing the work you hereby accept the Terms. Non-commercial uses of the work are permitted
without any further permission from Dove Medical Press Limited, provided the work is properly
attributed. For permission for commercial use of this work, please see paragraphs 4.2 and 5 of our Terms.
© 2020 The Author(s). This work is published and licensed by Dove Medical Press Limited. The
full terms of this license are available at https://www.dovepress.com/terms
and incorporate the Creative Commons Attribution
- Non Commercial (unported, 3.0) License.
By accessing the work you hereby accept the Terms. Non-commercial uses of the work are permitted
without any further permission from Dove Medical Press Limited, provided the work is properly
attributed. For permission for commercial use of this work, please see paragraphs 4.2 and 5 of our Terms.