Back to Journals » Clinical Ophthalmology » Volume 14
Assessment of Diabetic Retinopathy Vascular Density Maps
Authors Saif PS ![]() , Salman AERG, Omran NAH, Farweez YAT
, Salman AERG, Omran NAH, Farweez YAT
Received 5 April 2020
Accepted for publication 23 October 2020
Published 17 November 2020 Volume 2020:14 Pages 3941—3953
DOI https://doi.org/10.2147/OPTH.S256963
Checked for plagiarism Yes
Review by Single anonymous peer review
Peer reviewer comments 2
Editor who approved publication: Dr Scott Fraser
Passant Sayed Saif,1 Abd El-Rahman Gaber Salman,2 Norhan Amr Hassan Omran,1 Yousra Ahmed Thabet Farweez2
1Department of Ophthalmology, Misr University for Science and Technology, October, Giza, Egypt; 2Department of Ophthalmology, Faculty of Medicine, Ain Shams University, Cairo, Egypt
Correspondence: Passant Sayed Saif
Misr University for Science and Technology, 5 Sherif Street, Babel Louk Sq., Cairo 11111, Egypt
Tel +20 1024449337
Email [email protected]
Purpose: Optical coherence tomography (OCT) and OCTA were used for qualitative and quantitative assessment of retinal vascular density in superficial capillary plexus, deep capillary plexus, foveal avascular zone, and choroidal vascular density map.
Patients and Methods: This study included 64 eyes. Diabetics and control groups were recruited from an internal medicine clinic at Misr University for Science and Technology Hospital and asked to participate in this study. This study was designed as an observational and cross-sectional study in the period from 8/2018 to 8/2019.
Results: There was a decrease in choroidal vascular density in diabetic patients. There was a decrease in retinal thickness in diabetic patients and there were no significant differences in the retinal thickness between control subjects and patients with non-diabetic retinopathy (NDR).
Conclusion: Our study suggests that OCTA can identify preclinical DR before the manifestation of clinically apparent retinopathy. Our findings also highlight the potential role of OCTA in monitoring and quantifying retinal vascular alterations in diabetics.
Keywords: diabetic retinopathy, optical coherence tomography angiography
Introduction
Diabetic retinopathy (DR) is one of the leading causes of vision loss, either due to macular edema or vitreous hemorrhage.1 The greater the duration of diabetes the greater the chance of developing DR.2 Microvascular changes including capillary remodeling, regression, and decreased density have been proven through histopathological and imaging studies to be the cause of DR changes.3
The non-invasive dye-free Optical Coherence Tomography Angiography (OCTA) facilitates the visualization of both choroidal and retinal vasculature, thus allowing the detection of angiographic features of DR. OCTA can detect areas of non-perfusion in both superficial and deep plexuses; also microaneurysms have been outlined clearly.4 OCTA delineates pathogenic changes in the foveal microvascular networks and quantify superficial retinal capillary plexus precisely.5
OCTA has been used in recent studies in macular vessel density quantification.6 The longer wavelength Swept-source-OCT (SS-OCTA) allows for deeper and more clear penetration up to sclero-choroidal interface. It also has a fast scanning speed7 that was used in qualitative and quantitative assessment of retinal and choroidal vascular density in diabetic patients in this study.
Patients and Methods
This study included 64 eyes. Diabetics and control groups were recruited from an internal medicine clinic at Misr University for Science and Technology Hospital and asked to participate in this study.
This study was designed as an observational and cross-sectional study during the period from 8/2018 to 8/2019.
The study was approved by the Faculty of Medicine Ain Shams University IRB and the ophthalmology department council Ain Shams University and was performed in accordance with the ethical standards as laid down in the 1964 Declaration of Helsinki and its later amendments or comparable ethical standards.
Inclusion criteria: Both sexes, male and female, ages 30–60 years old. Best-corrected visual acuity (BCVA) greater than 0.5 LogMAR in the study eye at baseline examination to ensure proper execution of examination. Diabetic Patients are defined according to World Health Organization guidelines as fasting plasma glucose ≥ 126 mg/dl or 2-h plasma glucose ≥ 200 mg/dl or being on antidiabetic medication. The controls (group N) had normal glycaemic values.8
Exclusion criteria: IOP more than 21 mmHg. High Myopia. Media opacity in the study eye. Scans with poor image quality met these criteria: (1) poor fixation resulting in a double vessel pattern and motion artifacts, (2) weak local signal or poor clarity, (3) macular edema, and (4) macular segmentation errors.10,11
Study Population: Eyes were divided into four groups. Group 1 consisted of 16 eyes of normal healthy individuals (control group); Group 2 consisted of 16 eyes with a clinical diagnosis of non-diabetic retinopathy; Group 3 consisted of 16 eyes with the clinical diagnosis of non-proliferative diabetic retinopathy; and Group 4 consisted of 16 eyes with the clinical diagnosis of proliferative diabetic retinopathy.
Study design: All subjects participating in the study were asked to sign a consent before inclusion. They were then subjected to full medical and family histories. Careful ocular examination was performed on the day of OCT assessment.
The ocular examination included: a. Uncorrected visual acuity (UCVA) and BCVA using a Snellen chart and converted to LogMAR: the patient was 6 m away from the chart; one eye at a time was tested with the fellow eye occluded. b. Intraocular pressure by Goldman applanation tonometer. c. Anterior and posterior segment examination by a slit-lamp biomicroscopy. d. Dilated fundus examination with both slit-lamp biomicroscopy with a 90D lens and indirect ophthalmoscopy.
Prepare the patient: Confirm adequate dilation. Inform patients of procedures, pharmacological agents to be administered, and potential side effects. Position patient for photography.
OCT: Swept-source (SS)-OCT and OCTA image acquisition. During the same visit, all study subjects underwent SS-OCT examination (DRI Triton, Topcon, Tokyo, Japan), which contains a 1050-nm-wavelength swept light source and has a scanning speed of 100,000 A-scans/second.9
OCT was done to acquire: a. Retinal thickness at the fovea and parafoveal area using a six-line radial pattern scan (1024 A-scans) centered on the fovea from each eye. b. Choroidal thickness measured (nasal, temporal, superior and inferior) at 2 mm from the fovea.
We obtained a six-line radial pattern scan (1024 A-scans) centered on the fovea from each eye. The definition of choroidal thickness is the vertical distance between the posterior edge of the hyper-reflective retinal pigment epithelium and the choroid/sclera junction. The choroidal thickness was manually measured using a built-in caliper in the OCT software.
OCTA was done to study quantitatively and qualitatively: Using quantitative measuring of the Foveal Avascular Zone (FAZ) area at the superficial capillary plexus (SCP), using the 3x3 mm scan, the FAZ area and perimeter were outlined manually along the innermost capillaries on OCTA images at the SCP. SCP and deep capillary plexus (DCP) (qualitative analysis) at the parafoveal area in the 4.5x4.5 mm scan. Quantitative measuring of the retinal vessel density map at the SCP in the 4.5x4.5 mm scan was measured automatically by the device. Measuring the choroidal vessel density map in the 4.5x4.5 mm scan was measured manually by the operator by applying a superior line at the level of Bruch’s membrane and an inferior line at the sclera-choroidal interface (SCI).
The OCT device automatically segments the layers using a built-in segmentation algorithm for the superficial plexus 2.6 μm below the internal limiting membrane to 15.6 μm below the junction between the inner plexiform and inner nuclear layers (IPL/INL) and deep plexus 15.6 μm below the IPL/INL to 70.2 μm below the IPL/INL. Enface projections of volumetric scans allow for the visualization of structural and vascular details within segmented retinal layer boundaries. Only OCT images with a signal strength index >60 were used and scans with poor image quality were excluded.
Statistical Analysis
Data Management and Analysis: The collected data were revised, coded, tabulated and introduced to a PC using a statistical package for social sciences (IBM SPSS 20.0). Data were presented and suitable analysis was done according to the type of data obtained for each parameter.
I. Descriptive Statistics: 1. Mean, Standard deviation (+ SD) and range for parametric numerical data, while Median and Interquartile range (IQR) for non-parametric data. 2. Frequency and percentage of non-numerical data.
II. Analytical Statistics: 1. ANOVA was used to assess the statistical significance of the difference of a parametric variable between means of more than two study groups. Post hoc test was performed to assess statistical significance within groups 2. Chi-square test was used to examine the relationship between two qualitative variables but when the expected count was less than 5 in more than 20% of the cells, Fisher’s exact test was used.
P-value: Level of significance: P>0.05: Non-significant (NS). P<0.05: Significant (S). P<0.01: Highly significant (HS)
Results
This study included four groups. Group 1 was the control group of normal individuals; Group 2 was diabetic patients with no evidence of diabetic retinopathy changes; Group 3 was diabetic patients with non-proliferative diabetic retinopathy; and Group 4 was diabetic patients with proliferative diabetic retinopathy. There were 45.3% female versus 54.7% male, ranging in age between 35 and 51 years, included in this study.
The mean values Age in control group was 38.31 ± 8.93 SD, while the mean values were higher in the No Diabetic Retinopathy group, the Non-Proliferative DR group, and the Proliferative DR group (42.19±14.01, 49.3±8.5 and 50.75±7.37) respectively. These differences were statistically highly significant as shown in Table 1
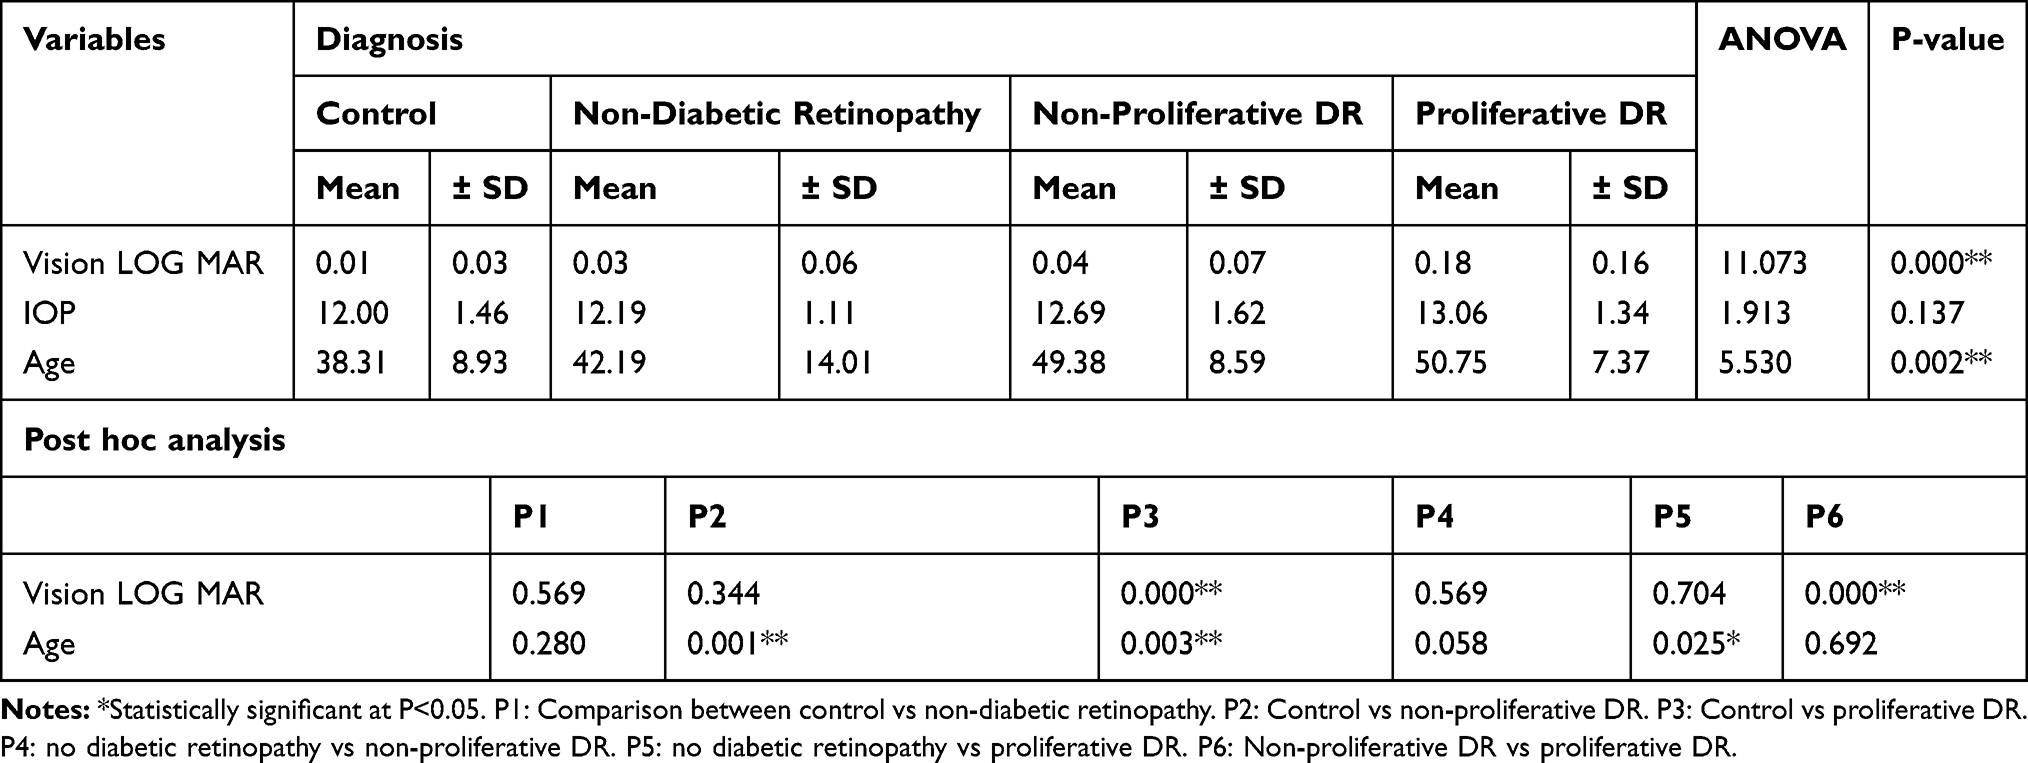 |
Table 1 Demographic Data and Examination Analysis of Patients |
OCT showed no significant changes in retinal parafoveal thickness but a highly significant decrease in retinal foveal thickness (Figure 1). There was a highly significant decrease in choroidal thickness (Figure 2) as well in superior, inferior and nasal quadrants, and to a lesser extent, a significant decrease in temporal choroidal thickness as shown in Table 2.
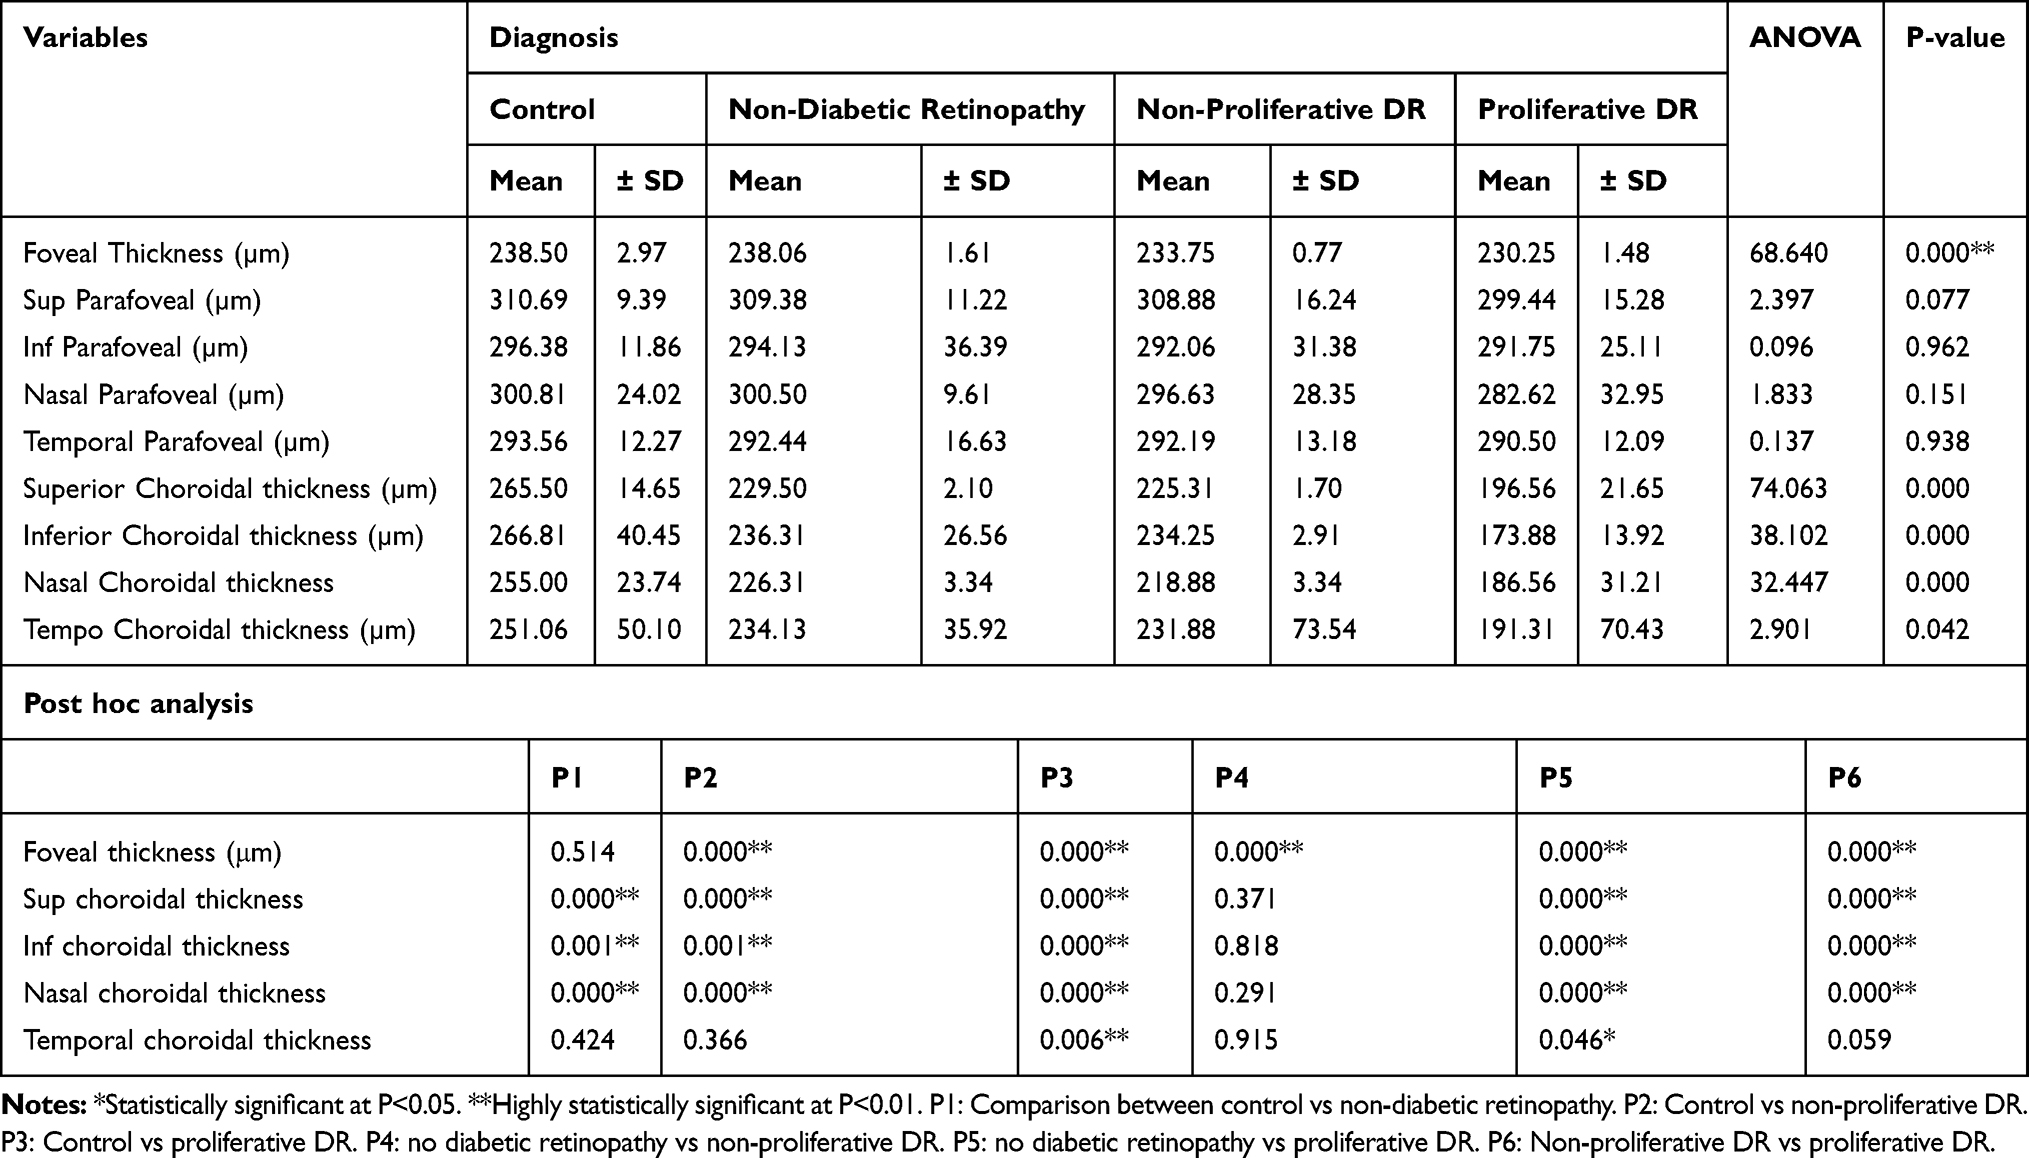 |
Table 2 Comparison of Foveal Thickness Between Study Groups |
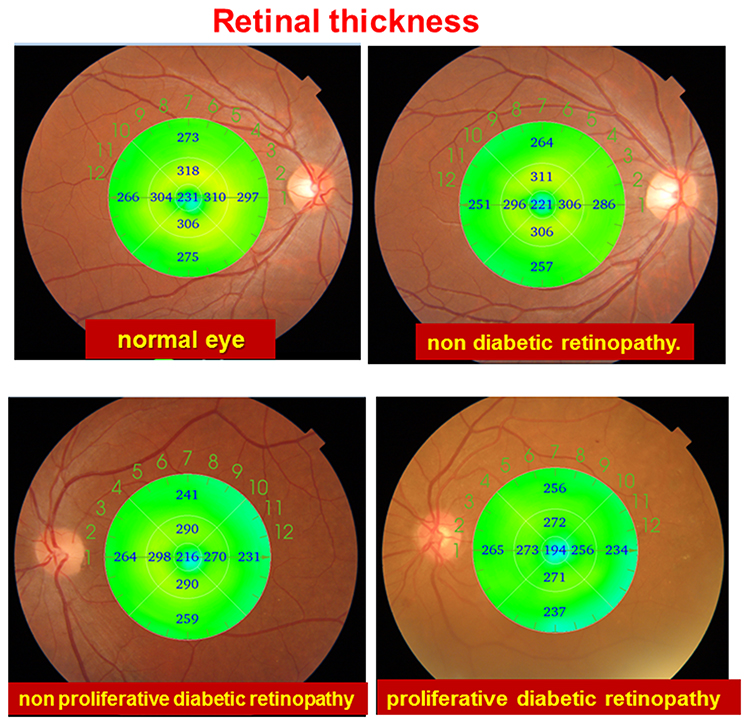 |
Figure 1 Sample of retinal thickness in different study groups. |
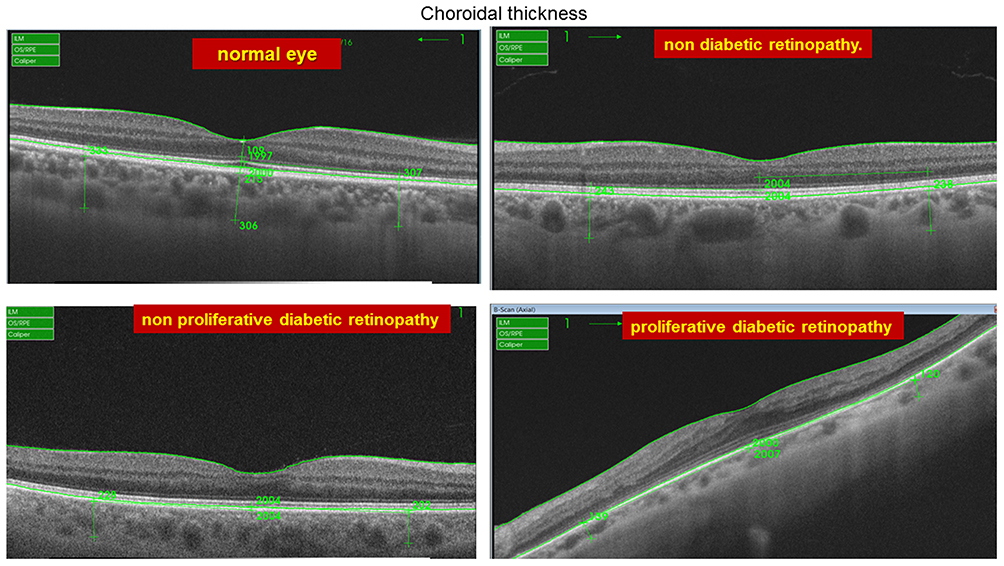 |
Figure 2 Sample of choroidal thickness in different study groups. |
On measuring the FAZ area, both the proliferative and the non-proliferative DR groups showed a highly significant increase in its size while the non-diabetic retinopathy evident group showed no significant change in area size as compared to the control group as shown in Table 3 and Figure 3.
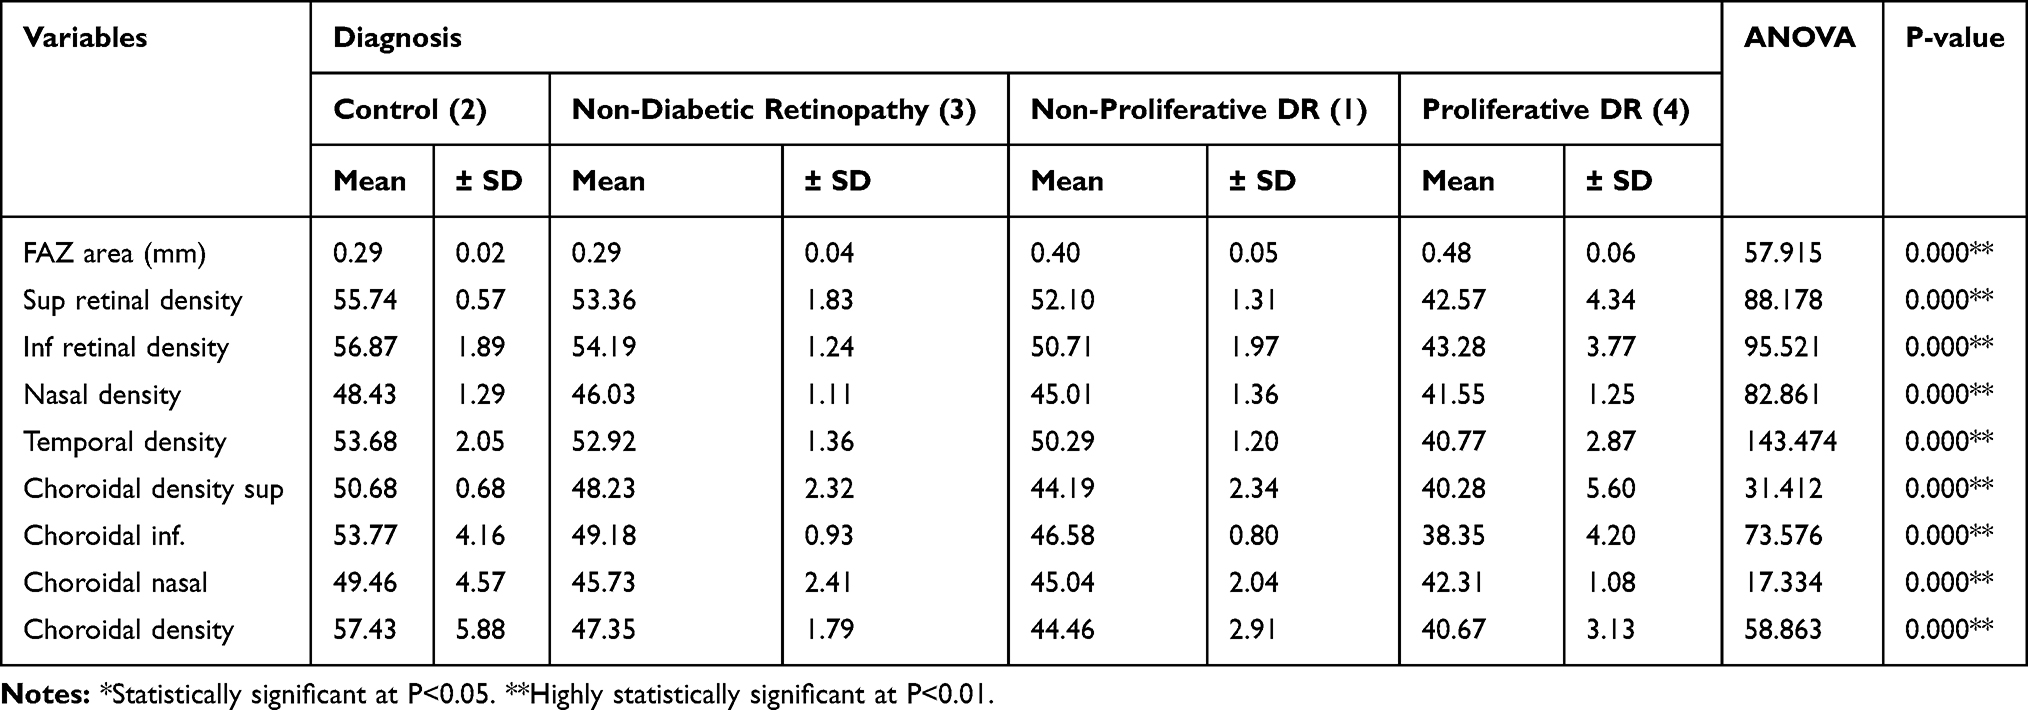 |
Table 3 Comparison of FAZ Area, Retinal and Choroidal Vascular Density in Studied Groups |
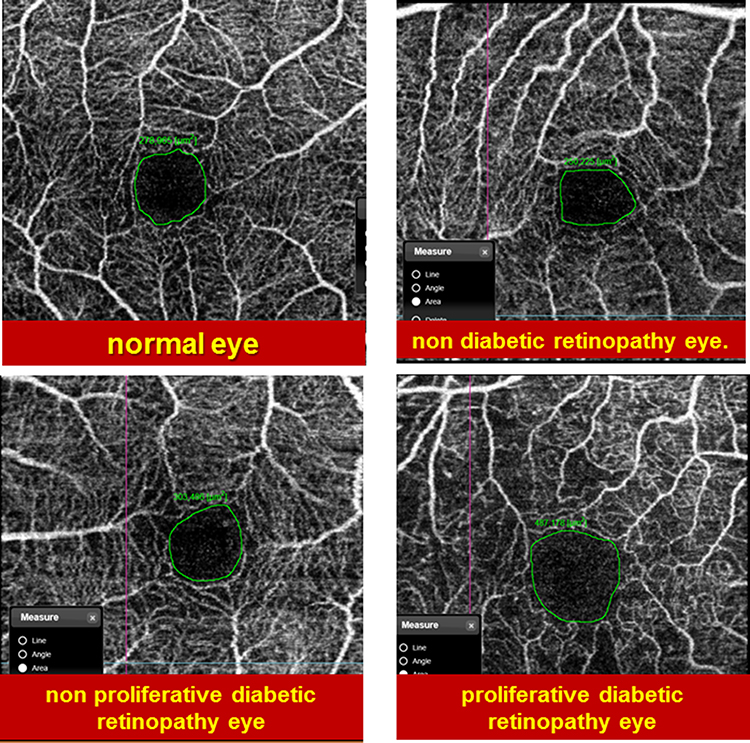 |
Figure 3 Sample of FAZ area in different study groups. |
Both the superficial (Figure 4) and choroidal (Figures 5 and 6) vessel density maps showed a highly significant decrease in vessel density in all groups compared to the control group as shown in Table 3 (Figure 7).
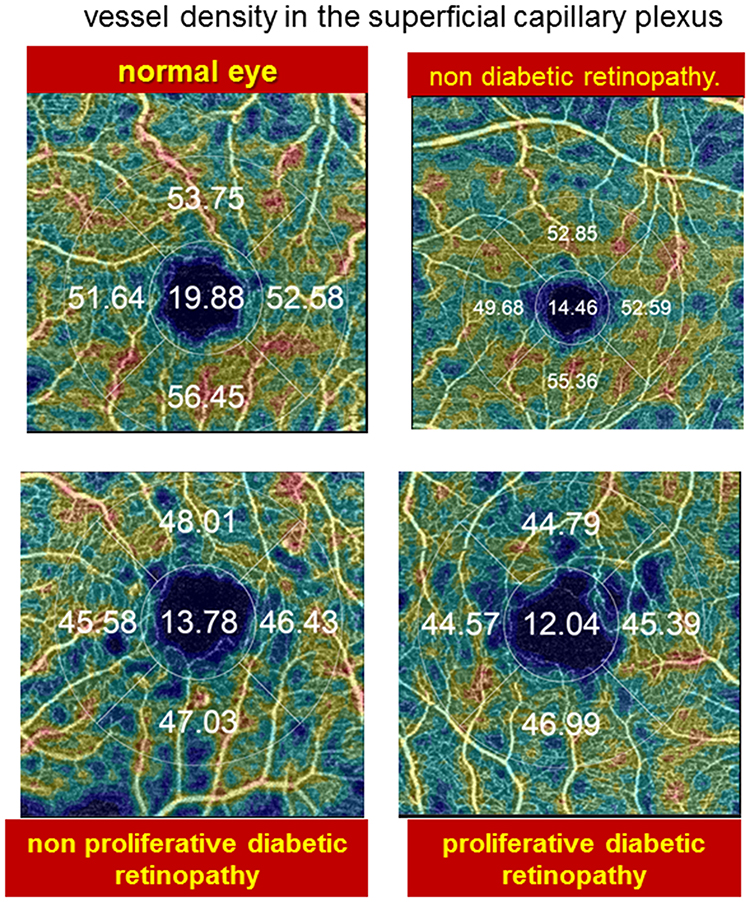 |
Figure 4 Vessel density map in the Superficial Capillary plexus of different groups. |
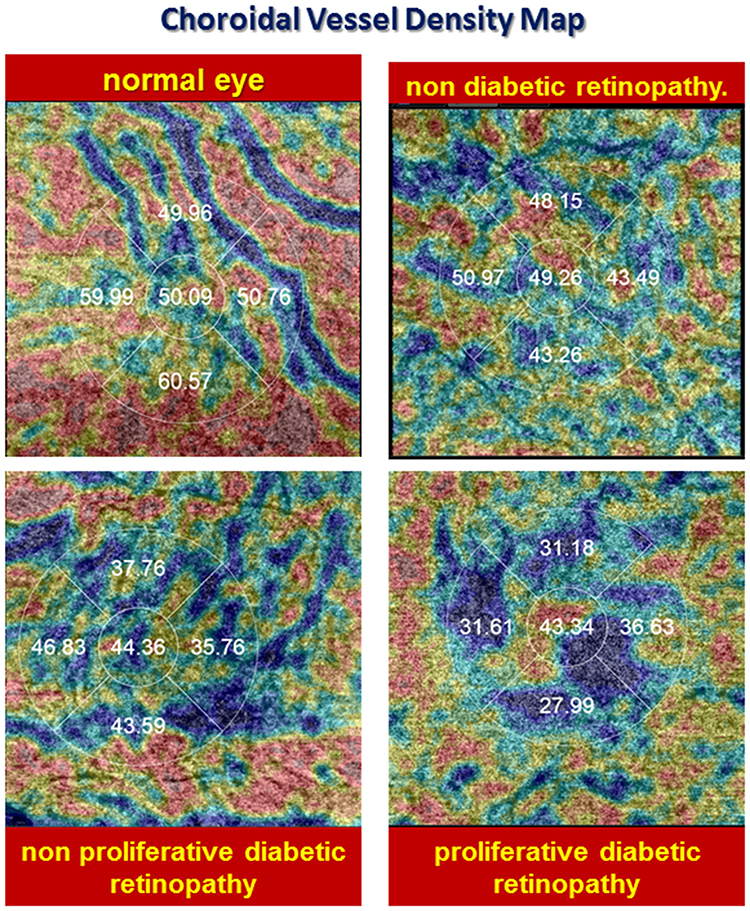 |
Figure 5 Choroidal density map in the Superficial Capillary plexus of different groups. |
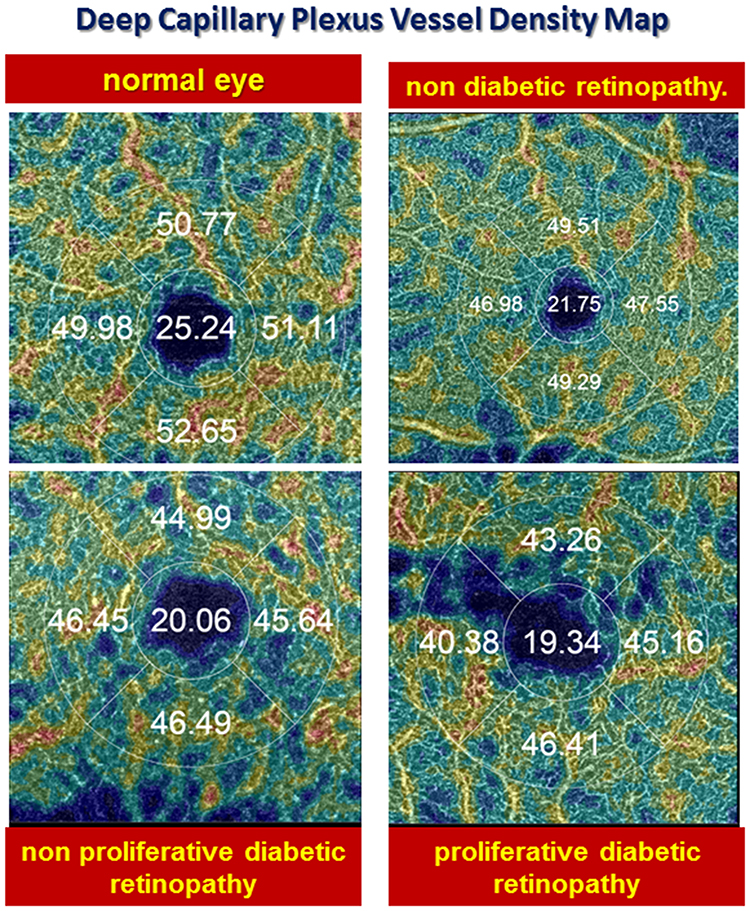 |
Figure 6 Deep Capillary plexus vessel density map. |
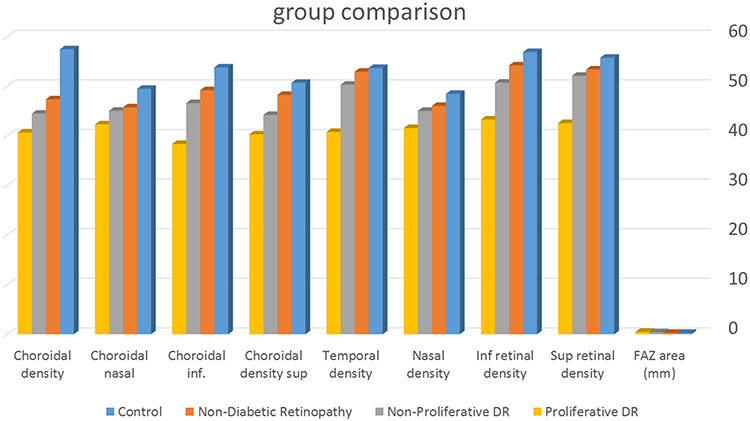 |
Figure 7 Graph comparing the 4 groups as regards the vascular density and choroidal density. |
On comparing the control group to the no evidence of DR group (P1), the superficial vessel density maps showed a highly significant decrease in vessel density in superior, inferior and nasal vessel density maps but no statistically significant decrease in the temporal quadrant. However, there was a highly statistically significant decrease in all quadrants when the control group was compared to the non-proliferative and proliferative groups (P2 and P3) respectively, as shown in Table 4.
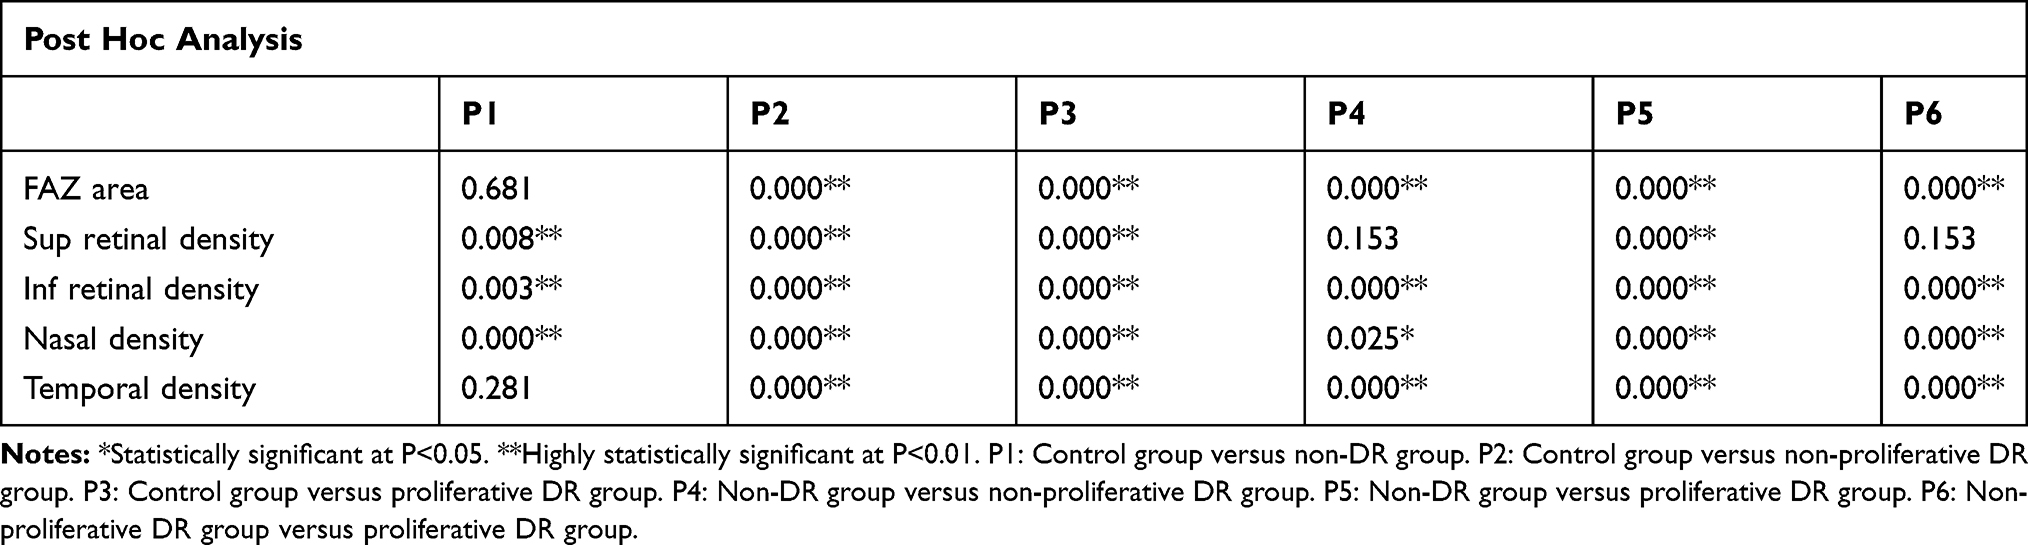 |
Table 4 Post Hoc Test Displaying Multiple Comparisons Within Groups Regarding the FAZ Area, Superior Retinal Density, Inferior Retinal Density, Nasal Density and Temporal Density |
There was a highly significant decrease in superficial vessel density in the inferior and temporal quadrants when comparing the non-DR group to the non-proliferative DR group. This comparison also showed a significant decrease in the nasal quadrant but no significant decrease in the superior quadrant (P4).
Table 4 also demonstrated the highly significant decrease in the superficial vessel density map comparing the non-DR group to the proliferative DR group in all quadrants. However, comparing the non-proliferative DR group to the proliferative DR group (P6), there was no statistically significant decrease in superficial vessel density in the superior quadrant only but a highly significant decrease in the rest of the quadrants.
On comparing the control group to the no evidence of DR group (P1), the choroidal vessel density maps showed a high statistically significant decrease in choroidal vessel density in the inferior, nasal, and temporal vessel density map and an only statistically significant decrease in the superior quadrant. However, there was a highly statistically significant decrease in all quadrants when the control group was compared to the non-proliferative and proliferative groups (P2 and P3) respectively, as shown in Table 5.
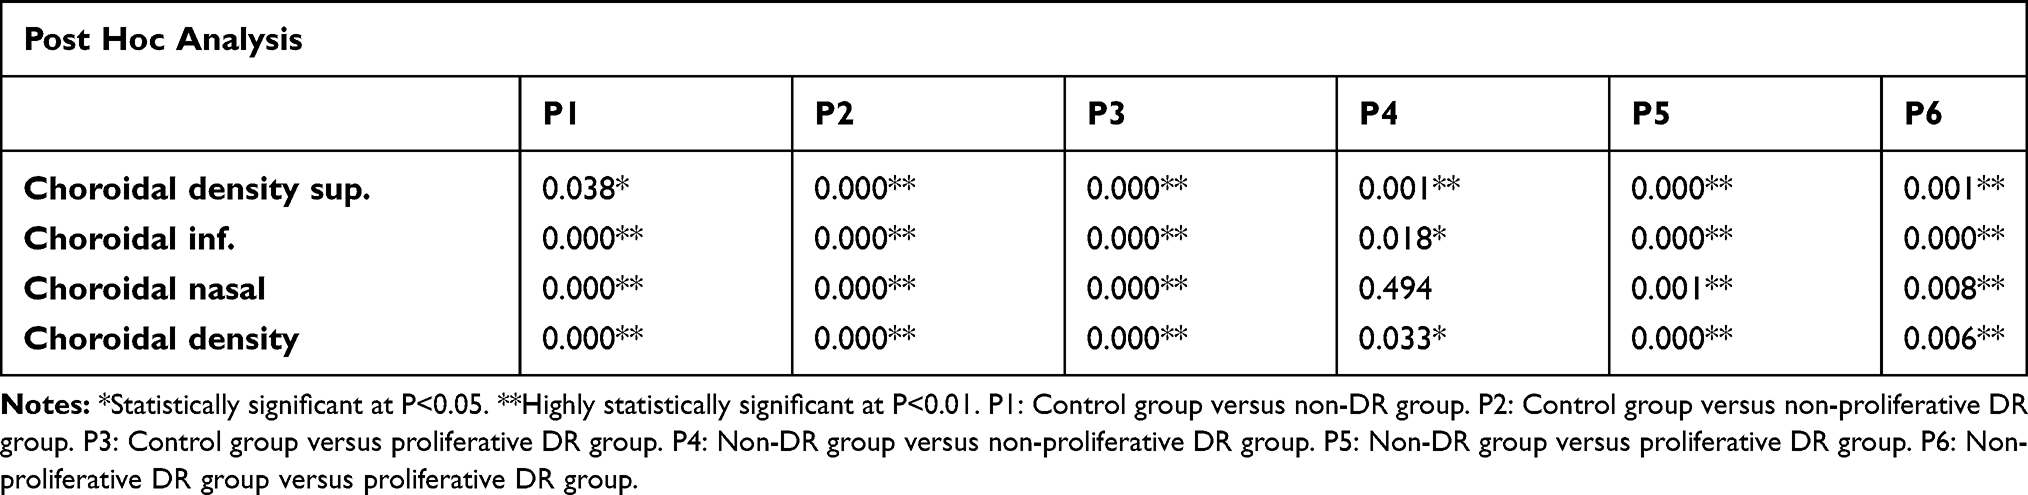 |
Table 5 Post Hoc Test Displaying Multiple Comparisons Within Groups Regarding Choroidal Density Sup., Choroidal Inf., Choroidal Nasal and Choroidal Density |
There was a statistically significant decrease in superficial vessel density in the inferior and temporal quadrants on comparing the non-DR group to the non-proliferative DR group. This comparison also showed no statistically significant decrease in the nasal quadrant but a highly significant decrease in the superior quadrant (P4).
Table 5 also demonstrates the high significance decrease in the choroidal vessel density map comparing the non-DR group to the proliferative DR group in all quadrants (P5), as well as on comparing the non-proliferative DR group to the proliferative DR group (P6).
Fisher’s exact test was used as a part of qualitative assessment of the capillary drop out, which was present even in Group 1 which has no evident DR changes in 5 patients amounting to 31.3%, increased to 37.5% in the non-proliferative group and highest 43.8% in the proliferative group as shown in Table 6.
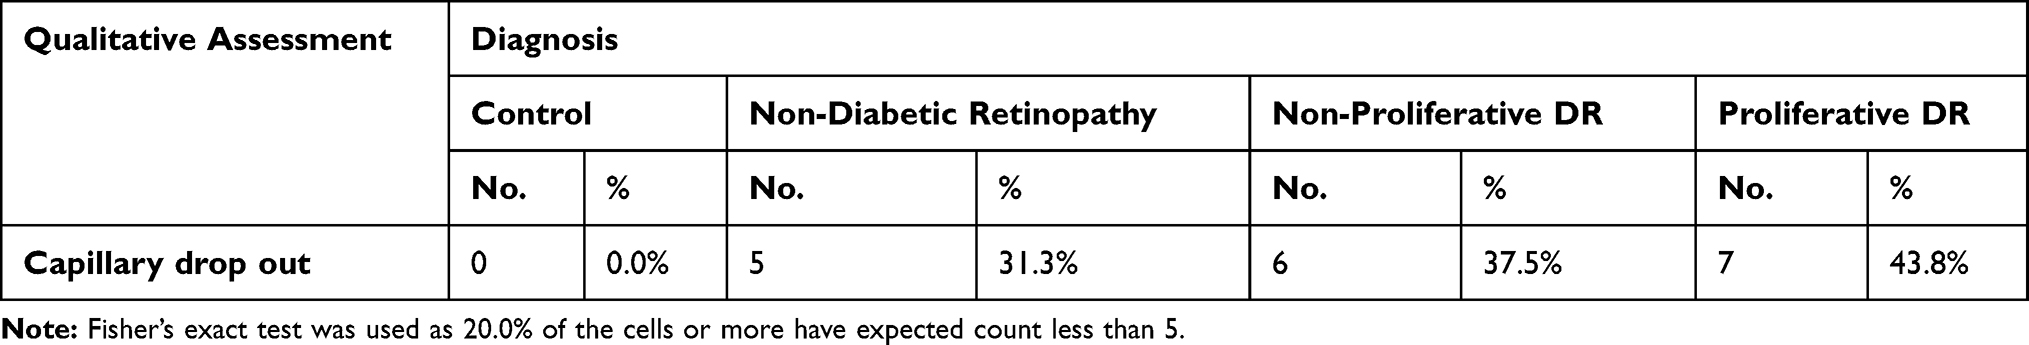 |
Table 6 Qualitative Assessment of Capillary Drop Out in Studied Groups |
There was no statistically significant correlation between choroidal thickness and choroidal vessel density as shown in Table 7
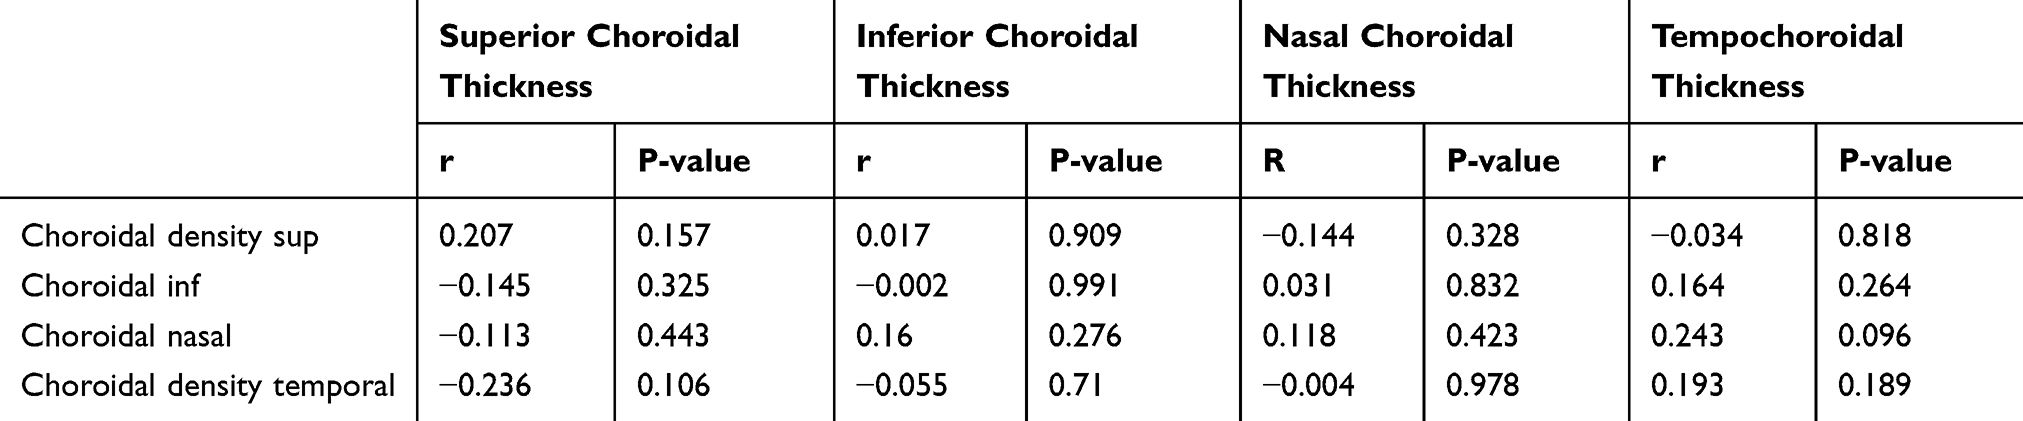 |
Table 7 Correlation Between Choroidal Thickness (Superior, Inferior, Nasal and Temporal) and Choroidal Density (Superior, Inferior, Nasal and Temporal) |
There was no statistically significant correlation between retinal thickness and superficial retinal vessel density as shown in Table 8.
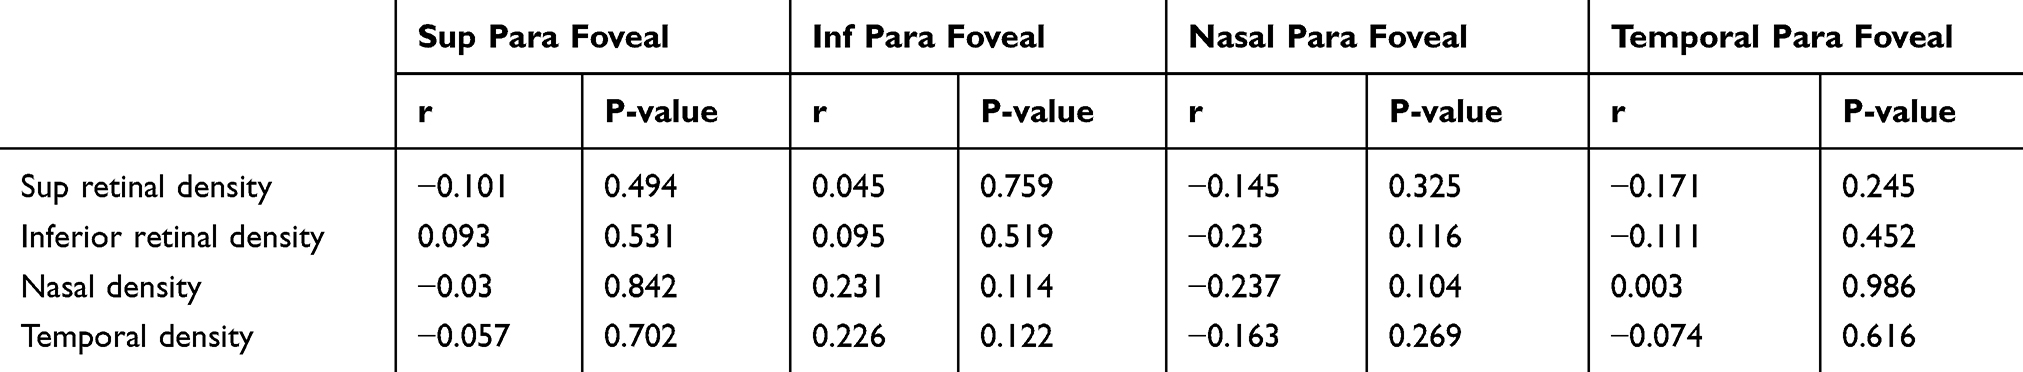 |
Table 8 Correlation Between Retinal Thickness (Superior Parafoveal, in Parafoveal Inferior, Nasal Parafoveal and Temporal Parafoveal) and Retinal Density (Superior, Inferior, Nasal and Temporal) |
Discussion
DR is a progressive microvascular disease. OCTA can advance our understanding of DR by providing high-resolution images of retinal and choroidal microvasculature blood flow and structure.4
Previous studies4,6 have shown that many factors may affect the retina and choroid such as diabetes mellitus (DM), especially in proliferative stage of diabetic retinopathy. There is a metabolic and vascular factor or yet unknown factor that affects the thickness and morphology of the retina and choroid.4,6
Diabetes is a metabolic disease affecting the systemic vasculature. Although the principal changes in diabetic eyes occur in the retinal vasculature, additional changes are also observed in the choroidal layer, an important vascular tissue that supplies blood to the outer retina.12 Histologic studies of diabetic eyes show increased tortuosity, focal vascular dilation or narrowing and the formation of sinus-like structures between the choroidal lobules and also, in some advanced cases, luminal narrowing of the capillaries, capillary dropout, and focal scarring.13 Besides, studies using indocyanine green angiography show filling delay or defects in the choriocapillaris, saccular dilatations, microaneurysms in the choriocapillaris and choroidal neovascularization.14 Information regarding CT was based primarily on histologic examinations which do not necessarily reflect the measurements of this dynamic tissue in vivo.15
In our study, there is a decrease in choroidal thickness in the diabetic patient. In agreement with our study, Querques et al16 identified choroidal thinning despite the disease stage, even in diabetic patients without DR, Sudhalkar et al17 described a progressive thinning of CT with increasing severity of DR, Regatieri et al18 states that it is unclear whether the choroidal thinning is primary or secondary to retinal ischemia. This study suggests that choroidal thinning precedes the onset of retinal pathology and the thinning increases with progressive worsening of the retinopathy.
In contrast to our study Kim et al19 reports an increased CT in patients with increasing severity of DR, and while the exact mechanism they state is unknown, there is conflicting evidence on the change in retinal blood flow and pulsatile ocular blood flow in subjects with diabetes.20
In our study, there is an increase in the FAZ area in diabetic patients. In agreement with de Carlo et al21 who have reported increase FAZ in NDR, Hwang et al6 reported statistically significant enlargement in patients with DR. In contrast to our study, Scarinci et al22 did not find differences between T1DM patients with NDR and normal controls in the FAZ area of both superficial and deep capillary plexus.
In our study, there is a decrease in vessel density at the superficial capillary plexus. In agreement with our study Kim et al23 have detected progressively decreasing capillary density, branching complexity, and progressively increasing average vascular caliber in eyes with different stages of DR. They have not been able to detect a significant difference in these variables between healthy subjects and patients with mild non-proliferative DR. Significantly reduced density in the superficial vascular plexus in mild non-proliferative DR in comparison to control subjects has also been observed in the study of Agemy et al.24
Also, Dimitrova et al25 had a reduction in parafoveal superficial and deep retinal vessel density in diabetic eyes compared to healthy subjects.
In our study, there is a decrease in choroidal vascular density. In agreement with our study, Nagaoka et al20 demonstrated that there was a decreased choroidal blood flow, even before visible DR was present.24 Also, previous studies report that choroidal circulation, estimated by color Doppler imaging of posterior ciliary arteries, is significantly decreased in patients with background DR.26
Nagaoka et al20 suggest that choroidal hypoperfusion might trigger the development of DR due to retinal tissue hypoxia and overexpression of VEGF. Schocket et al27 report that choroidal volume and choroidal blood flow are significantly reduced in patients with PDR.
In our study, there is a decrease in retinal thickness in diabetic patients and there are no significant differences in the retinal thickness between control subjects and patients with NDR. In agreement with our study, Di et al28 report that there were no significant differences in the retinal thickness between control subjects and patients with NDR, suggesting that retinal vascular alterations precede retinal structural alterations.
The decreased retinal thicknesses in diabetic patients reflecting neurodegenerative changes which include reactive gliosis, diminished retinal neuronal function, and neural-cell apoptosis, have been observed to occur before overt microangiopathy in experimental models of diabetic retinopathy and the retina of diabetic donors.29
Progressive thinning of the inner retina over time (assessed by OCT) occurs in murine experimental models.30 Changes in retinal thickness caused by diabetes are not fully understood. Previous studies have found decreased retinal thickness in diabetes with minimal or no DR compared with retinal thickness in non-diabetic individuals.15,31,32
In contrast, other researchers have observed a tendency towards increased retinal thicknesses in individuals with advanced DR.33
There Were Some Limitations to Our Study
The approximately 16 eyes per diabetic group is a relatively small number.
Because we measured the choroidal thickness using the manual method, the results might contain slight errors. This was the best clinical method currently available with the current OCT equipment. We tried to ameliorate this by taking two choroidal measurements for the same choroidal point.
Choroidal imaging was not performed at a specific time of the day, therefore, we cannot rule out the effect of diurnal variation on the CT as reported previously.34
As is widely known, OCTA has issues regarding various artifacts, and artifacts appear more frequently in eyes with poor vision and retinal diseases.35
In this study, we excluded OCTA images with poor image quality or diabetic macular edema (DME) which might introduce selection bias.36
Conclusion
Our study suggests that OCTA can identify preclinical DR before the manifestation of clinically apparent retinopathy. Our findings also highlight the potential role of OCTA in monitoring and quantifying retinal vascular alterations in diabetes.
Ethics and Consent
Ethical approval was received from the IRB and Ophthalmology council of Faculty of Medicine Ain Shams University. Informed consent was signed by all patients before enrollment in the study.
Funding
No funding or grants were received for this study.
Disclosure
The authors declare that they have no conflicts of interest.
References
1. Liu G, Xu D, Wang F. New insights into diabetic retinopathy by OCT angiography. Diabetes Res Clin Pract. 2018;142:243–253. doi:10.1016/j.diabres.2018.05.043
2. Cho YH, Craig ME, Donaghue KC. Puberty as an accelerator for diabetes complications. Pediatr Diabetes. 2014;15(1):18–26. doi:10.1111/pedi.12112
3. Matsunaga DR, Yi JJ, De Koo LO, Ameri H, Puliafito CA, Kashani AH. Optical coherence tomography angiography of diabetic retinopathy in human subjects. Ophthalmic Surg Lasers Imaging Retina. 2015;46:796–805. doi:10.3928/23258160-20150909-03
4. Bandello F, Corbelli E, Carnevali A, Pierro L, Querques G. Optical coherence tomography angiography of diabetic retinopathy. Dev Ophthalmol. 2016;56:107–112.
5. Falavarjani KG, Sarraf D. Optical coherence tomography angiography of the retina and choroid; current applications and future directions. J Curr Ophthalmol. 2017;29:1. doi:10.1016/j.joco.2017.02.005
6. Hwang TS, Gao SS, Liu L, et al. Automated quantification of capillary nonperfusion using optical coherence tomography angiography in diabetic retinopathy. JAMA Ophthalmol. 2016;134(4):367–373. doi:10.1001/jamaophthalmol.2015.5658
7. Zhang L, Buitendijk GH, Lee K, et al. Validity of automated choroidal segmentation in SS-OCT and SD-OCT. Invest Ophthalmol Vis Sci. 2015;56(5):3202–3211. doi:10.1167/iovs.14-15669
8. Early Treatment Diabetic Retinopathy Study Research Group. Grading diabetic retinopathy from stereoscopic color fundus photographs—an extension of the modified Airlie House classification. ETDRS report number 10. Ophthalmology. 1991;98(5):786–806. doi:10.1016/S0161-6420(13)38012-9
9. Medical TE. Dri OCT triton swept-source optical coherence tomography; 2017. Available from: www.sweptsourceoct.eu.
10. Bandello F, Souied EH, Querques G (eds): OCT Angiography in Retinal and Macular Diseases. Dev Ophthalmol. Basel: Karger. 2016:56:13–17. doi:10.1159/000442771
11. Fenner BJ, Tan GS, Tan AC, Yeo IY, Wong TY, Cheung GC. Identification of imaging features that determine quality and repeatability of retinal capillary plexus density measurements in OCT angiography. Br J Ophthalmol. 2018;102(4):509–514. doi:10.1136/bjophthalmol-2017-310700
12. Nickla DL, Wallman J. The multifunctional choroid. Prog Retin Eye Res. 2010;29:144–168.
13. Shiragami C, Shiraga F, Matsuo T, Tsuchida Y, Ohtsuki H. Risk factors for diabetic Choroidopathy in patients with diabetic retinopathy. Graefes Arch Clin Exp Ophthalmol. 2002;240:436–442. doi:10.1007/s00417-002-0451-5
14. Weinberger D, Kramer M, Priel E, Gaton D, Axer-siegel R, Yassur Y. Indocyanine green angiographic findings in nonproliferative diabetic retinopathy. Am J Ophthalmol. 1998;126:238–247. doi:10.1016/S0002-9394(98)00148-2
15. Chen T, Cense B, Miller JW, et al. Histologic correlation of in vivo optical coherence tomography images of the human retina. Am J Ophthalmol. 2006;141:1165–1168. doi:10.1016/j.ajo.2006.01.086
16. Querques G, Lattanzio R, Querques L, et al. Enhanced depth imaging optical coherence tomography in type 2 diabetes. Invest Ophthalmol Vis Sci. 2012;53:6017–6024. doi:10.1167/iovs.12-9692
17. Sudhalkar A, Chhablani JK, Venkata A, Raman R, Rao PS, Jonnadula GB. Choroidal thickness in diabetic patients of Indian ethnicity. Indian J Ophthalmol. 2015;63(12):912. doi:10.4103/0301-4738.176024
18. Regatieri CV, Branchini L, Carmody J, et al. Choroidal thickness in patients with diabetic retinopathy analyzed by spectral-domain optical coherence tomography. Retina. 2012;32:563–568. doi:10.1097/IAE.0B013E31822F5678
19. Kim JT, Lee DH, Joe SG, et al. Changes in choroidal thickness in relation to the severity of retinopathy and macular edema in type 2 diabetic patients. Invest Ophthalmol Vis Sci. 2013;54:3378–3384. doi:10.1167/iovs.12-11503
20. Nagaoka T, Kitaya N, Sugawara R, et al. Alteration of choroidal circulation in the foveal region in patients with type 2 diabetes. Br J Ophthalmol. 2004;88:1060–1063. doi:10.1136/bjo.2003.035345
21. de Carlo TE, Chin AT, Bonini Filho MA, et al. Detection of microvascular changes in eyes of patients with diabetes but not clinical diabetic retinopathy using optical coherence tomography angiography. Retina. 2015;35:2364–2370. doi:10.1097/IAE.0000000000000882
22. Scarinci F, Picconi F, Giorno P, et al. Deep capillary plexus impairment in patients with type 1 diabetes mellitus with no signs of diabetic retinopathy revealed using optical coherence tomography angiography. Acta Ophthalmol. 2017;96(2):e264–e265. doi:10.1111/aos.13510
23. Kim AY, Chu Z, Shahidzadeh A, Wang RK, Puliafito CA, Kashani AH. Quantifying microvascular density and morphology in diabetic retinopathy using spectral-domain optical coherence tomography angiography. Invest Ophthalmol Vis Sci. 2016;57:362–370. doi:10.1167/iovs.15-18904
24. Agemy SA, Scripsema NK, Shah CM, et al. Retinal vascular perfusion density mapping using optical coherence tomography angiography in normals and diabetic retinopathy patients. Retina. 2015;35:2353–2363. doi:10.1097/IAE.0000000000000862
25. Dimitrova G, Chihara E, Takahashi H, Amano H, Okazaki K. Quantitative retinal optical coherence tomography angiography in patients with diabetes without diabetic retinopathy. Invest Ophthalmol Vis Sci. 2017;58(1):190–196. doi:10.1167/iovs.16-20531
26. Dimitrova G, Kato S, Tamaki Y, et al. Choroidal circulation in diabetic patients. Eye (Lond). 2001;15:602–607. doi:10.1038/eye.2001.193
27. Schocket LS, Brucker AJ, Niknam RM, Grunwald JE, DuPont J, Brucker AJ. Foveolar choroidal hemodynamics in proliferative diabetic retinopathy. Int Ophthalmol. 2004;25:89–94. doi:10.1023/B:INTE.0000031744.93778.60
28. Di G, Weihong Y, Xiao Z, et al. A morphological study of the foveal avascular zone in patients with diabetes mellitus using optical coherence tomography angiography. Graefes Arch Clin Exp Ophthalmol. 2016;254:873–879. doi:10.1007/s00417-015-3143-7
29. Garcia-Ramírez M, Hernández C, Villarroel M, et al. Interphotoreceptor retinoid-binding protein (IRBP) is downregulated at early stages of diabetic retinopathy. Diabetologia. 2009;52:2633–2641. doi:10.1007/s00125-009-1548-8
30. Bogdanov P, Corraliza L, Villena JA, et al. The db/db mouse: a useful model for the study of diabetic retinal neurodegeneration. PLoS One. 2014;9:e97302. doi:10.1371/journal.pone.0097302
31. Demir M, Oba E, Dirim B, Ozdal E, Can E. RETRACTED ARTICLE: central macular thickness in patients with type 2 diabetes mellitus without clinical retinopathy. BMC Ophthalmol. 2013;13(1):11. doi:10.1186/1471-2415-13-11
32. Thompson IA, Durrani AK, Patel S. Optical coherence tomography angiography characteristics in diabetic patients without clinical diabetic retinopathy. Eye. 2019;33:648–652. doi:10.1038/s41433-018-0286-x
33. Pires I, Santos AR, Nunes S, Lobo C. Macular thickness measured by stratus optical coherence tomography in patients with diabetes type 2 and mild nonproliferative retinopathy without clinical evidence of macular edema. Ophthalmologica. 2013;229(4):181–186. doi:10.1159/000350593
34. Tan CS, Chan JC, Cheong KX, Ngo WK, Sadda SR. Comparison of retinal thicknesses measured using swept-source and spectral-domain optical coherence tomography devices. Ophthalmic Surg Lasers Imaging Retina. 2015;46(2):172–179. doi:10.3928/23258160-20150213-23
35. Say EA, Ferenczy S, Magrath GN, Samara WA, Khoo CT, Shields CL. Image quality and artifacts on optical coherence tomography angiography: comparison of pathologic and paired fellow eyes in 65 patients with unilateral choroidal melanoma treated with plaque radiotherapy. Retina. 2017;37(9):1660–1673. doi:10.1097/IAE.0000000000001414
36. Spaide RF, Fujimoto JG, Waheed NK. Image artifacts in optical coherence angiography. Retina. 2015;35(11):2163. doi:10.1097/IAE.0000000000000765
 © 2020 The Author(s). This work is published and licensed by Dove Medical Press Limited. The
full terms of this license are available at https://www.dovepress.com/terms
and incorporate the Creative Commons Attribution
- Non Commercial (unported, 3.0) License.
By accessing the work you hereby accept the Terms. Non-commercial uses of the work are permitted
without any further permission from Dove Medical Press Limited, provided the work is properly
attributed. For permission for commercial use of this work, please see paragraphs 4.2 and 5 of our Terms.
© 2020 The Author(s). This work is published and licensed by Dove Medical Press Limited. The
full terms of this license are available at https://www.dovepress.com/terms
and incorporate the Creative Commons Attribution
- Non Commercial (unported, 3.0) License.
By accessing the work you hereby accept the Terms. Non-commercial uses of the work are permitted
without any further permission from Dove Medical Press Limited, provided the work is properly
attributed. For permission for commercial use of this work, please see paragraphs 4.2 and 5 of our Terms.