
Back to Journals » Risk Management and Healthcare Policy » Volume 18
Assessing the Level and Determinants of Active Aging in China: An LDA-Based Topic Modeling Approach

Received 24 July 2025
Accepted for publication 1 December 2025
Published 10 December 2025 Volume 2025:18 Pages 3819—3841
DOI https://doi.org/10.2147/RMHP.S556017
Checked for plagiarism Yes
Review by Single anonymous peer review
Peer reviewer comments 3
Editor who approved publication: Professor Mecit Can Emre Simsekler
Chunhai Tao,1 Rui Deng1,2
1School of Statistics and Data Science, Jiangxi University of Finance and Economics, Nanchang, Jiangxi, People’s Republic of China; 2Research Institute of High-Speed Railway and Regional Development, East China Jiaotong University, Nanchang, Jiangxi, People’s Republic of China
Correspondence: Rui Deng, School of Statistics and Data Science, Jiangxi University of Finance and Economics, 169 Shuanggangdong Road, Changbei National Economic and Technological Development Zone, Nanchang, Jiangxi, 330013, People’s Republic of China, Email [email protected]
Background: While the concept of active aging has been extensively studied in high-income countries, China faces distinct demographic challenges, including a rapidly growing elderly population, accelerated aging, and aging prior to widespread economic prosperity. These trends highlight the urgent need for a context-specific conceptual and evaluative framework to measure active aging, tailored to China’s socio-cultural and economic realities.
Methods: This study employs the Latent Dirichlet Allocation (LDA) topic model to construct a multidimensional indicator system for measuring active aging among older adults in China. Drawing on five waves of nationally representative panel data from the China Health and Retirement Longitudinal Study (CHARLS), spanning 2011 to 2020, we evaluate individual-level active aging scores using a quantitatively derived framework.
Results: The measurement system consists of six core dimensions and 21 indicators: (1) physical health and functional capacity, (2) psychological well-being and life satisfaction, (3) family caregiving and social security, (4) economic security and intergenerational support, (5) social participation and enabling environments, and (6) lifelong learning and self-management. All scale-based measures demonstrated acceptable internal consistency (Cronbach’s alpha ≥ 0.70). The average active aging score among the full sample was 0.4912± 0.0907.
Conclusion: Active aging levels in China have shown consistent improvements over the observation period, with the most pronounced gains in the eastern region. The central region has seen a narrowing of differences, while the eastern, northeastern, and western parts of the country have seen a widening of differences. Key positive correlates of active aging include educational attainment, urban residence, male gender, alcohol consumption, and being married. Negative associations were found for older age, geographic region, presence of chronic conditions, number of surviving children, and smoking. Among these, education attainment, urban-rural status, age and gender emerged as the most influential factors.
Keywords: active aging, China, LDA, CHARLS, index, influencing factors, regional disparity
Introduction
Global population is aging at an unprecedented rate. It is projected that the number of individuals aged 60 and above will increase from 1 billion in 2020 to 1.4 billion by 2030 and reach 2.1 billion by 2050. Although the phenomenon of population aging initially emerged in high-income countries, its current fastest progression is observed in low and middle-income nations. By 2050, approximately two-thirds of the global elderly population will be concentrated in these regions.1 As of the end of 2023, China’s population aged 60 and above has reached 297 million, accounting for 21.1% of its total population; among them, the number of individuals aged 65 and above has reached 217 million, representing 15.4% of the total.2 This demographic transition The impacts of population aging are profound, extending beyond individual quality of life to encompass national economic development and social stability. Consequently, enhancing the health status of the elderly population and promoting their well-being have become strategic imperatives in addressing the challenges posed by population aging.
The concept of active aging was first introduced by the World Health Organization (WHO) in 2002.3 It refers to the process of optimizing opportunities for health, participation, and security to enhance the quality of life as people age. This concept emphasizes that older individuals can continue to contribute to society according to their needs, expectations, and capabilities through learning, meaningful engagement, and the utilization of their accumulated experience and talents. After the adoption of the Madrid International Plan of Action on Ageing and the Political Declaration during the Second World Assembly on Ageing, active aging was established as a core global policy framework. Among international organizations, the European Union (EU) has taken a leading role in translating the active-aging concept into concrete policy actions, demonstrating the feasibility and socioeconomic benefits of such strategies.4 As a result, active aging has gained widespread recognition in the field of gerontology and has been increasingly incorporated into national population and social policy agendas worldwide.
In China, the “13th Five - Year Plan for the Development of Aging Services and the Elderly Care System”, issued in 2017, formally incorporated the concept of active aging into national policy. It identified active aging as a core metric for evaluating the quality of life of older adults and the effectiveness of elderly care systems.5 In 2021 China’s “14th Five - Year Plan for National Economic and Social Development and Long - Range Objectives for 2035” elevated the aging challenge to the level of national strategy.6 That same year, the State Council issued the “Guidelines on Strengthening Aging Work” in the New Era, which proposed an actionable policy framework and emphasized integrating the principles of active and healthy aging into all aspects of socioeconomic development.7
Given the global trend towards aging-related policymaking, there is growing interest in developing standardized measurement tools and empirical data to support the design, implementation, and cross-national comparison of active aging policies. Scholars around the world have responded by exploring measurement frameworks that reflect local socioeconomic and cultural conditions. Thailand was among the earliest countries to develop a quantitative active aging index aligned with WHO’s conceptual framework. Thanakwang constructed the Active Aging Index (AAI), which included 3 primary goals and 15 indicators tailored to Thai society.8 In 2012, the United Nations Economic Commission for Europe (UNECE) innovatively developed the Active Ageing Index (AAI 2012), which comprises 22 indicators structured around four target dimensions: “Employment”, “Participation in Society”, “Independent, Healthy and Secure Living”, and “Capacity and Enabling Environment for Active Ageing”.9 Designed primarily for European countries, the index’s applicability to other contexts is limited by comparability constraints. The AAI 2012 framework has since been extended to countries such as China,10,11 South Korea,12 Vietnam,13 and India,14 where it now informs aging-related policy development. In addition to international adaptations, scholars from countries including Thailand,15,16 China,17,18 Iran,19 Australia,20 Russia,21 and Finland22 have developed original quantitative tools to assess active aging. These instruments vary widely in scope, encompassing between 3 and 10 primary dimensions and 11 to 177 items. Most rely on subnational survey samples, while others utilize national census data for validation. Despite variations in design, these tools are generally grounded in the WHO’s three-pillar framework—health, participation, and security. However, WHO provides no definitive guidance on specific indicators, leaving researchers to operationalize the pillars according to the demographic and cultural contexts of their respective countries. For example, Thanakwang et al proposed seven primary domains: self-care, social participation, spiritual development, financial security, healthy lifestyle, active learning, and strong family relationships.15 Mohammadi et al adopted a six-dimensional structure comprising institutional participation, psychological well-being, social interaction, productive engagement, social attitudes, and physical function.19 Rantanen et al developed an assessment framework with four dimensions—goals, abilities, opportunities, and activities—without tiered indicators.22 Studies from Vietnam and Thailand included novel indicators such as oral health and nutritional status.12,23 Hijas-Gómez et al from Spain incorporated variables such as sleep quality, housing environment, and institutional support into a 10-dimension tool.24 Most of these instruments have focused on the macro-level, relying on national databases to facilitate international comparisons. Micro-level measurements, especially those targeting individual older adults, are less common and often limited by small sample sizes, restricted geographic scope, and local survey data. Some studies involve fewer than 1000 participants, which hinders broader applicability.
To summarize, first, existing frameworks for measuring active aging largely adhere to the WHO’s three-pillar structure but exhibit heterogeneity in indicator selection. In recent years, new indicators have emerged, such as access to digital technology, housing conditions, life events, volunteerism, health services, lifelong learning habits, outings, and personal grooming, which reflect contemporary aging experiences. Second, most research emphasizes macro-level tools aimed at informing public health policy and interventions for vulnerable populations. While valuable, such approaches offer limited insight into intra-national variation and the relationship between individual characteristics and active aging outcomes. Furthermore, many individual-level tools rely on subnational survey samples and lack cross-regional comparability. Therefore, it is necessary to further develop and refine assessment tools for active aging at the individual level to support and complement macro-level evaluations while also addressing the limitations of existing individual-level measurement instruments. Third, in the Chinese context, current measurement frameworks are largely modeled on the WHO paradigm and are insufficiently grounded in local culture or institutional realities. China faces unique challenges such as aging before affluence, a high prevalence of unhealthy aging, significant regional disparities, and the widespread phenomenon of empty-nest elderly. Over 120 million older adults reside in rural areas, comprising nearly 24% of the rural population. This highlights the urgent need to develop localized tools that reflect China’s sociocultural context and economic development stage. Moreover, active aging research in China remains in its early stages, making it critical to advance a culturally embedded conceptual and theoretical framework.
Based on the above research background and current context, this study aims to construct an operational framework for measuring active aging that is grounded in China’s cultural context. Specifically, the main objectives of this study are as follows:
- To identify the core dimensions of active aging among older adults in China and to establish a multidimensional, individual-level evaluation system;
- To measure the individual-level active aging among Chinese older adults using five waves (2011–2020) of data from the China Health and Retirement Longitudinal Study (CHARLS);
- To examine the effects of individual, family, and environmental factors on the level of active aging;
- To analyze the spatiotemporal evolution of active aging in China and reveal regional disparities and dynamic patterns.
Through this research design, the study aims to fill three major gaps in the existing literature. First, there is a lack of a data driven measurement tool that reflects China’s unique sociocultural characteristics. Second, most existing studies focus on single-dimensional determinants of active aging, lacking integrated empirical analyses that simultaneously consider individual, family, and environmental dimensions. Third, as CHARLS is methodologically aligned with international aging surveys such as HRS, ELSA, and SHARE, our findings not only contribute to the refinement of China’s aging policy but also provide a valuable reference for cross-national comparative research on active aging.
Methods
Study Population and Sample Size
This study utilizes data from the China Health and Retirement Longitudinal Study (CHARLS), a nationally representative, multidisciplinary panel survey jointly conducted by Wuhan University and Peking University. The baseline survey commenced in 2011, adopting a multistage, stratified, probability-proportional-to-size (PPS) sampling method. The sample encompasses 150 counties and 450 urban and rural communities across 28 provinces in China, involving 17,708 individuals from 10,257 households. Follow-up surveys were carried out in 2013, 2015, 2018, and 2020. The most recent publicly available CHARLS data were collected in 2020. Detailed methodological information is accessible in prior publications.25
CHARLS is designed with reference to international standards to ensure comparability with major aging surveys such as the Health and Retirement Study (HRS, United States), the English Longitudinal Study of Ageing (ELSA, United Kingdom), and the Survey of Health, Ageing and Retirement in Europe (SHARE).
For this study, we initially included 19,395 respondents across the five waves from 2011 to 2020. After applying the following exclusion criteria: (1) individuals under the age of 60 (in accordance with both WHO and Chinese government definitions of older adults), (2) missing ADL or IADL data in 2015, (3) missing ADL or IADL data in 2020, and (4) incomplete or missing key variables, the final analytic sample consisted of 10,863 individuals.
Ethical Considerations
CHARLS was approved by the Institutional Review Board of Peking University (approval number: IRB00001052-11015), and all participants provided written informed consent. CHARLS adheres to the ethical principles outlined in the Declaration of Helsinki as well as China’s Personal Information Protection Law. Strict protocols for privacy protection and data anonymization were implemented throughout the data collection and processing phases to ensure the confidentiality and security of participants’ personal information. The present analysis involved only de-identified, publicly available data and did not include any direct interaction with human participants or the collection of new human data. According to the Measures for Ethical Review of Life Science and Medical Research Involving Human Subjects (Article 32, items 1–2, issued February 18, 2023, China), studies using anonymized public datasets are exempt from additional ethical review. Therefore, this study was exempt from review by our institutional ethics committee.
LDA Topic Modeling
In recent years, natural language processing (NLP) techniques have been increasingly adopted to enhance the precision and contextual relevance of indicator construction. Among these techniques, topic modeling—specifically, the Latent Dirichlet Allocation (LDA) model introduced by Blei et al26—has emerged as a widely utilized unsupervised learning method for extracting latent semantic structures from text corpora.27 LDA assumes that documents are composed of multiple latent topics. It represents the thematic composition of documents as probability distributions, facilitating topic clustering. This model effectively enhances the precision of deep-level text content mining and semantic analysis and is extensively applied in economics and finance.28 In the evaluation phase, LDA leverages its programming capabilities to construct lexicons, mine key points of interest, optimize analytical logic, and identify focal areas. These outputs serve as indicator variables within evaluation dimensions, enabling the quantitative measurement of internal effectiveness within the subject of assessment.
To extract relevant themes for evaluating active aging in the Chinese context, we collected textual data from three sources representing different societal perspectives:
- Social media comments reflecting public sentiment;
- Government policy documents reflecting institutional discourse;
- Official news media representing an intermediary narrative space.
For social media, we selected the short-video platform Douyin (TikTok China). We used hashtags such as “#active” and “#elderly” to retrieve 500 videos sorted by relevance. Videos lacking explicit relevance to the active aging concept or those posted by official media or corporate accounts were excluded. From the filtered dataset, we constructed a diverse sample of 20 content creators, ensuring representativeness in terms of gender, age, urban-rural status, thematic focus, follower count, and engagement levels. The sample included 7 rural and 13 urban creators, with 8 males, 9 females, and 3 mixed-gender accounts; their ages ranged from 51 to 97 years. Content types spanned daily life, emotional narratives, fitness and fashion, entertainment, and practical skills. For each creator, we selected their top 15 videos based on engagement and used Python to extract the top 100 first-level comments per video, resulting in a dataset of 30,000 user comments as of February 10, 2025.
For policy documents, we retrieved 37 national-level policies from authoritative platforms such as “Beida Fabao” and government portals using the keyword “aging”, excluding irrelevant or low-salience documents.
For news reports, we accessed the official site of Peoples Daily and searched for the terms “aging”, “elderly”, and “elder care”, collecting the top 10 pages of national-level articles (excluding local news), yielding a total of 93 relevant reports.
The LDA model was applied to the combined corpus consisting of 30,000 social media comments, 37 policy texts, and 93 news articles. The modeling process entailed text preprocessing, topic similarity estimation, and topic-word distribution analysis. The LDA implementation was carried out using Python 3.10. The preprocessing stage involved tokenization using Jieba (a Chinese word segmentation tool), removal of stop words, and frequency statistics. The resulting word cloud visualization depicted prominent terms.
Measures
The CHARLS dataset offers high quality micro-level data that are representative of individuals aged 45 and above in China. This enables interdisciplinary research on population aging and evidence based policy development. The survey encompasses a wide array of topics, including demographic characteristics, family structure and support, health status, physical assessments, healthcare utilization and insurance, employment, retirement and pensions, income, consumption, assets, and community conditions. To make the data more accessible to researchers and to facilitate such comparisons, the USC Gateway to Global Aging Data team created the Harmonized CHARLS, a user-friendly version of a subset of the CHARLS interviews. The Harmonized CHARLS initiative is part of a larger set of projects. With funding and support from the National Institute on Aging, they have also developed Harmonized HRS (USA), Harmonized MHAS (Mexico), Harmonized ELSA (England), Harmonized SHARE (Europe and Israel), Harmonized CRELES (Costa Rica), Harmonized KLoSA (South Korea), Harmonized JSTAR (Japan), Harmonized TILDA (Ireland), Harmonized LASI (India), and Harmonized MARS (Malaysia). The variables for this study were selected from the Harmonized CHARLS to construct evaluation indicators for research on active aging. Since the Harmonized CHARLS only includes data up to 2018, we manually incorporated the 2020 wave into the dataset following the same coding logic.
Numerous studies have demonstrated the utility of assessing older adults’ ability to perform basic (ADLs) and instrumental (IADLs) activities of daily living. Accordingly, we adopted the ADL (Cronbach’s alpha = 0.82) and IADL (Cronbach’s alpha = 0.83) scales from Harmonized CHARLS. The ADL scale measures difficulties with bathing, dressing, eating, getting in/out of bed, and toileting. The IADL scale assesses abilities in areas such as using the telephone, managing finances, shopping for groceries, and preparing meals.
Emotional status was assessed using the 10-item CESD depression scale (CESD-10, Cronbach’s alpha = 0.80) from Harmonized CHARLS, which asks about the frequency of ten depressive symptoms experienced in the past week: (1) How often they felt depressed, (2) How often they felt that everything they did was an effort, (3) How often they had restless sleep, (4) How often they felt happy (reverse-coded), (5) How often they felt lonely, (6) How often they were bothered by things that usually do not bother them, (7) How often they felt they could not get “going”, (8) How often they had difficulty concentrating on what they were doing, (9) How often they felt hopeful about the future. (reverse-coded), (10) How often they felt fearful. Responses for each item were assigned values from 0 to 3, corresponding to increasing frequency. The scale includes positive items such as feeling happy and hopeful about the future, which were reverse-coded. Each item is rated on a 0–3 scale, and total scores range from 0 to 30, with higher scores indicating worse emotional health.
Cognitive function was measured using a composite scale (Cronbach’s alpha = 0.83) that encompasses self-rated memory, immediate recall, delayed recall, numeracy, orientation, and visual-spatial ability.
To assess household economic status, we followed recent CHARLS-based literature which recommends using household consumption rather than income to reflect long-term living standards, particularly in rural settings with fluctuating incomes.29 Therefore, we included per capita household consumption and the average annual income of children as economic indicators. Given that most elderly in China are retired and rely on pensions or subsidies, children’s income serves as a proxy for the household’s primary earning capacity.
Residential environment (Cronbach’s alpha = 0.71) was assessed through 10 variables: structural integrity of housing (reinforced concrete or brick), availability of flush toilet, electricity, piped water, bathing facilities, use of polluting fuels for heating and cooking, telephone access, broadband internet, and household cleanliness. Each item was coded from 0 to 1, yielding a total score between 0 and 10.
These indicators were categorized into six primary dimensions based on LDA-derived themes: physical health and functional capacity, psychological well-being and life satisfaction, economic security and intergenerational support, family caregiving and social security, social participation and environmental support, and lifelong learning and self-management. In total, 22 secondary indicators were identified for a comprehensive evaluation of active aging levels.
Data Analysis
Many existing measurement tools for individual-level active aging rely on exploratory factor analysis (EFA) to extract latent dimensions from observed variables. This method is particularly suitable for contexts where the theoretical framework is still evolving. EFA is often combined with weighting approaches such as the Analytic Hierarchy Process (AHP), entropy weighting, or the CRITIC (Criteria Importance Through Intercriteria Correlation) method to assign relative importance to each indicator. Given that this study had already established a theoretical framework using LDA, we opted for an objective weighting strategy to minimize subjective bias. Specifically, we employed the CRITIC method, which determines indicator weights based on both contrast intensity and inter-criterion conflict among 21 variables. A composite Active Aging Index (AAI) score was then computed for each respondent using weighted arithmetic means, with a range from 0 to 1.
All statistical analyses were performed using Stata MP 17.0, IBM SPSS Statistics 29.0.2.0, and MATLAB R2024a. Descriptive statistics were computed for active aging scores and individual, household, and environmental characteristics. One-way ANOVA and independent-sample t-tests were used to assess group differences in active aging levels. Multivariate linear regression (backward stepwise method) was conducted to identify key determinants of active aging, with a significance threshold of α=0.05, P < 0.05 were considered statistically significant.
To further explore the distributional dynamics and evolution of active aging levels across China, we applied kernel density estimation (KDE). KDE enables the non-parametric visualization of the probability density function of the composite AAI score.
To further explore the dynamic distribution and evolutionary patterns of absolute disparities in active aging levels across China, this study employs kernel density estimation to analyze the positional characteristics, distributional trends, extensibility, and polarization tendencies of the composite index within the country. Let  denote the density function of the composite index
  , representing the level of active aging in China:
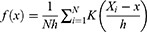
Where  is the number of observations,
  represents independently and identically distributed observations,
  is the mean of the observed values,
  is the kernel function, and
  is the bandwidth. A smaller bandwidth corresponds to higher estimation precision. The kernel function is a type of weighting or smoothing function. Depending on its functional form, kernel density functions can be classified into several types, including Gaussian, Epanechnikov, Triangular, and Quartic kernels. This study adopts the commonly used Gaussian kernel function to estimate the dynamic evolution of the distribution of the composite index of active aging levels in China. The Gaussian kernel density function is defined as follows:
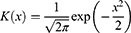
KDE plots assist us in comprehending three crucial distributional characteristics of active aging: (1) central tendency (mean level), (2) shape and dispersion (degree of inequality and polarization), and (3) tail behavior (extent of divergence). For instance, the height and width of peaks provide us with information regarding variation and convergence, whereas the number of peaks signifies polarization. The lengths of the tails disclose the magnitude of disparities.
Results
LDA Topic Modeling Results
Prior to applying the LDA model, text preprocessing was conducted using Jieba word segmentation. To reduce noise, common Chinese stop-word lists were applied. As shown in Figure 1, word frequencies were visualized using a word cloud, providing an intuitive depiction of dominant terms in the corpus.
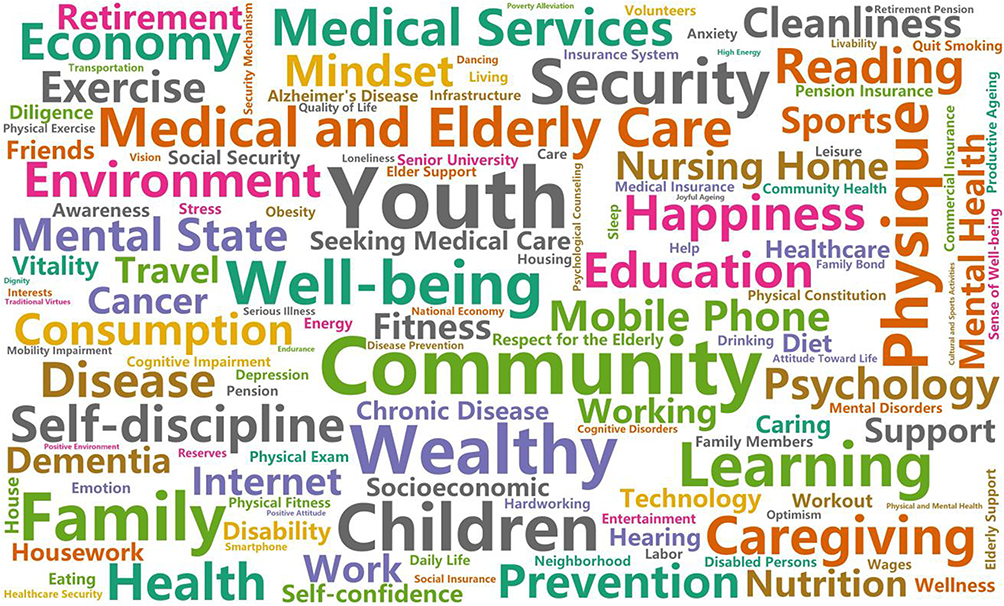 |
Figure 1 Word cloud. |
In the operation of the Latent Dirichlet Allocation (LDA) model, the number of topics K significantly impacts the final results. To objectively and reasonably determine the optimal number of topics, this study calculates the perplexity. Perplexity measures the uncertainty of topic assignment for documents; the lower the perplexity, the better the clustering performance. It is defined as follows:
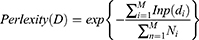
Perplexity was calculated using Python, and the optimal number of topics K was determined at the point where the downward trend of perplexity became insignificant or reached an inflection point. As shown in Figure 2, the perplexity curve exhibits an inflection point at K = 6, indicating that the optimal number of topics is six. When K ranges from 1 to 6, the curve declines continuously until it levels off. When K ranges from 6 to 9, the curve begins to rise. Therefore, this study sets the number of topics in the LDA model to 6.
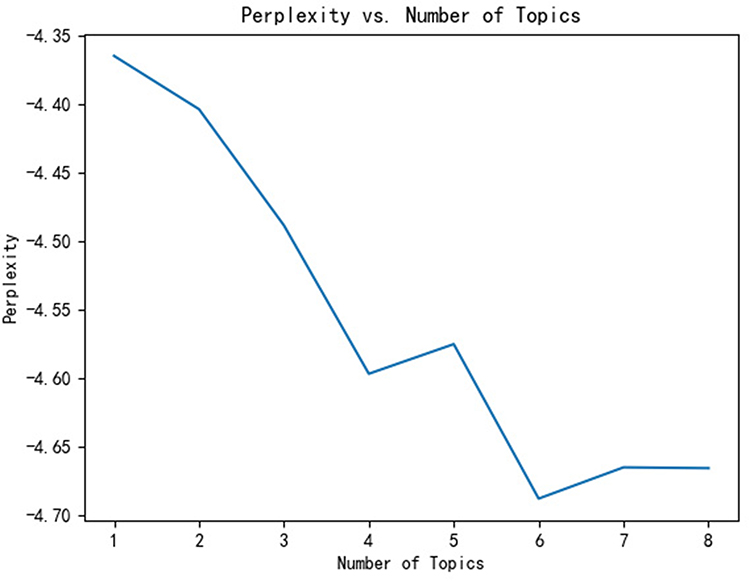 |
Figure 2 Line Chart of Topic Perplexity. |
Using Python’s LDAvis package, we visualized the LDA topic space (Figure 3). The six topics were distributed with clear boundaries and minimal overlap, indicating good semantic separation.
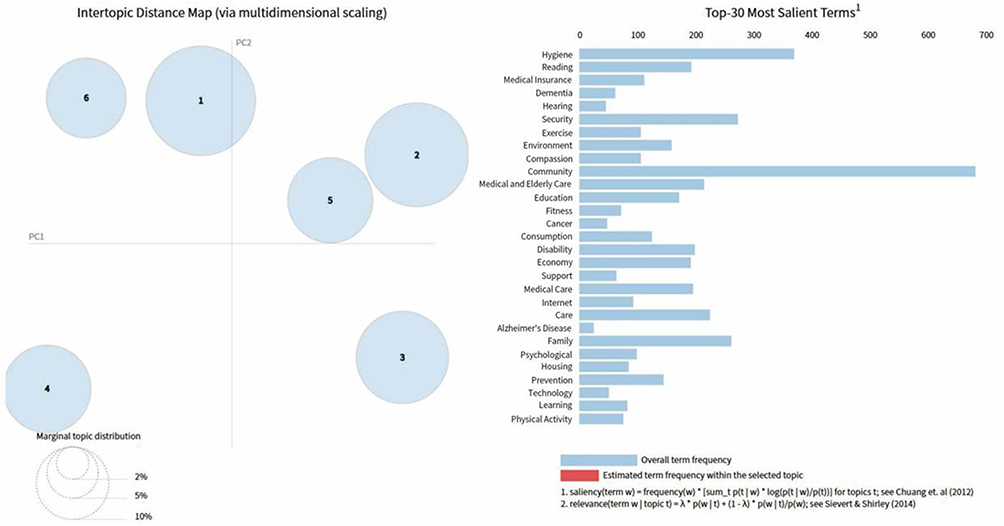 |
Figure 3 Visualization of Topic Modeling Results. |
The top keywords for each topic were extracted and analyzed to assign thematic labels (Figure 4). These latent topics reflect the key concerns and evaluative criteria associated with active aging in China. The final six dimensions identified through LDA were: physical health and functional capacity; psychological well-being and life satisfaction; family caregiving and social security; economic security and intergenerational support; social participation and enabling environments; lifelong learning and self-management. These dimensions form the theoretical basis for the subsequent construction of the Active Aging Index.
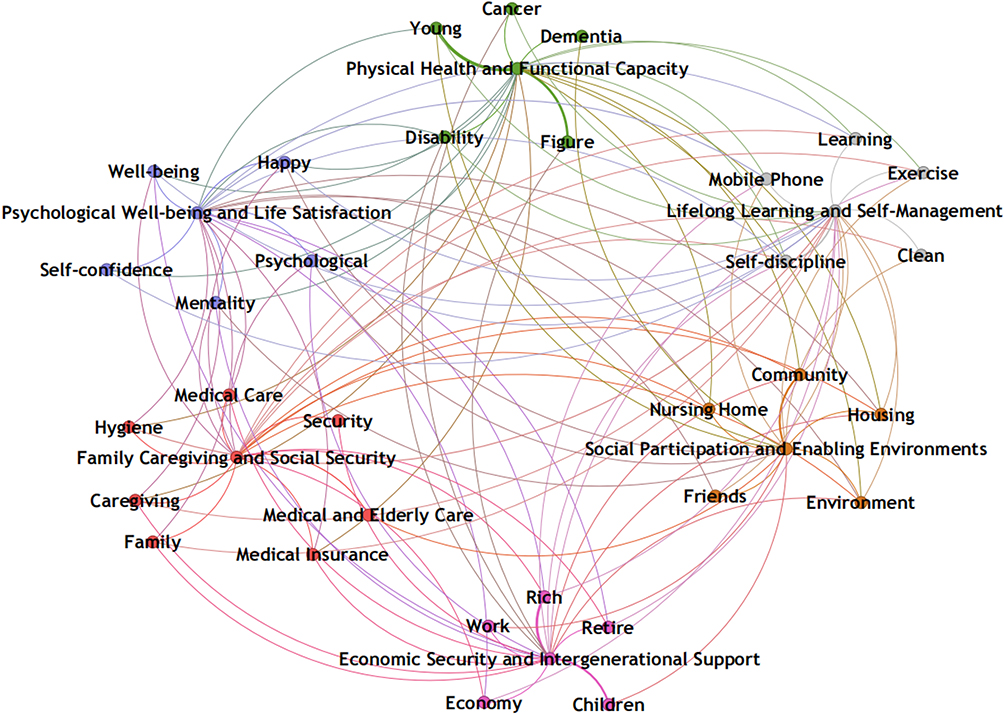 |
Figure 4 LDA Topic Dimensions. |
Indicator System for Active Aging Based on LDA
To ensure scientific validity and practical relevance, we combined qualitative and quantitative approaches to develop the indicator system. First, the six primary dimensions identified through LDA were aligned with key conceptual frameworks, such as the WHO Active Ageing Policy Framework,30 and definitions of active aging at the individual level.22,31 This informed the construction of an initial indicator pool. Next, we employed the brainstorming method to refine and screen indicators. We removed those with high missingness or weak theoretical relevance and supplemented others based on domain knowledge. The final measurement system included 22 secondary indicators across six dimensions (Table 1). These were designed to capture both objective conditions and subjective experiences, offering a comprehensive profile of active aging among older adults in China. Each indicator was coded with clear positive or negative directionality, and most were drawn from standardized instruments within CHARLS (eg, ADLs, CESD - 10, cognitive assessments).
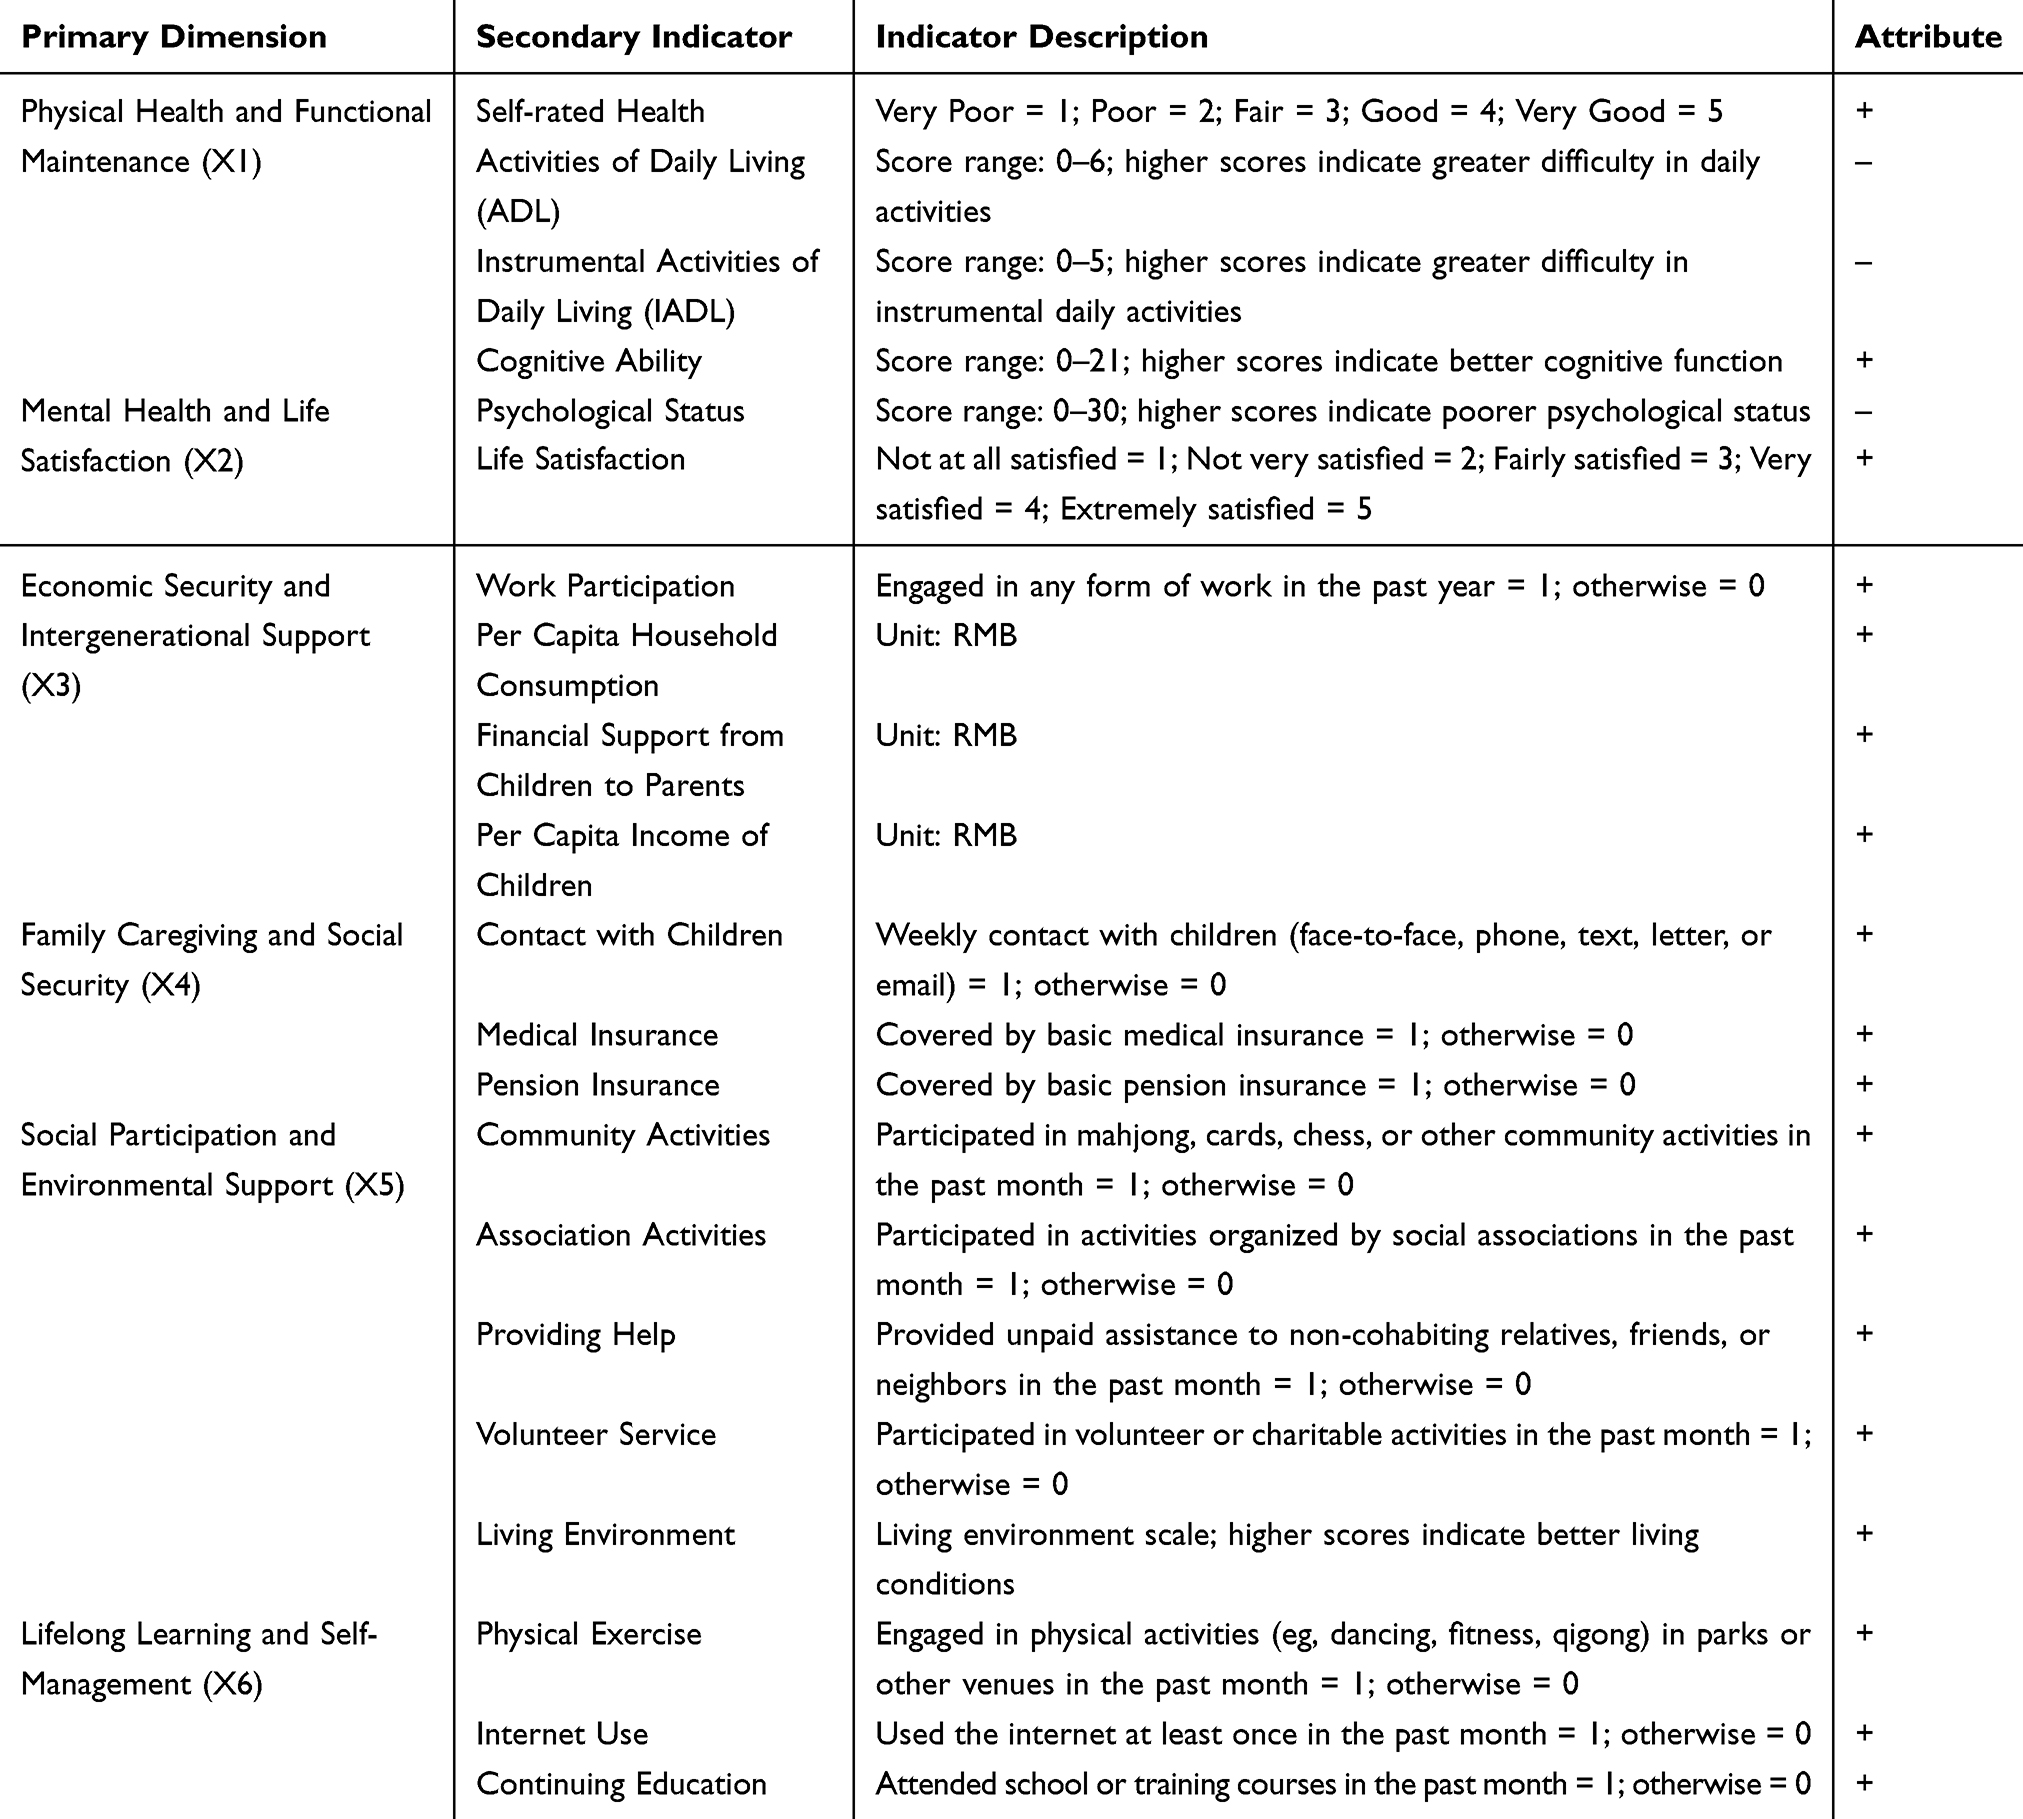 |
Table 1 Active Aging Measurement Indicator System |
Sample Characteristics
After filtering for valid observations—excluding missing or extreme values across outcome and predictor variables—the final analytical sample included 10,863 individuals, contributing 22,097 person-wave observations across the five survey rounds from 2011 to 2020. The average age of these individuals was 67.87 (SD 6.144 years). Most participants were men (53.1%) and rural residents (62.6%). A majority of the participants had spouses (85.0%) or had suffered from at least one chronic disease (83.2%). About half of the participants were smokers (47.5%) or had not completed primary school education (50.4%). Number of living children: There were between 1–10 living children (Mean = 3.04, SD = 1.403).
CRITIC-Based Weighting of Indicators
Table 2 presents the weights of each dimension and indicator derived using the CRITIC method. Through the CRITIC method, this study finds that within the active aging level evaluation system, Social Participation and Environmental Support, Physical Health and Functional Maintenance, and Family Caregiving and Social Security account for a substantial proportion of the overall weighting. Among these, Contact with Children, Community Activities, and Pension Insurance emerge as particularly significant, containing a high degree of informational content. In addition, Work Participation, Providing Help, and Self-rated Health also play important roles that should not be overlooked. Using these weights, we computed standardized composite scores for each respondent.
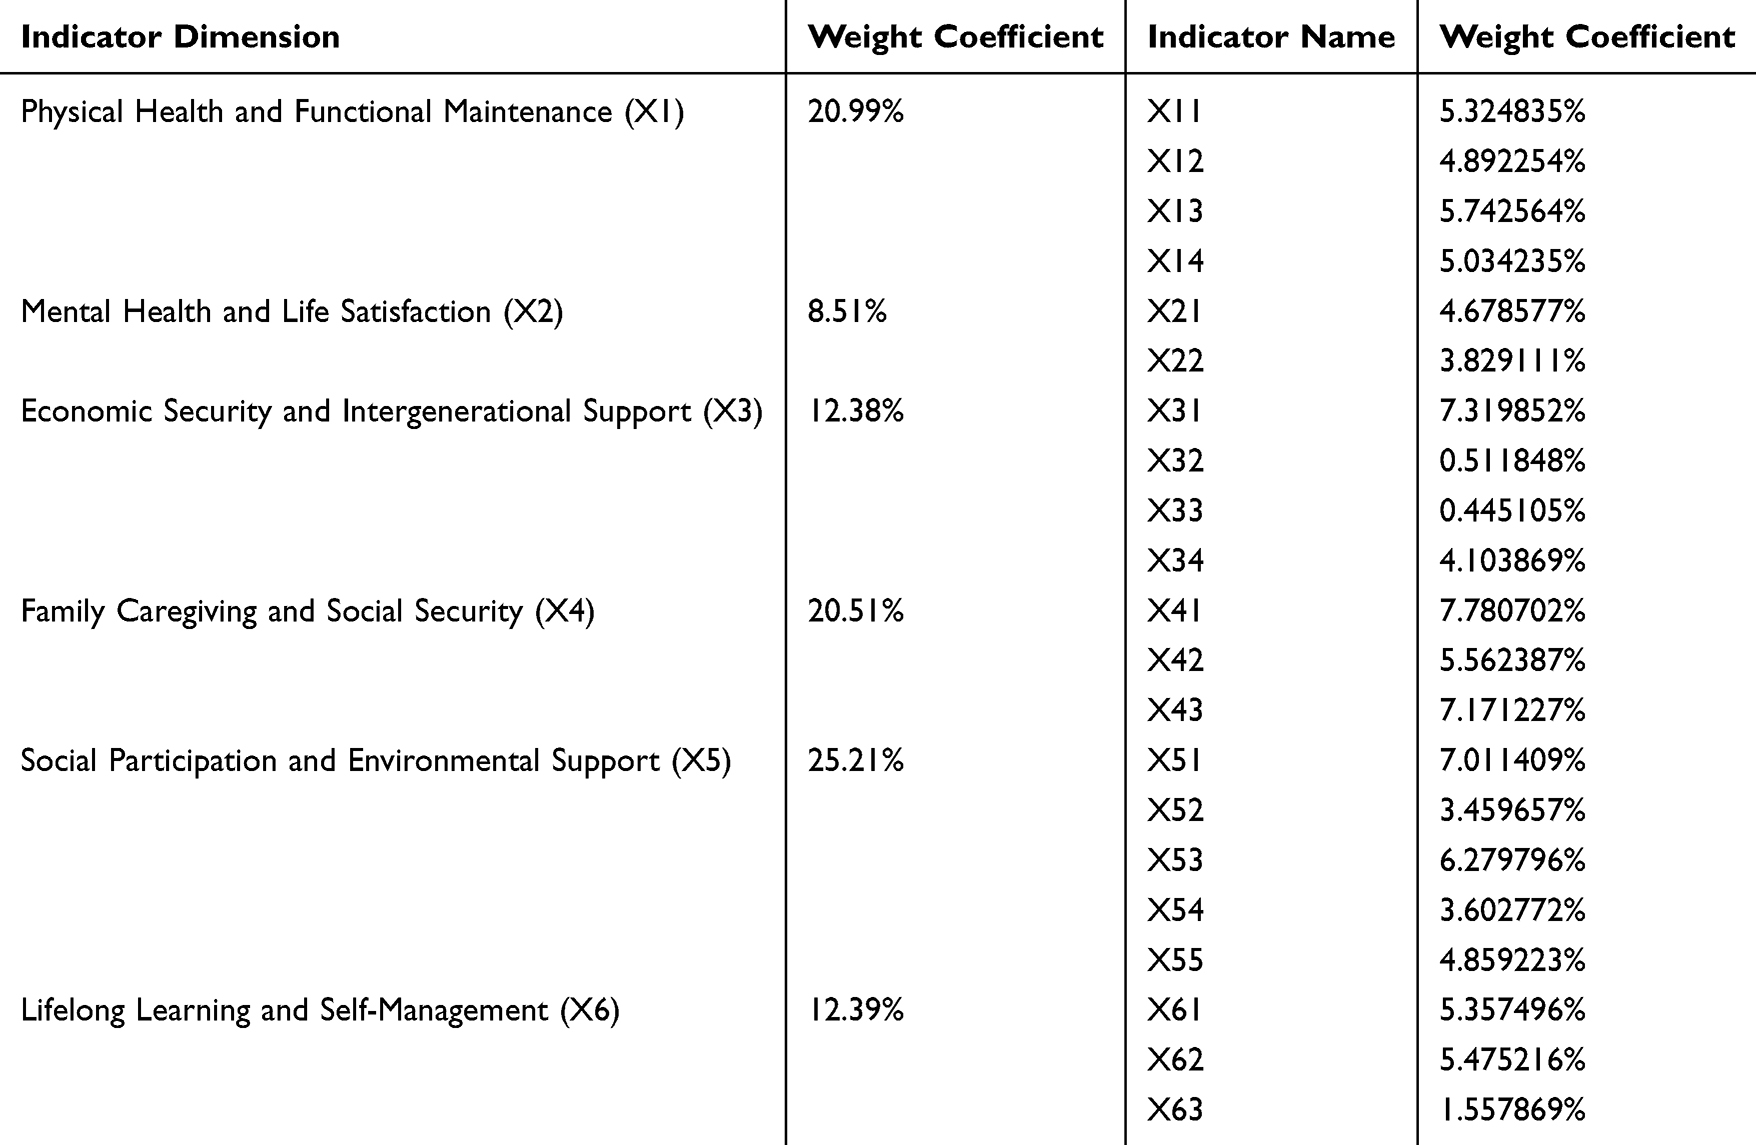 |
Table 2 Weight of Evaluation Index of Active Aging Level Assessment |
The mean Active Aging Index (AAI) score across the full sample was 0.491184±0.090737. Subdimension averages were as follows: Physical Health and Functional Maintenance: 0.147347±0.030992; Mental Health and Life Satisfaction: 0.051336±0.012894; Economic Security and Intergenerational Support: 0.052994±0.035750; Family Caregiving and Social Security: 0.178431±0.041488; Social Participation and Environmental Support: 0.051690±0.040761; Lifelong Learning and Self-Management: 0.009385±0.022759. The study population consisted of individuals aged between 60 and 120 years, with a mean age of 67.87±6.14 years. Among them, 14,635 were aged 60–69, 6284 were aged 70–79, and 1178 were aged 80 or above. The sample included 11,736 males (53.11%) and 10,361 females (46.89%). A total of 13,839 individuals (62.63%) resided in rural areas, while 8258 (37.37%) lived in urban areas. In terms of marital status, 18,801 respondents (85.08%) were married or had a spouse, whereas 3296 (14.92%) were unmarried, widowed, or divorced. Regarding educational attainment, 11,138 individuals (50.41%) had not completed primary school, 5189 (23.48%) had completed primary school, 3583 (16.21%) had received secondary education, and 2187 (9.90%) had attained high school education or above.
Group Differences: Independent t-Tests and ANOVA
As shown in Table 3, significant differences in active aging scores were observed across various individual, household, and environmental characteristics (all p-values < 0.001):
- Gender: Male older adults scored significantly higher than females.
- Age: Younger elderly (ages 60–69) had higher scores than those in older age groups.
- Urban - rural status: Urban residents outperformed their rural counterparts.
- Marital status: Married individuals exhibited higher scores than those without a spouse.
- Educational attainment: Scores increased significantly with the education level.
- Geographical region: The eastern region reported the highest scores, followed by central and northeastern China, with the western region scoring the lowest.
- Chronic conditions: Those without chronic diseases had significantly higher scores.
- Alcohol consumption: Drinkers scored higher than non-drinkers.
- Smoking: Smokers scored slightly higher than non-smokers.
- Notably, active aging scores varied according to the number of living children. Respondents with only one child had the highest scores (mean = 0.5104), followed by those with two children (mean = 0.5067). Scores declined for those with three or more children, with the lowest observed in those with four or more (mean = 0.4720). This suggests a possible inverted U-shaped relationship.
 |
Table 3 Comparison of Active Aging Scores Across Subgroups |
Multivariate Linear Regression Analysis
To further examine the mechanisms through which individual, family, and environmental characteristics influence the level of active aging among older adults in China, multivariate linear regression analysis (backward stepwise method) was conducted using the composite Active Aging Index (AAI) and its six dimensional scores as dependent variables. The independent variables included individual characteristics—gender (male = 1, female = 0), age (60–69 = 1, 70–79 = 2, ≥80 = 3), educational attainment (no formal schooling = 1, primary school = 2, secondary school = 3, high school or above = 4), presence of chronic disease (no = 0, yes = 1), alcohol consumption (no = 0, yes = 1), and smoking status (no = 0, yes = 1); family characteristics—marital status (with spouse = 1, without spouse = 0), number of living children (0 = 0, 1 = 1, 2 = 2, 3 = 3, ≥4 = 4); and environmental characteristics—residence type (rural = 0, urban = 1), and geographic region (eastern = 1, central = 2, northeastern = 3, western = 4). The detailed regression results are presented in Table 4.
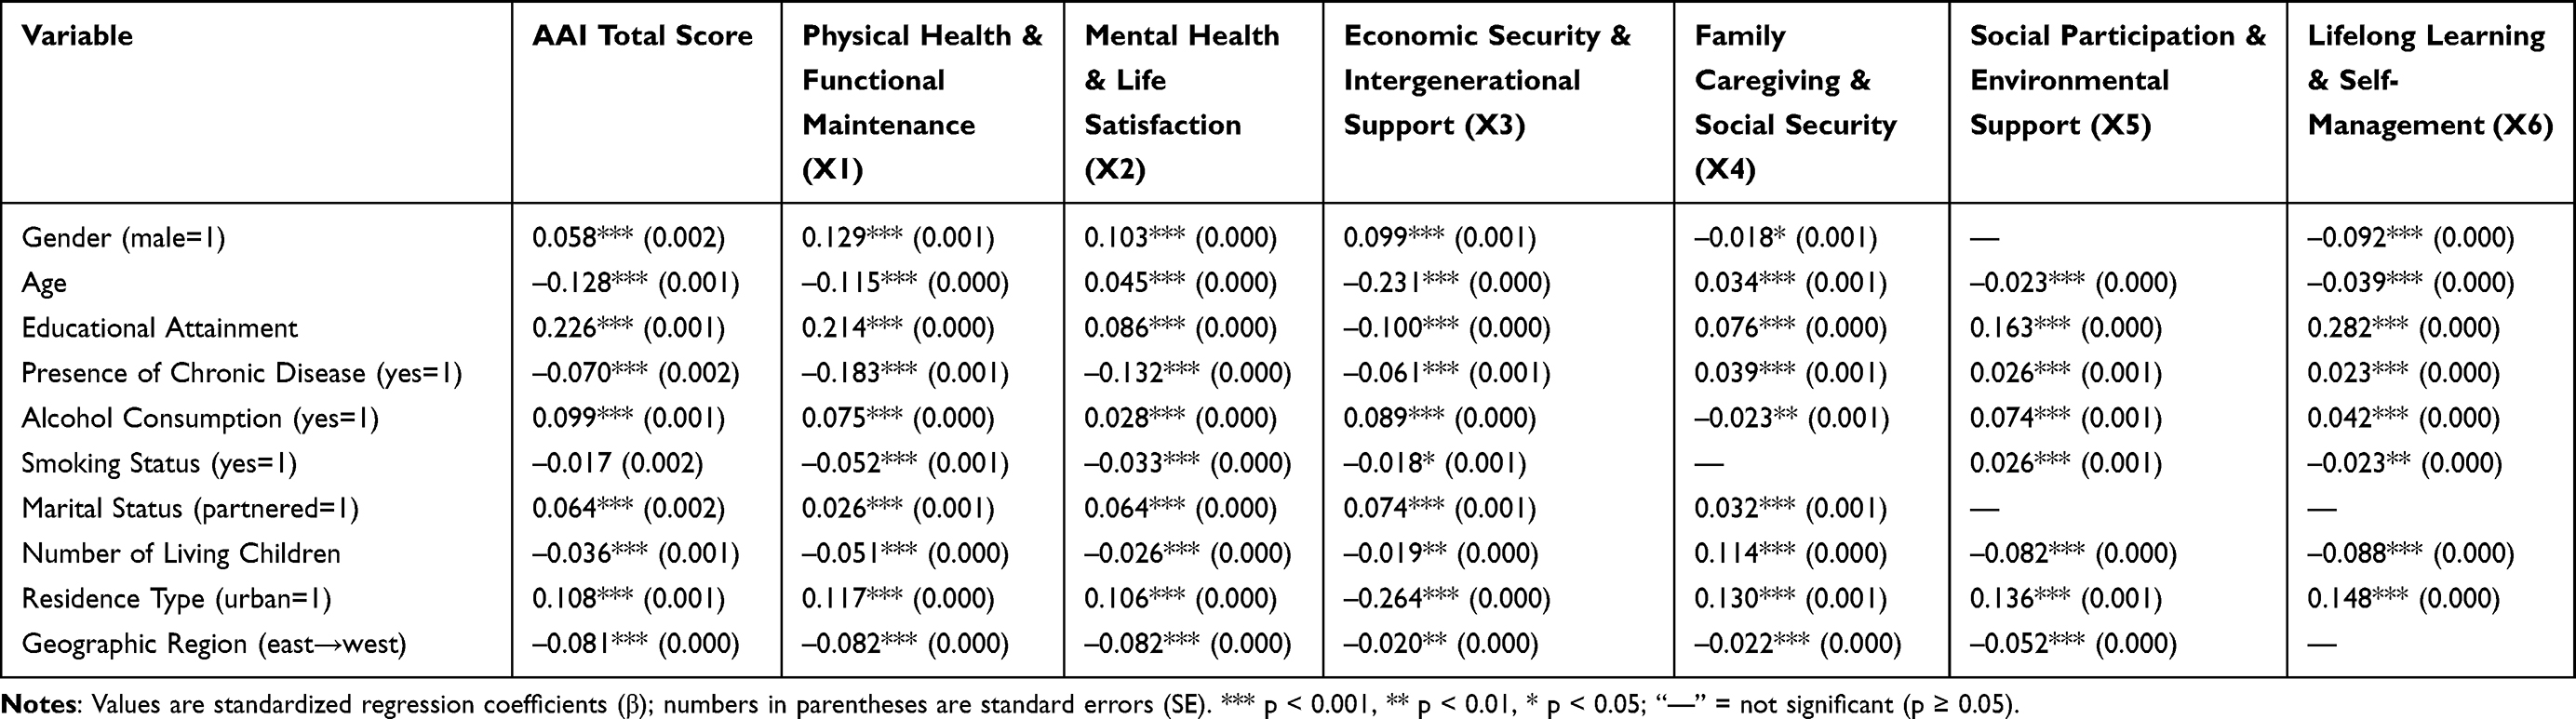 |
Table 4 Summary of Multiple Regression Results for the Active Aging Index (AAI) and Its Six Dimensions |
Results show that all ten explanatory variables entered the final regression model. According to the standardized coefficients (β), the relative influence of the variables on the overall AAI score was ranked as follows: educational attainment (β = 0.226) > age (β = –0.128) > residence type (β = 0.108) > alcohol consumption (β = 0.099) > geographic region (β = –0.081) > presence of chronic disease (β = –0.070) > marital status (β = 0.064) > gender (β = 0.058) > number of living children (β = –0.036) > smoking status (β = –0.017). Among these variables, educational attainment, residence type, alcohol consumption, marital status, and gender were positively associated with the AAI, while age, geographic region, presence of chronic disease, number of living children, and smoking status were negatively associated.
Regression results for the six dimensions revealed substantial heterogeneity in both the strength and direction of effects across domains.
- Physical health and functional maintenance: Educational attainment (β = 0.214) and gender (β = 0.129) exerted the strongest positive effects, while chronic disease showed the strongest negative effect (β = –0.183). This indicates that educational advantages in health literacy, male physiological advantages, and disease burden play central roles in this dimension.
- Psychological well-being and life satisfaction: Educational attainment (β = 0.086) and marital status (β = 0.064) had significant positive effects, whereas chronic disease (β = –0.132) and region (β = –0.082) exhibited clear negative effects. This suggests differences in psychological and life satisfaction outcomes across health and regional contexts.
- Economic security and intergenerational support: Residence type showed the strongest negative association (β = –0.264), indicating that rural older adults performed better than urban older adults in this dimension. This may be related to the higher labor participation rate among rural elders and the greater importance of children’s financial transfers in rural family economies. Age had the second-largest negative effect (β = –0.231), and gender exhibited a positive effect (β = 0.099).
- Family caregiving and social security: Residence type (β = 0.130) had the strongest positive influence, reflecting the higher level of social security coverage in urban areas. The number of living children (β = 0.114) and educational attainment (β = 0.076) were also positively associated with this dimension, consistent with the key role of offspring in family caregiving and the informational advantages of better-educated groups in accessing social insurance programs.
- Social participation and environmental support: Educational attainment (β = 0.163) and residence type (β = 0.136) showed significant positive effects, while the number of surviving children had a significant negative association (β = –0.082). These results suggest that higher education levels and urban residence correspond to greater social participation opportunities, whereas having more children may reduce time and autonomy for community engagement.
- Lifelong learning and self-management: Educational attainment had the strongest positive impact (β = 0.282), followed by residence type (β = 0.148) and gender (β = –0.092). This indicates that better education enhances learning ability and willingness to adopt new behaviors (eg, internet use, health management), while urban environments provide superior learning facilities and resources.
Overall, educational attainment, residence type, age, region, and chronic disease were the most influential and stable determinants across models. Positive effects were mainly observed for education, urban residence, marital status, and alcohol consumption, whereas negative effects were found for age, region, chronic disease, and the number of surviving children. Certain variables demonstrated dimension-specific patterns. For instance, age showed a positive association with psychological well-being but negative associations with other dimensions and the overall AAI, while chronic disease had positive effects in the family caregiving, social participation, and lifelong learning dimensions but a negative effect on the overall AAI. These results highlight the heterogeneity in how age and chronic disease affect different dimensions of active aging. Educational attainment consistently exhibited the most stable positive influence, whereas age displayed the most stable negative effect across dimensions.
Spatial Distribution and Temporal Trends in Active Aging
As shown in the Figure 5, the distribution and dynamic evolution of active aging levels in China exhibit the following three key characteristics: (1) The distribution shifted rightward over time, indicating an overall improvement in active aging levels; (2) The shape of the distribution became progressively flatter over time: the initially sharp peak gave way to a broader and flatter distribution, and the width of the distribution increased. This suggests that disparities in active aging levels have widened over the years. According to the evaluation results, active aging scores generally ranged between 0.2 and 0.8 from 2011 to 2018 but expanded to a range of 0.18 to 0.84 by 2020. Furthermore, Figure 5 shows that the left tail of the distribution became longer over the observation period, further indicating an expansion in the disparity of active aging levels; (3) The number of distributional peaks increased from a single main peak to two closely spaced peaks over time. This suggests the emergence of a mild polarization in active aging levels among older adults during the study period.
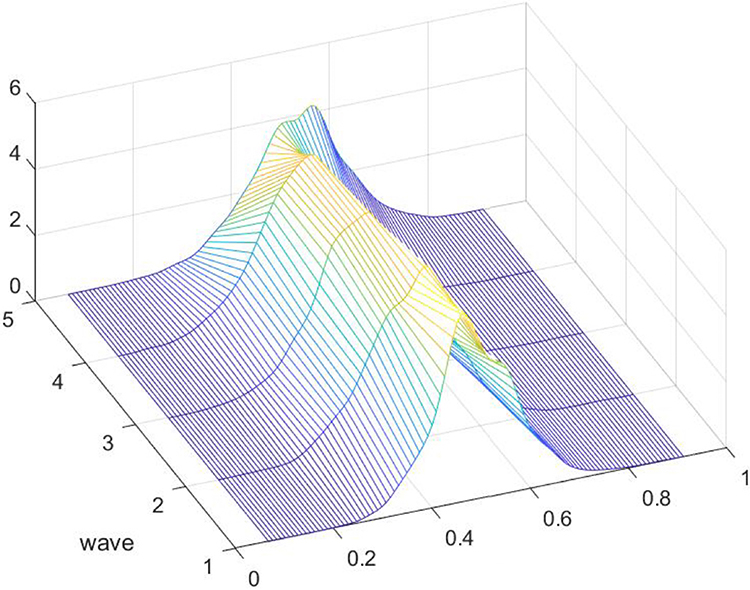 |
Figure 5 Evolution of Active Aging Scores (Five-Wave Panel Data from 2011 to 2020). |
As shown in Figure 6, the three-dimensional kernel density estimation of active aging levels across Eastern, Central, Northeastern, and Western China reveals several distinct patterns of dynamic distributional evolution over the five-wave observation period:
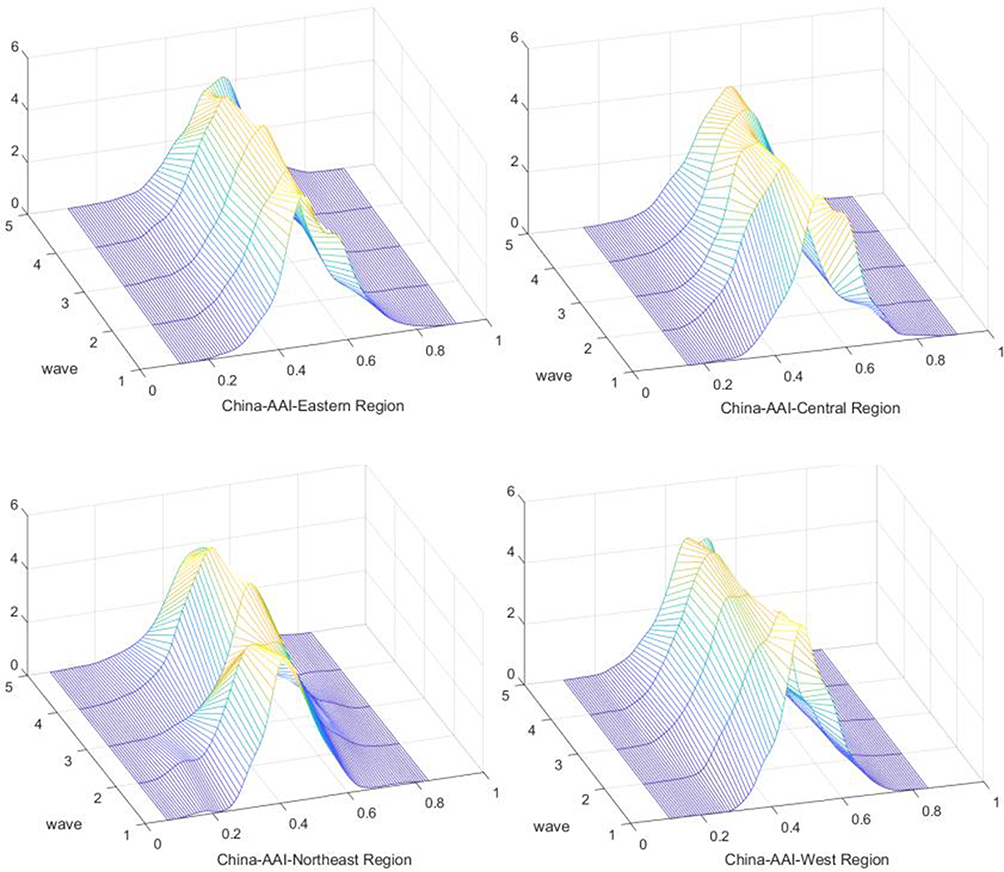 |
Figure 6 Evolution of Active Aging Levels in Eastern, Central, Northeastern, and Western China (Five-Wave Panel Data from 2011 to 2020). |
First, the overall distribution in the Eastern and Northeastern regions shifted to the right during the study period, indicating a gradual improvement in active aging levels in these two regions, with the Eastern region showing the most pronounced rightward shift. In contrast, the distributions in the Central and Western regions initially moved slightly to the left before shifting to the right, suggesting a pattern of decline followed by improvement in active aging levels over time.
Second, both the Eastern and Western regions experienced a flattening of peak height and broadening of peak width, indicating an expanding disparity in active aging levels. The Northeastern region exhibited a more complex evolution: the peak height transitioned from sharp to flat, then returned to sharp before ultimately flattening again. In the Central region, however, the distributional peak became increasingly pronounced and narrower in width, suggesting a reduction in intra-regional disparity in active aging levels.
Third, the Northeastern region consistently maintained a single dominant peak throughout the observation period, indicating no evidence of multipolar polarization. In contrast, both the Eastern and Central regions transitioned from having one main peak and a smaller secondary peak on the right to a single main peak, reflecting a mitigation of multipolar polarization in active aging levels. Meanwhile, the Western region evolved from a single dominant peak to two closely spaced peaks, suggesting the initial emergence of a bipolar distribution in active aging levels among older adults in that region.
Fourth, the left tail of the active aging level distribution lengthened across all regions during the observation period, further indicating a gradual widening of disparities.
Discussion
This study develops a six-dimension evaluation framework for active aging in China using a Latent Dirichlet Allocation (LDA) topic model and conducts an empirical analysis based on five waves of CHARLS panel data. We systematically examine levels, determinants, and spatiotemporal dynamics of active aging among Chinese older adults. The findings resonate with international theory and evidence while uncovering mechanisms shaped by China’s socioeconomic context, family structure, and regional development disparities. Below we elaborate the core results and situate them within the literature.
LDA-Based Assessment Framework
Responding to China’s unique challenge of “aging before affluence” and the limited localization of existing tools, we triangulate social media discourse, policy documents, and news narratives, and identify six core dimensions of active aging via LDA: physical health and functional maintenance, psychological well-being and life satisfaction, economic security and intergenerational support, family caregiving and social security, social participation and environmental support, and lifelong learning and self-management. Building on WHO’s tripartite pillars of health, participation, and security, the framework further specifies culturally salient domains such as “family caregiving and social security” and “lifelong learning and self-management”, reflecting the centrality of family in China and the emerging needs of digital inclusion and educational empowerment among older adults.
CRITIC weighting indicates that “social participation and enabling environments” (25.21%), “physical health and functional maintenance” (20.99%), and “family caregiving and social security” (20.51%) account for the largest shares of information content—signaling that participation opportunities, bodily function, and family/social support are key pillars of active aging in China. The prominence of family-related domains mirrors the country’s cultural context. A similar emphasis on family relations as a core domain also appears in Thailand’s AAI work.15
Determinants of Active Aging
Multivariate linear regressions show that education, urban residence, male gender, alcohol use, and being partnered are positive predictors of active aging, whereas older age, region, chronic conditions, number of living children, and smoking are negative predictors. Decompositions by dimension reveal marked heterogeneity in pathways—offering a more granular account of the Chinese case.
Active aging differs significantly by gender, with men scoring higher than women. This aligns with evidence from multiple settings. In Bangladesh, gender gaps are significant across all AAI dimensions and women score lower than men in both rural and urban areas.32 In Iran, women record markedly lower AAI totals and widespread physical inactivity, which undermines health-related quality of life.33 Even where overall AAI differences are attenuated, women face structural disadvantages in the “security” pillar—lower land ownership, pension coverage, and income sufficiency.34 These results underscore the need for gender-sensitive policies to ensure equitable opportunities in later life. In China, a dual mechanism likely operates: traditional gender roles sustain men’s participation channels (eg, employment), while women experience higher chronic disease prevalence and cumulative social-network disadvantages—jointly constraining their active aging outcomes.
Overall AAI declines with advancing age, consistent with expectations that multimorbidity, cognitive decline, and losses in social resources elevate depression risks and functional limitations among the oldest-old.35 Yet age exhibits a positive association within the psychological well-being and life satisfaction dimension. This is consistent with the “paradox of aging”, whereby emotional regulation and subjective well-being improve despite physical decline.36 Socioemotional Selectivity Theory further posits that shortened time horizons orient older adults toward affective goals and high-quality relationships, fostering greater emotional stability and life satisfaction.37 Policies should leverage this adaptive capacity by pairing medical and functional support with targeted psychological promotion.
Educational attainment shows the largest standardized effect among covariates, highlighting the primacy of individual resources for active aging and confirming education’s status as a “fundamental cause” within social determinants of health.38 Qualitative work identifies educational attainment as a key driver in AAI computation, on par with social participation and access to health services.39 In Brazil, AAI-Brazil correlates positively with HDI and, specifically, AAI-employment with HDI-education.40,41 In China, education additionally facilitates digital adaptation and navigation of the social insurance system, thereby broadening participation and lifelong learning opportunities.
Consistent with international evidence, chronic disease suppresses overall AAI through restrictions on function, financial burdens, and depressive symptoms.42,43 However, we observe positive associations for chronic conditions within family caregiving and social security, social participation and enabling environments, and lifelong learning and self-management. A plausible explanation is a compensatory active-aging mechanism: diagnoses may trigger stronger mobilization of family care, greater uptake of insurance and community resources, participation in health programs, and heightened self-management and health literacy behaviors (eg, exercise, online learning). Disease thus acts as an external motivator that, while reducing health capacity, can stimulate supportive interactions and self-care capabilities. Active aging can consequently be attained not merely through health-related advantages but also by means of disease-mediated support mechanisms and behavioral compensatory strategies.
Contrary to intuitive expectations, the data in this study indicate that alcohol consumers exhibit higher AAI indices. International findings on alcohol and healthy aging are mixed and context-dependent.44 The positive effect found in this study may be due to the mediating role of social capital: moderate alcohol consumption in China is often embedded in social activities, and this social embedding may offset some health risks by increasing social participation.
The independent samples t-test results in the previous section revealed higher scores in the smoking group compared to non-smokers. However, after controlling for individual, family, and environmental characteristics in the multiple regression analysis, the independent effect of smoking turned negative. This suggests that smoking itself may exert a mild inhibitory effect on active aging levels when other variables are excluded. Future research could further integrate theoretical frameworks and inter-variable relationships to explain why smoking’s effect on active aging reverses after controlling for other factors. Existing data also indicate a negative correlation between smoking and healthy aging.44 An Indian study demonstrated that elderly males exhibit significantly higher smoking rates than females, with smoking being a major predictor of poor health status.45
Being partnered is associated with higher AAI, in line with cross-national evidence that spouses provide emotional support, instrumental help, and economic security that buffer aging stress and promote participation;46 unpartnered older adults face greater barriers to healthcare access.47 Compenstatory mechanisms may potentially emerge: filial support, sibling assistance, or cohesive community networks could partially mitigate spousal absence. Consequently, enhancing social support systems for elderly individuals experiencing singlehood represents an efficacious compensatory intervention strategy.
Current research consistently highlights the positive correlation between the number of children and intergenerational support as well as well-being among the elderly. Generally, increased numbers of children correlate with higher levels of intergenerational support and well-being for older adults,48 with the rise in children’s numbers showing a significant positive effect on their life satisfaction.49 However, some empirical studies indicate a threshold effect in children’s numbers, suggesting that parental intergenerational support is not always positively correlated with the number of children.50 Our study reveals that families with one surviving child exhibit the highest level of active aging among the elderly. When the number of surviving children exceeds one, increased numbers paradoxically lead to lower active aging levels, forming an inverted U-shaped curve. This phenomenon may reflect a paradigm shift in family dynamics during modernization: smaller families tend to optimize intergenerational support quality, while large families may experience “responsibility diffusion effects” due to dispersed caregiving responsibilities.
Compared with rural residents, urban residents have significant advantages in active aging, which reflects the profound socio-economic and infrastructure gaps between urban and rural areas in China. Relevant studies have revealed the disparities between urban and rural regions in the aging process, with rural elderly populations facing more severe socio-economic risks.50 Other studies, through analyzing the quality of life of the elderly, have found that urban elderly scored higher than rural elderly in all dimensions of AAI.32 Based on this, policy-making should balance urban and rural development, improve the accessibility of medical services in rural areas, increase pension coverage, and enhance community facilities, to promote balanced development of active aging in both urban and rural areas.
China shows significant regional disparities in active aging, with eastern regions outperforming central, northeastern, and western regions. This pattern profoundly reflects the structural impact of China’s uneven economic development on the aging process. Equally noteworthy is the northeastern region (0.4899±0.0927), which, as the earliest area in China to enter deep aging, has a slightly higher level of active aging than the west but remains significantly lower than the east and central regions. This finding corroborates the typical characteristics of “Rust Belt Aging”: traditional industrial bases, after enduring the pains of industrial transformation, face multiple pressures such as population outflow and declining pension replacement rates, creating a vicious cycle where institutional transformation and the aging process reinforce each other. Some studies indicate that although the concept of active aging carries positive connotations, neglecting regional diversity in policy formulation may lead to top-down policy implementation that deviates from local realities. Therefore, incorporating regional diversity into policy considerations is one of the key strategies to avoid such risks.51 On the other hand, Thai research reveals that the central region has significantly lower levels of active aging compared to the north, northeast, and south, suggesting the need for targeted policy interventions in the central region.52 Based on this, it is necessary to formulate regionally differentiated policies to enhance the level of active aging and establish a precise intervention system that balances regional characteristics and group needs.
Spatiotemporal Dynamics
From 2011 to 2020, China’s active aging level exhibited spatiotemporal evolution characteristics of “overall steady improvement and intensified regional differentiation”. The rightward shift of the distribution curve during the sample period confirmed the positive effects of incorporating active aging into national strategic planning.
The eastern region continues to expand its leading advantages, with its distribution curve showing a significant rightward shift and widening gap, reflecting accumulated strengths in economic development, public services, and innovation resources. However, the emerging polarization within the region indicates diverging capabilities among different subgroups (such as urban-rural divides and elderly populations with varying socioeconomic statuses) in addressing aging challenges. While some groups may successfully ride the wave of development, others risk falling behind.
During the investigation period, the level of active aging in central and western regions experienced a process of first decreasing and then increasing. This phenomenon likely reflects the combined impact of socio-economic macro policies and demographic changes on central and western regions during the specific period of 2011–2020 in China. The initial decline in the level of active aging may have been affected by negative factors such as the outflow of young and able-bodied labor and changes in family support patterns in central and western regions, while the subsequent increase benefited from the long-term and cumulative dividends of national strategic policies (such as poverty alleviation and social security). The distribution peak in central regions became sharper and narrower, possibly due to the effectiveness of regional coordinated development under the central rise strategy, where the effective descent of resources and policies has narrowed the welfare gap among elderly populations in different regions within the province.
The complex changes in the peak pattern of northeast China reflect the instability of the active aging level of this traditional industrial base under the multiple challenges of industrial transformation, population outflow and the pressure of pension security system.
The above complex regional evolution pattern indicates that China’s active aging process is not a uniform picture, but is deeply constrained by the transformation paths of local socio-economic structures. Therefore, some of the country’s “one-size-fits-all” aging policies are clearly insufficient. It is necessary to implement refined governance that respects regional diversity to truly achieve balanced development of active aging.
Conclusions
This study developed a novel indicator framework for measuring active aging among older adults in China, based on Latent Dirichlet Allocation (LDA) topic modeling. Drawing upon five waves of panel data from the China Health and Retirement Longitudinal Study (CHARLS), we conducted a comprehensive and rigorous assessment of individual-level active aging outcomes.
Key Findings Include
(1) Overall Improvement: The active aging level of older adults in China has steadily improved during the study period (2011–2020), with the most significant progress observed in the eastern region.
(2) Widening Regional Gaps: Disparities in active aging levels increased between the eastern, northeastern, and western regions, whereas the central region experienced a narrowing of differences.
(3) Determinants of Active Aging: Factors positively associated with active aging scores include higher educational attainment, urban residency, male gender, alcohol consumption, and being married. Conversely, older age, region (central/west/northeast), the presence of chronic conditions, a greater number of living children, and smoking were negatively associated. Among these, educational attainment, urban-rural residence, age, and gender emerged as the most salient determinants.
Limitations and Future Directions
Limitations
This study acknowledges several limitations. First, in the CHARLS dataset, proxy responses were utilized when participants were unable to independently complete the survey due to cognitive impairment, illness, or disability. Although this approach was necessary, it may undermine the accuracy of the information provided by or about the most vulnerable sub-populations, potentially influencing the representativeness of the analysis.
Additionally, even though the measurement framework was constructed using a data-driven LDA model, the specific operational indicators were chosen from pre-existing variables within the CHARLS dataset. Consequently, the framework may not comprehensively encompass all relevant dimensions of active aging, such as personal interests, religious involvement, sexual health, working conditions, and the availability of community-based services.
Finally, the use of multivariate linear regression, while identifying key determinants, may not fully capture the complex, non-linear interactions between these factors. Future research could employ techniques like graph analysis to model the intricate network of relationships among determinants, potentially revealing central hubs and synergistic effects that are not apparent in a linear additive model.
Strengths
Despite these limitations, the study offers several novel contributions. It introduces a methodological innovation by departing from the conventional WHO “three-pillar” framework and employing topic modeling on diverse textual sources—including social media comments, government policies, and news articles—to construct an empirically grounded and culturally specific indicator system for active aging in China. Furthermore, by utilizing five waves of nationally representative CHARLS panel data and aligning it with international datasets such as HRS, ELSA, and SHARE, the study not only provides robust insights into the dynamics of active aging in China but also establishes a foundation for cross-national comparative research. Finally, the research enhances policy relevance by uncovering the individual, familial, and contextual factors that shape active aging, thereby offering empirical evidence to support the development of more targeted and equitable aging policies.
Future Directions
Future research may consider several promising directions. One potential avenue is the integration of geospatial analysis and predictive modeling to examine long-term trends and regional heterogeneity in active aging trajectories across China. Additionally, expanding the indicator framework to include dimensions such as subjective well-being, digital literacy, community support systems, and environmental adaptability would enable a more holistic assessment of active aging. Given the adaptability of the LDA-based framework, future studies could also adopt a “local calibration—indicator mapping” strategy to apply this model in other national contexts using internationally harmonized datasets such as HRS and SHARE, thereby laying the groundwork for a global comparative paradigm in active aging research.
Data Sharing Statement
The data that support the findings of this study are available from the corresponding author upon reasonable request.
Ethical Approval
This study used publicly available secondary data (CHARLS). Institutional Review Board of Peking University (approval number: IRB00001052-11015) approved CHARLS, and all participants gave their written consent. CHARLS follows the ethical rules set out in the Declaration of Helsinki and China’s Personal Information Protection Law. Strict protocols for privacy protection and data anonymization were implemented throughout the data collection and processing phases to ensure the confidentiality and security of participants’ personal information. The present analysis involved only de-identified, publicly available data and did not include any direct interaction with human participants or the collection of new human data. According to the Measures for Ethical Review of Life Science and Medical Research Involving Human Subjects (Article 32, items 1–2, issued February 18, 2023, China), studies using anonymized public datasets are exempt from additional ethical review. Therefore, this study was exempt from review by our institutional ethics committee.
Informed Consent
Informed consent was obtained from all participants by the original investigators of the China Health and Retirement Longitudinal Study (CHARLS). This study used publicly available secondary data and did not involve direct interaction with human subjects.
Acknowledgments
The research was primarily conducted at the School of Statistics and Data Science, Jiangxi University of Finance & Economics. Additional academic and institutional support was provided by the Research Institute of High-speed Railway and Regional Development, East China Jiaotong University.
Author Contributions
All authors made a significant contribution to the work reported, whether that is in the conception, study design, execution, acquisition of data, analysis and interpretation, or in all these areas; took part in drafting, revising or critically reviewing the article; gave final approval of the version to be published; have agreed on the journal to which the article has been submitted; and agree to be accountable for all aspects of the work.
Funding
This work was supported by the National Social Science Foundation of China [21&ZD150] and the Provincial Postgraduate Innovation Special Funds Project of Jiangxi [YC2023-B172].
Disclosure
The authors declare no conflicts of interest.
References
1. World Health Organization. Ageing and health. Available from: https://www.who.int/news-room/fact-sheets/detail/ageing-and-health.
2. Ministry of Civil Affairs of the People’s Republic of China. Annual report on the development of China’s aging cause 2023. Available from: https://www.mca.gov.cn/n156/n2679/c1662004999980001751/content.html.
3. World Health Organization. Active aging: a policy framework. In: Noncommunicable Diseases and Mental Health Cluster, Noncommunicable Disease Prevention and Health Pro-Motion Department and Aging and Life Course. Geneva: World Health Organization; 2002. Available from: http://whqlibdoc.who.inthq/2002/who_nmh_nph_02.8.pdf.
4. López-López R, Sánchez M. The institutional active aging paradigm in Europe (2002–2015). Gerontologist. 2020;60(3):406–415. doi:10.1093/geront/gnz094
5. China SCo. Notice of the state council on printing and distributing the 13th five-year plan for the development of the national aging career and the construction of the pension system. 2017. Available from: http://www.gov.cn/zhengce/content/2017-03/06/content_5173930.htm.
6. China CPsGotPsRo. The 14th five-year pan for people’s Republic of China’s national economic and social development and the outline of the long-term goals in 2035. 2021. Available from: http://www.gov.cn/xinwen/2021-03/13/content_5592681.htm.
7. China SCo. Opinions of the CPC central committee and the state council on strengthening the work on aging in the new era. 2021. Available from: http://www.gov.cn/zhengce/2021-11/24/content_5653181.htm.
8. Thanakwang K, Soonthorndhada K. Attributes of active ageing among older persons in Thailand: evidence from the 2002 survey. Asia Pac Popul J. 2006;21(3):113–135.
9. Zaidi A, Gasior K, Hofmarcher MM, et al. Active ageing index 2012. Vienna: European Centre. 2012.
10. Liu W, Yang F. Zhongguo jiji laolinghua fazhan shuiping cedu—Jiyu dong zhong xibu diqu he 28 ge shengshi de shuju yanjiu [Measuring the development level of active aging in China: a data-based study of eastern, central, and western regions and 28 provinces]. Renkou Xuekan. 2019;41(2):100–112. in Chinese.
11. Yang F. Zhongguo jiji laolinghua shuiping cedu—Jiyu CHARLS he CGSS de shizheng yanjiu [Measurement of active aging in China: an empirical study based on CHARLS and CGSS]. 2019. Jinan: Shandong University. (in Chinese).
12. Pham VT, Chen YM, Van Duong T, et al. Adaptation and validation of active aging index among older Vietnamese adults. J Aging Health. 2019;32(7–8):604–615. doi:10.1177/0898264319841524
13. Um J, Zaidi A, Choi SJ. Active ageing index in Korea - comparison with China and EU countries. Asia Soc Work Policy Rev. 2019;13(1):87–99. doi:10.1111/aswp.12159
14. Guntupalli AM, Chakraborty S. Active ageing index (AAI) in India: is the approach used in european countries applicable to developing countries? Building evidence for active ageing policies. Singapore: Springer Singapore. 2018: 437–463.
15. Thanakwang K, Isaramalai SA, Hatthakit U. Development and psychometric testing of the active aging scale for Thai adults. Clin Interv Aging. 2014;9:1211–1221. doi:10.2147/CIA.S66069
16. Haque MN, Soonthorndhada K, Hunchangsith P, et al. Active ageing level in Thailand: a comparison between female and male elderly. J Health Res. 2016;30(2):99–107.
17. Hu M. Laonianren jiji laolinghua ceping yanjiu [A study on the assessment of active aging among the elderly]. 2012, Nanchang: Nanchang University. (in Chinese).
18. Xie H. Jiji laolinghua moxing goujian: jiyu Shijie Weisheng Zuzhi jiji laolinghua kuangjia de shizheng yanjiu [Construction of an active aging model: an empirical study based on the WHO active aging framework]. 2019, Jinan: Shandong University. (in Chinese).
19. Mohammadi E, Allahyari T, Darvishpoor KA, et al. Determining psychometric properties of iranian active aging measurement instrument. Sālmand. 2018;12(4):414–429.
20. Buys L, Miller E. Active ageing: developing a quantitative multidimensional measure. 2012. doi: 10.1007/978-94-007-2111-1_7
21. Zasimova L, Sheluntcova M. Measuring active aging for government policy planning: a case of Russia. higher school of economics research paper No. WP BRP 11/PA/2014. 2014. Available from: https://ssrn.com/abstract=2385832.
22. Rantanen T, Portegijs E, Kokko K, et al. Developing an assessment method of active aging: university of Jyvaskyla Active Aging Scale. J Aging Health. 2019;31(6):1002–1024. doi:10.1177/0898264317750449
23. Keeratisiroj O, Kitreerawutiwong N, Mekrungrong-wong S. Development of self-active aging index(s-aai)among rural elderly in lower northern Thailand classified by age and gender. Sci Rep. 2023;13(1):2676. doi:10.1038/s41598-023-29788-2
24. Hijas-Gómez AI, Ayala A, Rodriguez-Garcia MP, et al. The who active ageing pillars and its association with survival: Findings from a population-based study in Spain. Arch Gerontol Geriatr. 2020;1:90.
25. Zhao Y, Hu Y, Smith JP, Strauss J, Yang G. Cohort profile: the China health and retirement longitudinal study(CHARLS). Int J Epidemiol. 2014;43(1):61–68. doi:10.1093/ije/dys203
26. Papadimitriou CH, Raghavan P, Tamaki H, et al. Latent semantic indexing: a probabilistic analysis. J Comput Syst Sci. 2000;61(2):217–235. doi:10.1006/jcss.2000.1711
27. Blei DM. Latent Dirichlet Allocation. J Mach Learn Res. 2003;3:993–1022.
28. Thorsrud LA. Words are the new numbers: a newsy coincident index of the business cycle. J Busin Econ Stat. 2020;38(2):393–409. doi:10.1080/07350015.2018.1506344
29. Gong J, Wang G, Wang Y, Zhao Y. Consumption and poverty of older Chinese: 2011-2020. J Econ Ageing. 2022;23:100410. doi:10.1016/j.jeoa.2022.100410
30. Kalache A, Gatti A. Active ageing: a policy framework. Adv Gerontol. 2003;11:7–18.
31. Hofferth SL, Moon UJ. Electronic play, study, communication, and adolescent achievement, 2003 to 2008. J Res Adolesc. 2012;22(2):215–224. doi:10.1111/j.1532-7795.2011.00770.x
32. Haque MA, Afrin S. Construction of the active aging index in Bangladesh: challenges and opportunities. Heliyon. 2022;8(10):e10922. doi:10.1016/j.heliyon.2022.e10922
33. Tajvar M, Yaseri M, Mahmoudi R, et al. Individual-level active aging index and quality of life of older people: a population-based survey in Tehran. Int J Preventive Med. 2022;13(1):2. doi:10.4103/ijpvm.IJPVM_358_20
34. Mandal A, Subramanian M. Beyond chronological age: active ageing index, social class, and economic realities of Rural Karnataka, India. J Prim Care Commun Health. 2025;16:21501319251380672. doi:10.1177/21501319251380672
35. Pei X, Pillai VK. Old age support in China: the role of the state and the family. Int J Aging Human Develop. 1999;49(3):197–212. doi:10.2190/QXLM-PN99-GPN7-32XF
36. Li J, Lai DWL, Chappell NL. The older, the happier?: a cross-sectional study on the “paradox of aging” in China. Res Aging. 2022;44(1):34–43. doi:10.1177/0164027521994225
37. Löckenhoff CE, Carstensen LL. Socioemotional selectivity theory, aging, and health: the increasingly delicate balance between regulating emotions and making tough choices. J Personality. 2004;72(6):1395–1424. doi:10.1111/j.1467-6494.2004.00301.x
38. Comijs HC, van Marwijk HW, van der Mast RC, et al. The Netherlands study of depression in older persons (NESDO); a prospective cohort study. BMC Res Notes. 2011;4(1):524. doi:10.1186/1756-0500-4-524
39. Acosta-Urigüen MI, Holguin JP, Zea-Paredes MS, et al. Conceptualizing the active ageing index (AAI): a systematic literature review of frameworks and supporting digital tools. ICT4AWE. 2024;276–283.
40. Aguirre FB, Tiecker AP, Zmuda GGO, et al. Relationship between active aging and the human development index: particularities of aging in Brazil. Geriatrics Gerontol Aging. 2024;18:1–9. doi:10.53886/gga.e0000172_EN
41. Couto ACL, Silva C. Pobreza, escolaridade e formas de inserção no mercado de trabalho. Uma análise para o Brasil nos anos de 2012 e 2019. Revista Orbis Latina. 2022;12(1):62–82.
42. Mendoza-Núñez VM, Martínez-Maldonado ML, Correa-Muñoz E. Implementation of an active aging model in Mexico for prevention and control of chronic diseases in the elderly. BMC Geriatr. 2009;9(1):40. doi:10.1186/1471-2318-9-40
43. Sun X, Li X. Aging and chronic disease: public health challenge and education reform. Front Public Health. 2023;11:1175898. doi:10.3389/fpubh.2023.1175898
44. Daskalopoulou C, Stubbs B, Kralj C, et al. Associations of smoking and alcohol consumption with healthy ageing: a systematic review and meta-analysis of longitudinal studies. BMJ open. 2018;8(4):e019540. doi:10.1136/bmjopen-2017-019540
45. Cramm JM, Lee J. Smoking, physical activity and healthy aging in India. BMC Public Health. 2014;14(1):526. doi:10.1186/1471-2458-14-526
46. Yuan S, Elam KK, Johnston JD, et al. The influence of marriage and cohabitation on physical activity among middle-aged and older people. J Appl Gerontol. 2024;43(2):139–148. doi:10.1177/07334648231203124
47. Cruz PKR, Vieira MA, Carneiro JA, Costa FM, Caldeira AP. Dificuldades do acesso aos serviços de saúde entre idosos não institucionalizados: prevalência e fatores associados. Rev Bras Geriatr Gerontol. 2020;23(6):e190113. doi:10.1590/1981-22562020023.190113
48. Angeles L. Children and life satisfaction. J Happiness Stud. 2010;11(4):523–538. doi:10.1007/s10902-009-9168-z
49. Chou KL. Number of children and upstream intergenerational financial transfers: evidence from Hong Kong. J Gerontol. 2010;65B(2):227–235. doi:10.1093/geronb/gbp103
50. Egamberdiyeva N, Khamid A, Ruzieva G, et al. Assessing the active aging index in Uzbekistan: employment, social engagement, and well-being. Edelweiss Applied Sci Technol. 2025;9(5):3175–3190. doi:10.55214/25768484.v9i5.7668
51. Principi A, Di Rosa M, Domínguez-Rodríguez A, et al. The active ageing index and policy making in Italy. Ageing Soc. 2023;43(11):2554–2579. doi:10.1017/S0144686X21001835
52. Haque MN. Active ageing level of older persons: regional comparison in Thailand. J Aging Res. 2016;2016(1):9093018. doi:10.1155/2016/9093018
 © 2025 The Author(s). This work is published and licensed by Dove Medical Press Limited. The
full terms of this license are available at https://www.dovepress.com/terms
and incorporate the Creative Commons Attribution
- Non Commercial (unported, 4.0) License.
By accessing the work you hereby accept the Terms. Non-commercial uses of the work are permitted
without any further permission from Dove Medical Press Limited, provided the work is properly
attributed. For permission for commercial use of this work, please see paragraphs 4.2 and 5 of our Terms.
© 2025 The Author(s). This work is published and licensed by Dove Medical Press Limited. The
full terms of this license are available at https://www.dovepress.com/terms
and incorporate the Creative Commons Attribution
- Non Commercial (unported, 4.0) License.
By accessing the work you hereby accept the Terms. Non-commercial uses of the work are permitted
without any further permission from Dove Medical Press Limited, provided the work is properly
attributed. For permission for commercial use of this work, please see paragraphs 4.2 and 5 of our Terms.