Back to Journals » Clinical Ophthalmology » Volume 12
Assessing reproducibility and the effects of demographic variables on the normal macular layers using the Spectralis SD-OCT
Authors Hashmani N ![]() , Hashmani S, Murad A
, Hashmani S, Murad A ![]() , Mahmood Shah SM
, Mahmood Shah SM ![]() , Hashmani M
, Hashmani M
Received 25 April 2018
Accepted for publication 27 June 2018
Published 13 August 2018 Volume 2018:12 Pages 1433—1440
DOI https://doi.org/10.2147/OPTH.S172109
Checked for plagiarism Yes
Review by Single anonymous peer review
Peer reviewer comments 2
Editor who approved publication: Dr Scott Fraser
Nauman Hashmani, Sharif Hashmani, Asif Murad, Sayed Mustafa Mahmood Shah, Maria Hashmani
Department of Ophthalmology and Visual Sciences, Hashmanis Hospital, Karachi, Pakistan
Purpose: To quantify and view the possible influence of demographic variables on normal macular layers. Additionally, we wanted to assess the reproducibility using the Spectralis SD-OCT.
Methods: A Spectralis SD-OCT machine using a commercially available algorithm was used to scan 242 healthy subjects in an outpatient setting. We examined retinal thicknesses in seven layers: retinal nerve fiber layer (RNFL), ganglion cell layer (GCL), inner plexiform layer (IPL), inner nuclear layer (INL), outer plexiform layer (OPL), outer nuclear layer (ONL) and retinal pigment epithelium (RPE). Combined retinal thicknesses were expressed as inner retinal layer (IRL), photoreceptor layer (PL) and total retinal thickness (TRT). Measurements were taken from each of the nine sectors defined by the Early Treatment Diabetic Retinopathy Study; the center was the fovea, the inner circle (IC) was 1–3 mm away, and the outer circle (OC) was 3–6 mm away.
Results: The TRT was thickest inferiorly in the IC, and superiorly in the OC. The RNFL (P=0.030), GCL (P=0.006), IPL (P=0.006), IRL (P=0.030), PL (P<0.001) and TRT (P=0.001) were found to be thicker in males. The GCL (r=0.078, P=0.001), IPL (r=0.079, P=0.001), IRL (r=0.072, P=0.002), PL (r=0.076, P=0.001) and TRT (r=0.090, P<0.001) were found to decrease with age. The INL (r=0.060, P=0.010), ONL (r=0.078, P=0.001), and RPE (r=0.066, P=0.004) were inversely related to axial length. Excellent reproducibility was observed in all layers.
Conclusion: Our study shows differences in various retinal layers according to age, gender, and axial length. Additionally, we demonstrate excellent reproducibility of this algorithm using the Spectralis SD-OCT.
Keywords: macular mapping, retinal layers, retinal mapping
Introduction
Optical coherence tomography (OCT) allows for non-invasive, fast and high-resolution imaging of intraocular structures. Time-domain OCT (TD-OCT), the prototypical device, utilizes emission of near-infrared light in the form A-scans to collect information regarding the spatial dimensions of structures within the object of interest. Multiple A-scans are combined laterally to produce cross-sectional tomographic B-scans.1 Recently, a new generation of OCT, known as the spectral-domain OCT (SD-OCT), has become commercially available. SD-OCT combines quicker scanning times, which are 50–100 times faster than the TD-OCT, with higher resolution B-scan images; the axial resolution of the SD-OCT is 4 μm and that of the Stratus TD-OCT is 10 μm. This combination provides improved visualization of detailed retinal morphology and pathology.1
Recent advances in the SD-OCT have enabled mapping and quantification of individual retinal layers at the macula2 and optic nerve head.3 These automated measurements have been used to diagnose various ophthalmic disorders like primary open angle glaucoma,4 optic neuritis5 and retinitis pigmentosa.6 Additionally, this modality is also being evaluated for its ability to catch various systemic and neurodegenerative diseases such as autism spectrum disorder7 and multiple sclerosis.8
However, clinical application for these purposes must be informed by an understanding of normal macular anatomy and its expected variations in the general population. With this end in mind, multiple studies have used the SD-OCT to provide a normative database for individual macular layer thicknesses in varied settings such as Japan,2 Korea,9 the Netherlands10 and Spain.11 To our knowledge, this is the first study to report a normative database for individual macular layer thicknesses and their association with gender, age and axial length, in a population of South-Asian adults undergoing SD-OCT. Additionally, we measured how reproducible the measurements on each layer were. We have previously evaluated peripapillary maps,3 where we reported a problem with the algorithm, and 9 mm epithelial maps using the SD-OCT.12
Methods
This was a prospective, cross-sectional and multicenter study conducted at the two centers of Hashmanis Hospital, Karachi, Pakistan. Ethical approval was acquired from the Ethics Committee of the Hashmanis Hospital. This study was conducted in accordance with the Declaration of Helsinki, and written informed consent was obtained from all subjects prior to study inclusion. A similar study protocol was used in our previous study mapping the peripapillary layers.3
Patients who reported themselves to be ophthalmologically normal and were between the ages of 20 and 70 years were included. We randomly picked one healthy eye per patient. Study subjects underwent autorefraction (Topcon KR-800, Japan), best corrected visual acuity (BCVA) using a Snellen chart, intraocular pressure (IOP) using an air-puff tonometer (Reichert 7CR, Reichert inc., Depew, NY, USA), dilated fundus examination, slit lamp examination, axial length measurement (Wavelight OB-820, WaveLight, Erlangen, Germany), and a Spectralis SD-OCT exam (Heidelberg Engineering, Germany).
Our exclusion criteria spanned: a refraction greater than 5 diopters (D) or less than −6 D, BCVA<0.8, IOP>22 mmhg, any previous ocular surgery, history of cataract, vitreoretinal disease, visual field loss as indicated by the confrontational test, glaucoma, ocular hypertension, amblyopia, evidence of systemic disease or pregnancy. Additionally, anyone using topical or systemic medications was excluded.
An experienced OCT operator scanned each included eye after using 1% tropicamide to dilate the eye. Each patient was screened for both retinal and optic disc changes by various ophthalmologists before inclusion. Lastly, one glaucoma expert examined color fundus photographs to rule out optic disc neuropathy, optic nerve abnormality or other retinal diseases. Patients with such changes were excluded.
Measurements on SD-OCT
A regular scan protocol was utilized when scanning the eyes. Three-dimensional imaging data using dimensions of 512×496 (horizontal × vertical) axial scans per image were obtained with each scan covering a 6×6 mm2 area fixated at the posterior pole. The modified Littman’s method was utilized to obtain the correct magnification, accounting for the refractive error, corneal radius, and axial length.13 Images with a quality score of >30 were utilized and the Spectralis Family Acquisition Module 6.0.11.0 was used.
Retinal layer measurements
During an OCT exam, a beam of super luminescence diode (SLD) with a wavelength of 870 nm examines the retina and creates many cross-sectional B-scan images. These images are then automatically analyzed to create thickness measurements. A total of 768 B-scans are taken in succession, each with identical spacing, to create a three-dimensional picture.
Each scan was manually examined for appropriateness and algorithm failure; if errors were present, the scan was excluded. For example, if the lines were not corresponding to the proper retinal layers. Minor errors were corrected manually, using the built-in software. Each eye was first scanned by an operator and then rechecked by a doctor.
The thickness of each macular layer was calculated according to the nine ETDRS sectors, as shown in Figure 1. The central circle was 1 mm and was termed the fovea, the inner ring was 1–3 mm away and the outer ring was 3–6 mm away.
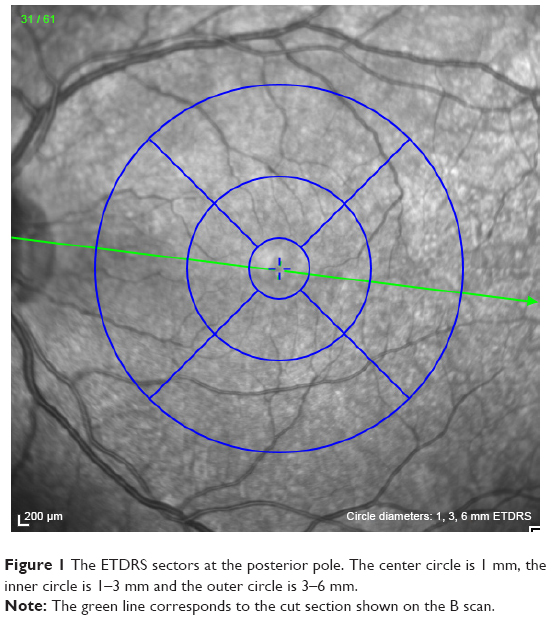 | Figure 1 The ETDRS sectors at the posterior pole. The center circle is 1 mm, the inner circle is 1–3 mm and the outer circle is 3–6 mm. |
The thicknesses of seven macular layers were recorded, as shown in Figure 2. Individual layers included retinal nerve fiber layer (RNFL), ganglion cell layer (GCL), inner plexiform layer (IPL), inner nuclear layer (INL), outer plexiform layer (OPL), outer nuclear layer (ONL) and retinal pigment epithelium (RPE). The ONL was between the OPL to the external limiting membrane (ELM, not shown in the figure). Combined retinal layers comprised the inner retinal layer (IRL), and the photoreceptor layer (PL). The IRL spanned from the internal limiting membrane (ILM) to the OPL, and the PL spanned from the ELM to the basement membrane (BM). A total retinal thickness (TRT) was also measured.
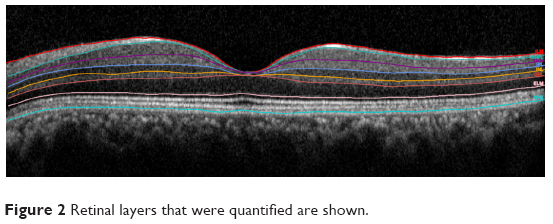 | Figure 2 Retinal layers that were quantified are shown. |
Reproducibility
Identical scan protocols were used by two OCT operators in 50 patients to assess for the interobserver reproducibility – 25 of these patients were male and 25 were female. They had a mean age of 39.0±13.0 years.
Statistical analysis
Data was collected using Google forms and was subsequently imported into the Statistical Package for the Social Sciences (SPSS) v23 (IBM Corp., Armonk, NY, USA). All data analysis was done on this software. We calculated the mean and SDs using descriptive statistics. Correlation between thickness and continuous variables, such as age and axial length, were performed using the Pearson product moment correlation coefficient. A partial correlation was performed to compute an adjusted P-value. The independent t-test was used to investigate gender differences across retinal layer thicknesses. A linear regression analysis was conducted on age and axial length. Lastly, the coefficient of variation (CV) and the intra-class correlation coefficient (ICC) were used to evaluate for interobserver reproducibility of measurements. A P-value less than 0.05 was taken to be statistically significant.
Results
Patients
Overall, 282 individuals were scanned using SD-OCT, following which 40 were excluded from the study due to the following reasons: evidence of glaucoma (n=14, 29.8%), central serous chorioretinopathy (CSCR; n=10, 21.3%), disc edema (n=5, 10.6%), algorithm failure (n=3, 6.4), optic disc changes (n=3, 6.4%), age-related macular degeneration (AMD; n=2, 4.3%), retinitis pigmentosa (n=2, 4.3%) and diabetic retinopathy (n=1, 2.1%). The remaining 242 individuals comprised 126 males (52.1%) and 116 females (47.9%). Their mean age was 40.0 years and ranged from 20 to 70 years. The baseline characteristics for the study population, stratified by age groups, are depicted in Table 1.
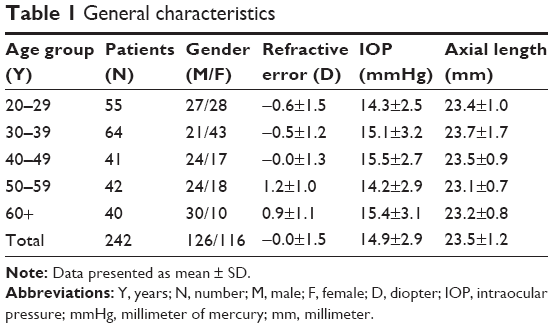 | Table 1 General characteristics |
Layer thickness
The individual retinal thicknesses corresponding to the nine ETDRS sectors are shown in Table 2. The IRL was found to be thicker in the parafoveal region and thinner in the central fovea. The IRL thickness was symmetrical in upper and lower sectors corresponding to both inner and outer circles (OCs). However, the nasal IRL was thicker than the temporal in both circles. The PL showed greatest thickness in the central fovea, which decreased in the outer regions. Lastly, the TRT was greatest in the inner circle (IC) and least in the central fovea. TRT was greater in the nasal sectors, as compared to temporal sectors, of the inner and OC.
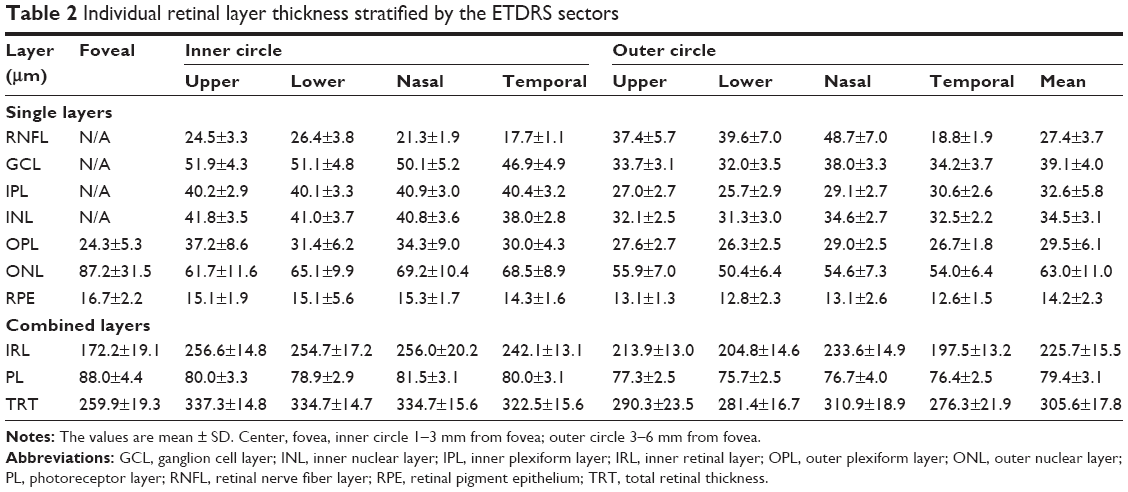 | Table 2 Individual retinal layer thickness stratified by the ETDRS sectors |
Gender
Retinal thicknesses by gender are shown in Table 3. It may be seen that the RNFL, GCL and IPL were all found to be significantly thicker in men, particularly within the parafoveal region. Consequently, the IRL was also shown to be thicker in men (P=0.030) in the same region (P=0.001). The PL was significantly thicker in men (P<0.001) in both the IC (P=0.003) and OC (P<0.001). Men were found to have a significantly greater TRT compared to women (P=0.001), especially within the IC (P<0.001).
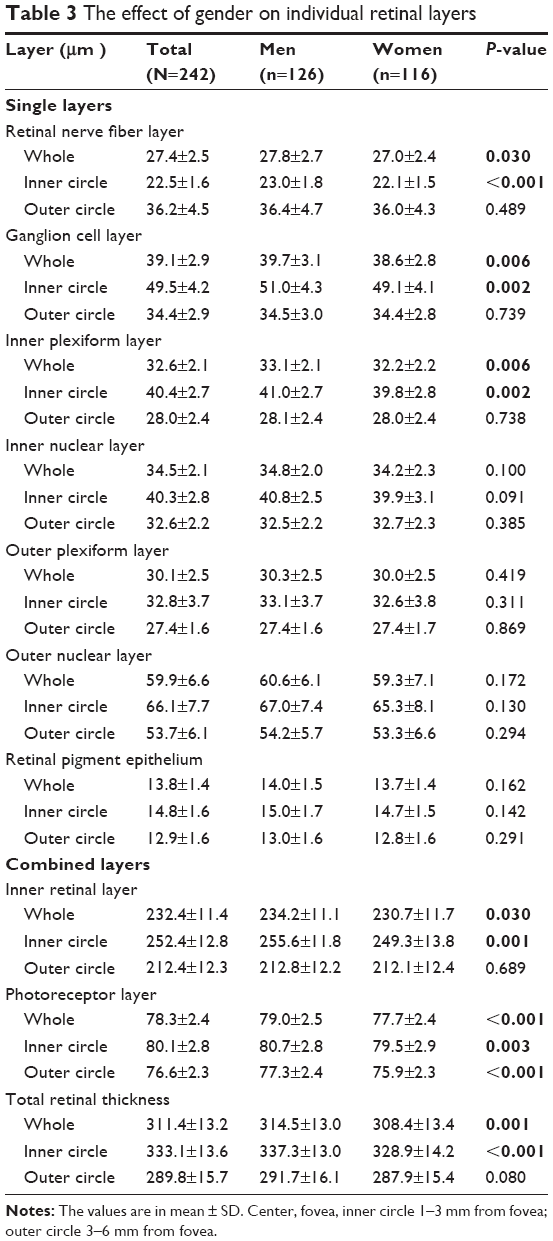 | Table 3 The effect of gender on individual retinal layers |
Age and axial length
Individual thicknesses within the GCL and IPL were negatively correlated with age across the whole retinal surface, as seen in Table 4. Thickness within the INL, OPL and ONL were negatively correlated with age in the OC only. A significant increase in RPE thickness was noted with increasing age, within the parafoveal region (P=0.011). Combined thickness within the IRL, PRL and TRT were all found to decrease with age.
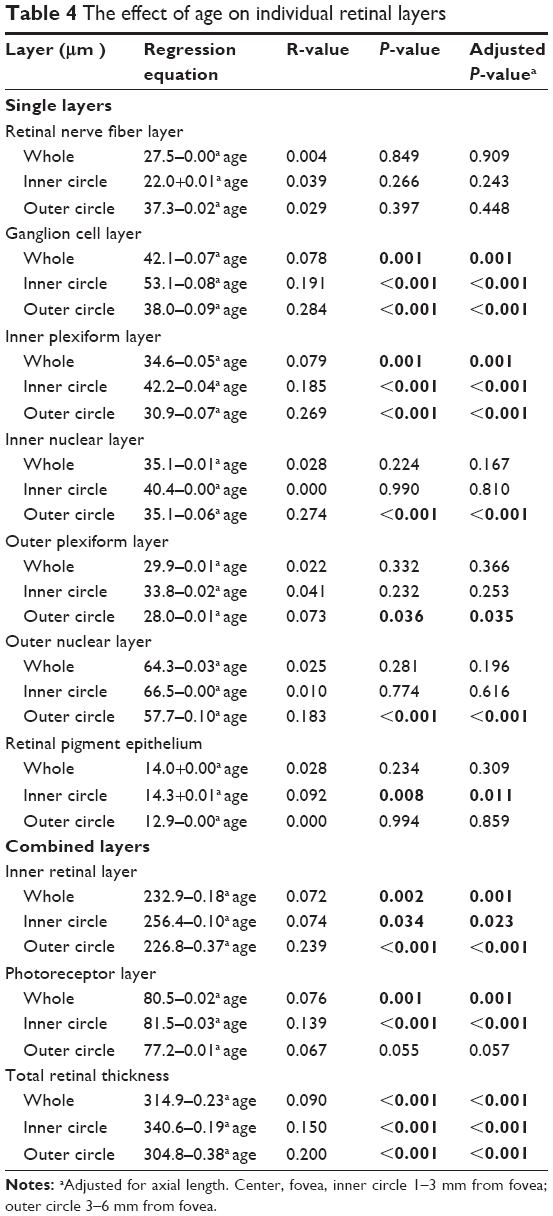 | Table 4 The effect of age on individual retinal layers |
INL, ONL and RPE thicknesses were found to be negatively correlated with axial length, as seen in Table 5.
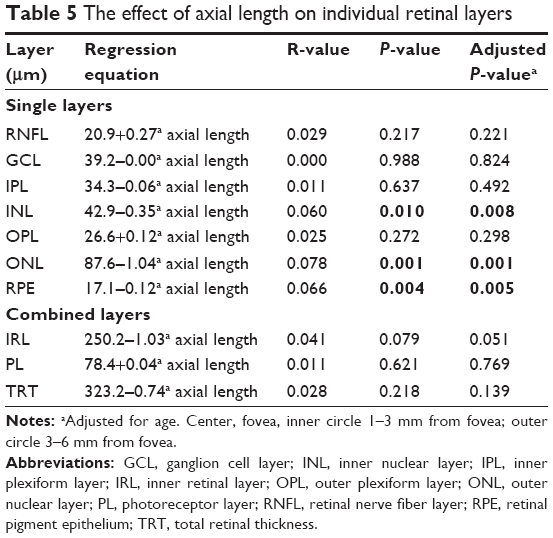 | Table 5 The effect of axial length on individual retinal layers |
Reproducibility
The CV for the central fovea ranged from 0.005 to 0.087, as seen in Table 6. For the IC and OC, the CV ranged from 0.006 to 0.078 and 0.006–0.033, respectively. Finally, for the entire circle, this value ranged from 0.006 to 0.059. The CVs were found to be highest in the ONL, consistently.
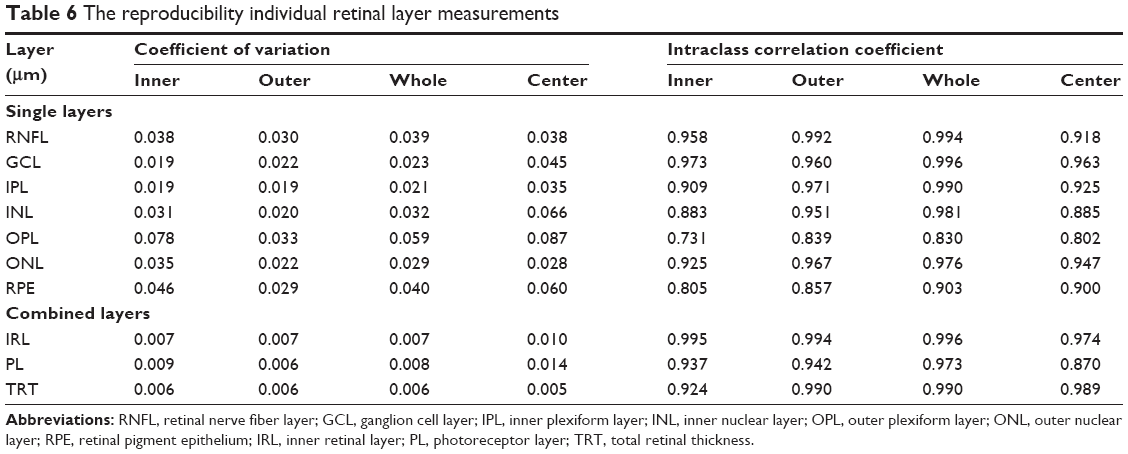 | Table 6 The reproducibility individual retinal layer measurements |
The ICC for the central fovea ranged from 0.802 to 0.989. The IC and OC ranged from 0.731 to 0.995 and 0.839 to 0.994, respectively. Finally, for the whole circle, this value ranged from 0.830 to 0.996. The ICCs were found to be the lowest for the ONL.
Discussion
Retinal thickness
Central subfield thickness (CST) measurements in our setting (259.9±19.3 μm) were consistent with those previously reported in Indian (260.1±18.19 μm) and Thai cohorts (259.18±19.08 μm) undergoing SD-OCT.14,15 In contrast, CST measurements in Saudi (244.76±23.62 μm) and Caucasian cohorts (270.2±22.5 μm) were more variable than those observed in our setting.16,17 Ethnic differences in macular thickness are well documented and highlight the importance of defining the normal variations in different populations; this may render clinically significant implications for management of macular disease.17,18
Examination of the three-dimensional contours of the macula revealed greatest thickness in the IC, minimal thickness in the central fovea and intermediate thickness in the OC which is consistent with normal anatomy. Furthermore, we observed a vertical symmetry across the nine ETDRS sectors, whereas the nasal sector was the thickest and the temporal sector the thinnest. The same has been described in previous reports.9,15–17,19,20 This trend was mirrored by individual RNFL and GCL thicknesses in both circles, illustrating the anatomic convergence of nerve fibers toward the optic disc.
Interestingly, both INL and OPL layers also followed a similar trend, thus reaffirming previous reports that densities of bipolar cells, amacrine cells, horizontal cells and Muller cells may correspond to regions of greater GCL density.2,9 Ooto et al and Won et al also observed greater GCL, and INL thickness within the nasal sector of the IC, however they found this difference to be attenuated within the OC.2,9 In contrast, our experience showed similar findings within both IC and OC. Thickness of PL was most concentrated within the central fovea, and progressively decreased outward; as consistent with normal anatomy.
Differences by gender
Comparison of retinal layers by sex showed men to have significantly thicker RNFL, GCL, IPL and PL. Consequently, men were seen to have a greater overall TRT than women. These findings are in line with previous reports documenting a greater overall macular thickness in men primarily within the central fovea, where the PL predominates, and IC, where the IRLs predominate.15,16,19,21–23 Furthermore, Won et al’s layer analysis agreed with our findings, however, they found a greater ONL thickness in females.9
Not everyone agrees, though. Ooto et al reported a greater macular thickness in men within the INL and OPL + ONL; however, they found no significant difference between the GCL, and the inner and outer photoreceptor segments.2 Further, their study noted women to have a thicker RNFL, as opposed to our results. An association between iron-deficiency anemia and decreased RNFL thickness has been described;24 in Pakistan, it has been shown that the prevalence of iron deficiency anemia in females can be up to 50%.25 Therefore, it would be interesting to investigate whether regional discrepancies in macular thickness according to gender are reflective of normal, ethnic variations or nutrient deficiencies.
Age- and axial length-related changes
Previous reports have shown progressive thinning of the parafoveal and peripheral retina with age; however, no such change has been observed at the fovea.14,16,19,21,23 Our findings illustrate the underlying changes in individual retinal layers responsible for these topographical differences. With advancing age, significant thinning of the IRLs including GCL and IPL occurred over the whole macula, whereas thinning of INL, OPL and ONL were restricted to the OC. Previous, studies have mirrored age-related decreases in extrafoveal GCL, IPL and INL; however, they have also reported significant thinning of RNFL with age, whereas we observed no such trend.2,9,10 This may be attributable to the relatively slower age-related thinning of the RNFL (~0.2% per year), as opposed to that of other inner retinal neurons (~0.3%–0.6% per year).2
In this study, age was associated with thinning of OPL and ONL in the OC only, overall thinning of PL and thickening of RPE within the IC. These findings are consistent with those of previous SD-OCT analysis of age-related thinning of macular layers,2,10 and related histological studies of thickening in the RPE.26
We found INL, ONL and RPE epithelium to be negatively correlated with age-adjusted axial length, particularly within the peripheral macula. This explains why in previous studies there was thinning of average outer macular and average whole macular thicknesses.15,19,23 Our results are consistent with those of Szigeti et al, who found that whole INL, peripheral OPL and whole ONL to be negatively correlated with axial length which supports the notion that intermediate layers of the macula are particularly prone to shearing and stretching forces.27
Reproducibility
This study demonstrates excellent reproducibility of the algorithm for various layers of the macula. Several studies agree with these findings.2,28 However, we have previously highlighted problems with the Spectralis SD-OCT machine algorithm when mapping the peripapillary retina; the ICs were poorly reproducible for almost all layers.3 Therefore, caution must be advised when using these algorithms in clinical settings.
Limitations
Limitations of this study include its restricted selection of Pakistani adults without high myopia, as such our findings may not be broadly generalizable, as macular layer thicknesses are known to be influenced by different levels of myopia. Secondly, the effects of nutrient deficiencies, like iron deficiency anemia, could not be accounted for which may be acting as confounders. Thirdly, the distribution of genders through the various age groups may have influenced some of the age-related measurements. Lastly, we used only the Spectralis SD-OCT machine to determine the various thicknesses and the data may not be applicable to other OCT systems.
Conclusion
Our study shows that gender, age and axial length exert significant and specific effects across the seven retinal layers identified. Additionally, we found excellent reproducibility of this segmentation algorithm using the Spectralis SD-OCT across the various layers.
Acknowledgments
We would like to thank Mr Faisal Ahmed, Ms Samreen Jahangir and Mr Faraz Haroon for their invaluable help in data collection. Secondly, we would like to acknowledge Dr Azfar Nafees Hanfi’s help in reviewing the fundus photographs. Lastly, we would like to thank the Hashmanis Foundation for funding this research.
Disclosure
The authors report no conflicts of interest in this work.
References
Murthy RK, Haji S, Sambhav K, Grover S, Chalam KV. Clinical applications of spectral domain optical coherence tomography in retinal diseases. Biomed J. 2016;39(2):107–120. | ||
Ooto S, Hangai M, Tomidokoro A, et al. Effects of age, sex, and axial length on the three-dimensional profile of normal macular layer structures. Invest Ophthalmol Vis Sci. 2011;52(12):8769–8779. | ||
Hashmani N, Hashmani S. Three-dimensional mapping of peripapillary retinal layers using a spectral domain optical coherence tomography. Clin Ophthalmol. 2017;11:2191–2198. | ||
Alasbali T, Lofty NM, Al-Gehaban S, Al-Sharif A, Al-Kuraya H, Khandekar R. Macular ganglion cell-inner plexiform layer and retinal nerve fiber layer thickness in eyes with primary open-angle glaucoma compared with healthy Saudi eyes: a cross-sectional study. Asia Pac J Ophthalmol. 2016;5(3):196–201. | ||
Corajevic N, Larsen M, Rönnbäck C. Thickness mapping of individual retinal layers and sectors by Spectralis SD-OCT in autosomal dominant optic atrophy. Acta Ophthalmol. 2018;96(3):251–256. | ||
Witkin AJ, Ko TH, Fujimoto JG, et al. Ultra-high resolution optical coherence tomography assessment of photoreceptors in retinitis pigmentosa and related diseases. Am J Ophthalmol. 2006;142(6):945–952. | ||
García-Medina JJ, García-Piñero M, del-Río-Vellosillo M, et al. Comparison of foveal, macular, and peripapillary intraretinal thicknesses between autism spectrum disorder and neurotypical subjects. Invest Ophthalmol Vis Sci. 2017;58(13):5819–5826. | ||
Walter SD, Ishikawa H, Galetta KM, et al. Ganglion cell loss in relation to visual disability in multiple sclerosis. Ophthalmology. 2012;119(6):1250–1257. | ||
Won JY, Kim SE, Park YH. Effect of age and sex on retinal layer thickness and volume in normal eyes. Medicine. 2016;95(46):e5441. | ||
Demirkaya N, van Dijk HW, van Schuppen SM, et al. Effect of age on individual retinal layer thickness in normal eyes as measured with spectral-domain optical coherence tomography. Invest Ophthalmol Vis Sci. 2013;54(7):4934–4940. | ||
Nieves-Moreno M, Martínez-de-La-Casa JM, Cifuentes-Canorea P, et al. Normative database for separate inner retinal layers thickness using spectral domain optical coherence tomography in Caucasian population. PLoS One. 2017;12(7):e0180450. | ||
Hashmani N, Hashmani S, Saad CM. Wide corneal epithelial mapping using an optical coherence tomography. Invest Ophthalmol Vis Sci. 2018;59(3):1652–1658. | ||
Bennett AG, Rudnicka AR, Edgar DF. Improvements on Littmann’s method of determining the size of retinal features by fundus photography. Graefes Arch Clin Exp Ophthalmol. 1994;232(6):361–367. | ||
Appukuttan B, Giridhar A, Gopalakrishnan M, Sivaprasad S. Normative spectral domain optical coherence tomography data on macular and retinal nerve fiber layer thickness in Indians. Indian J Ophthalmol. 2014;62(3):316–321. | ||
Choovuthayakorn J, Watanachai N, Chaikitmongkol V, Patikulsila D, Kunavisarut P, Ittipunkul N. Macular thickness measured by spectral-domain optical coherence tomography in healthy Thai eyes. Jpn J Ophthalmol. 2012;56(6):569–576. | ||
Al-Zamil WM, Al-Zwaidi FM, Yassin SA. Macular thickness in healthy Saudi adults. A spectral-domain optical coherence tomography study. Saudi Med J. 2017;38(1):63–69. | ||
Grover S, Murthy RK, Brar VS, Chalam KV. Normative data for macular thickness by high-definition spectral-domain optical coherence tomography (Spectralis). Am J Ophthalmol. 2009;148(2):266–271. | ||
Girkin CA, McGwin G, Sinai MJ, et al. Variation in optic nerve and macular structure with age and race with spectral-domain optical coherence tomography. Ophthalmology. 2011;118(12):2403–2408. | ||
Gupta P, Sidhartha E, Tham YC, et al. Determinants of macular thickness using spectral domain optical coherence tomography in healthy eyes: the Singapore Chinese Eye study. Invest Ophthalmol Vis Sci. 2013;54(13):7968–7976. | ||
Chan A, Duker JS, Ko TH, Fujimoto JG, Schuman JS. Normal macular thickness measurements in healthy eyes using Stratus optical coherence tomography. Arch Ophthalmol. 2006;124(2):193–198. | ||
Duan XR, Liang YB, Friedman DS, et al. Normal macular thickness measurements using optical coherence tomography in healthy eyes of adult Chinese persons: the Handan Eye Study. Ophthalmology. 2010;117(8):1585–1594. | ||
Çubuk M, Kasim B, Koçluk Y, Sukgen EA. Effects of age and gender on macular thickness in healthy subjects using spectral optical coherence tomography/scanning laser ophthalmoscopy. Int Ophthalmol. 2018;38(1):127–131. | ||
Song WK, Lee SC, Lee ES, Kim CY, Kim SS. Macular thickness variations with sex, age, and axial length in healthy subjects: a spectral domain-optical coherence tomography study. Invest Ophthalmol Vis Sci. 2010;51(8):3913–3918. | ||
Cikmazkara I, Ugurlu SK. Peripapillary retinal nerve fiber layer thickness in patients with iron deficiency anemia. Indian J Ophthalmol. 2016;64(3):201–205. | ||
Akhtar S, Ahmed A, Ahmad A, Ali Z, Riaz M, Ismail T. Iron status of the Pakistani population-current issues and strategies. Asia Pac J Clin Nutr. 2013;22(3):340–347. | ||
Bonilha VL. Age and disease-related structural changes in the retinal pigment epithelium. Clin Ophthalmol. 2008;2(2):413–424. | ||
Szigeti A, Tátrai E, Varga BE, et al. The effect of axial length on the thickness of intraretinal layers of the macula. PLoS One. 2015;10(11):e0142383. | ||
Hirasawa H, Araie M, Tomidokoro A, et al. Reproducibility of thickness measurements of macular inner retinal layers using SD-OCT with or without correction of ocular rotation. Invest Ophthalmol Vis Sci. 2013;54(4):2562–2570. |
 © 2018 The Author(s). This work is published and licensed by Dove Medical Press Limited. The
full terms of this license are available at https://www.dovepress.com/terms
and incorporate the Creative Commons Attribution
- Non Commercial (unported, 3.0) License.
By accessing the work you hereby accept the Terms. Non-commercial uses of the work are permitted
without any further permission from Dove Medical Press Limited, provided the work is properly
attributed. For permission for commercial use of this work, please see paragraphs 4.2 and 5 of our Terms.
© 2018 The Author(s). This work is published and licensed by Dove Medical Press Limited. The
full terms of this license are available at https://www.dovepress.com/terms
and incorporate the Creative Commons Attribution
- Non Commercial (unported, 3.0) License.
By accessing the work you hereby accept the Terms. Non-commercial uses of the work are permitted
without any further permission from Dove Medical Press Limited, provided the work is properly
attributed. For permission for commercial use of this work, please see paragraphs 4.2 and 5 of our Terms.