Back to Journals » Clinical Interventions in Aging » Volume 20
Assessing Lumbar Spine Microstructure in Osteoporosis Using IVIM-DWI and IDEAL-IQ Sequences
Authors Shi Z, Hu L, Su D, Yang Z, Liu W, Yuan K, Wang T, Cui Z, Qin J, Zhang Y
Received 17 May 2025
Accepted for publication 14 September 2025
Published 20 September 2025 Volume 2025:20 Pages 1635—1646
DOI https://doi.org/10.2147/CIA.S541103
Checked for plagiarism Yes
Review by Single anonymous peer review
Peer reviewer comments 2
Editor who approved publication: Prof. Dr. Nandu Goswami
Zhaojuan Shi,1 Lingdong Hu,2 Datian Su,1 Zhe Yang,1 Weiwei Liu,1 Kemei Yuan,1 Tiantian Wang,1 Zhaoping Cui,1 Jian Qin,1 Yue Zhang1
1Department of Radiology, The Second Affiliated Hospital of Shandong First Medical University, Tai’an, Shandong, 271000, People’s Republic of China; 2Department of Medicine, Tai’an Disabled Soldiers’ Hospital of Shandong Province, Tai’an, Shandong, 271000, People’s Republic of China
Correspondence: Jian Qin, Department of Radiology, The Second Affiliated Hospital of Shandong First Medical University, No. 366 Taishan Street, Tai’an City, Shandong Province, 271000, People’s Republic of China, Tel +86 0538-6238002, Email [email protected] Yue Zhang, Department of Radiology, The Second Affiliated Hospital of Shandong First Medical University, No. 366 Taishan Street, Tai’an City, Shandong Province, 271000, People’s Republic of China, Tel +86 0538-6238002, Email [email protected]
Background: Currently, dual-energy X-ray absorptiometry (DEXA) and quantitative CT (QCT) are commonly used in clinical practice to measure bone mineral density (BMD), offering diagnostic value but involving radiation and inability to visualize bone microstructure. This study aims to assess lumbar spine bone microstructure changes in normal, osteopenic, and osteoporotic groups using IVIM-DWI and IDEAL-IQ sequences to provide useful information for clinical practice.
Methods: A total of 346 patients (50– 87 years, 232 females, 114 males) underwent spinal DEXA and MRI. Based on the BMD obtained from DEXA, the patients were stratified into: normal (n=79), osteopenia (n=92), and OP (n=175) groups. Then to evaluated the results of IVIM-DWI and IDEAL-IQ and extracted quantitative parameters from regions of interest covering the L1 to L4 vertebrae. Group comparisons used One-way analysis of variance and the Kruskal‒Wallis H-test. Receiver operating characteristic (ROC) and Spearman’s analyses evaluated diagnostic performance and correlations.
Results: Significant differences existed in the ADCslow, f, FF and R2* between groups (P< 0.05). BMD was weakly positively correlated with ADCslow, f, and R2* (r=0.494, 0.153, 0.182, 0.029, P< 0.001) but a negative correlation with FF (r=− 0.402, P< 0.001). BMD and the ADCslow and R2* decreased but FF increased with age (P< 0.05 for all), whereas no significant association existed between age and ADCfast or f value (P> 0.05). FF had the highest areas under the curve (AUCs) (0.624, 0.831 and 0.747) and sensitivity (72.2%, 70.9% and 81.5%) in differentiating normal from osteopenia patients, normal from osteoporosis patients, and osteopenia from osteoporosis patients, respectively. ADCslow and f had the highest specificity (88%) in differentiating between normal and osteopenia patients, while ADCslow had the highest specificity (91.4%) in differentiating between normal and osteoporosis patients.
Conclusion: Quantitative parameters extracted from IVIM-DWI and IDEAL-IQ have the potential to become good biomarkers for diagnosing OP.
Keywords: IVIM-DWI, IDEAL-IQ, Quantitative evaluation, Osteoporosis
Introduction
Osteoporosis (OP) is a systemic bone metabolic disease associated with a decrease in bone mineral content and changes in the bone microstructure, which easily lead to increased bone fragility and fractures.1 The incidence of OP increases with age, especially among postmenopausal women.2 The prevalence of osteoporosis among those aged 50 and above is 19.2% (32.1% for women and 6.0% for men). Among those aged 65 and above, the prevalence reaches 32.0% (51.6% for women and 10.7% for men). The most severe consequence of osteoporosis is fragility fractures. Data shows that in 2010, there were 2.33 million patients with fragility fractures in our country, and it is predicted that by 2050, this number will reach 5.99 million. Approximately 20% of elderly hip fracture patients die within one year due to various complications, and about 50% of patients become disabled.3,4 Therefore,early diagnosis and intervention are the core link in breaking the vicious cycle of “osteoporosis-fracture- disability”. Especially in the early stage of osteoporosis or the phase of reduced bone mass, timely intervention,when the bone microstructure is not yet completely damaged,is the key to preserving bone strength.
At present, the diagnosis, risk prediction and treatment efficacy evaluation of OP can all be obtained through imaging examinations, such as X-ray imaging, CT, MRI, dual energy X-ray absorptiometry (DEXA) and quantitative CT (QCT).5,6 X-ray imaging is commonly used for diagnosing osteoporotic vertebral fractures, but it may fail to reveal small fractures of the vertebral body. Furthermore, although CT is more sensitive in the detection of subtle fractures, the patient undergoing CT is exposed to higher levels of radiation exposure. MRI can reveal early changes in the bone marrow without the use of radiation. However, these methods are unable to accurately measure bone mass.
Currently, the most commonly used methods for diagnosing OP involve measurement of bone mineral density (BMD) with DEXA and QCT. DEXA is the more widely used method, but its results are affected by many factors, such as the presence of vertebral fracture and vascular calcification, which can lead to unexpected bias in the results.7 QCT measures BMD through the use of clinical CT scanning data combined with a quality control and analysis system.8 However, although it is the more accurate than DEXA in measuring BMD and avoids interference from the abovementioned factors,9 it is rarely used in clinical practice because of the high potential for radiation exposure.10,11
Improvements in MRI functional sequences have led to the employment of MRI fat measurement as a new method for evaluating OP,12 as it can not only reveal changes in bone morphology in patients with the disease but also be used to evaluate dynamic changes in the bone microenvironmental structure, including components such as bone marrow, vasculature, mineralization, and water.13–15 The iterative decomposition of water and fat with echo asymmetry and least squares estimation quantitation (IDEAL-IQ) sequence is an MRI-based imaging method that can noninvasively quantify fat content and iron deposition in the bone marrow; thus, it is considered a promising imaging method for diagnosing OP.16,17 Intravoxel incoherent motion diffusion weighted imaging (IVIM-DWI), meanwhile, can be used to obtain information on the diffusion and movement of water molecules in living tissues and reflect blood flow perfusion in capillary networks. Some previous studies have shown that it performs well in differentially diagnosing benign and malignant vertebral compression fractures.18 IVM-DWI and IDEAL-IQ have overcome the limitations of traditional BMD measurement in osteoporosis diagnosis. It can reveal changes in bone microstructure at the molecular motion and bone marrow component levels, providing new molecular-level insights. However, their clinical application is constrained by technical complexity and the lack of standardization. Therefore, we investigated the changes in the quantitative parameters of the bone microstructure of the lumbar spine in healthy, osteopenic and osteoporotic patients with IVIM-DWI and IDEAL-IQ with the expectation of providing useful information for clinicians.
Materials and Methods
This study was approved by the institutional ethics committee of the Second Affiliated Hospital of Shandong First Medical University,with IRB approval number 2020–035. Patients provided written consent for participation in this analysis. Informed consent was obtained from each patient before the study.
Study Population
The data of a total of 370 subjects were included between January 2020 and September 2022. The inclusion criteria were as follows: (1) female or male sex and age over 50 years and (2) DEXA and MRI examinations performed within one week. The exclusion criteria were as follows based on detailed medical history collection, physical examination, laboratory and imaging examinations: (1) parathyroid diseases, severe diabetes, vertebral tuberculosis, multiple myeloma or other malignant tumors, or other abnormal bone metabolism disorders; (2) use of medicines that can affect bone metabolism, such as glucocorticoids, estrogen or androgen; (3) poor MR image quality, such as the presence of severe artifacts, making image postprocessing difficult. Finally, the data of 346 patients, including 232 females and 114 males, were included in the final analysis. The average age of the patients was 67.69±7.94 years (range, 50–87 years).
DEXA Examination
DEXA measurements were performed using the Hologic QDR 4500-W bone density scanner (USA: Hologic), equipped with version 9.03 software. The spinal phantom was calibrated before each daily scan. The zipper, belt, plaster, button and other items on the patients are removed to avoid producing artifact images and compromising the accuracy of the measurement results before the examination. If there is obvious hyperplasia or osteophytes, pseudofractures, bone cement, prosthesis, etc, in the vertebral body, the regions of interest (ROIs) should be manually removed to ensure accuracy. Finally, the T value of the lumbar spine (L1-L4), bone density of the hip joint and femoral neck (g/cm²) were derived after post-processing. All patients were divided into three groups according to the WHO standard for osteoporosis:19 the normal group (T score≥−1.0 SD), the osteopenia group (−2.5 SD<T score<−1.0 SD), and the osteoporosis group (Tscore≥−2.5 SD). Patients with nontraumatic vertebral fractures were included in the osteoporosis group irrespective of the T score.
MRI Examination
All MRI examinations were performed on a 3.0 T MRI scanner (Discovery MR750,GE Healthcare, Milwaukee, WI, USA) with a coil for the lumbar spine. All patients wore a bellyband to reduce respiratory artifacts during the MRI scans. The MRI sequences included T1- and T2-weighted fast spin echo (FSE), IVIM-DWI and IDEAL-IQ sequences.
The parameters for the sagittal T1-weighted FSE imaging were as follows: repetition time (TR)=569 ms; echo time (TE)=Min Full; spacing=0.5 mm; slice thickness=4 mm; number of excitations (NEX)=4; and field of view(FOV)=320×320 mm. The sagittal T2-weighted FSE imaging parameters were as follows: TR=2500 ms; TE=120 ms; spacing=0.5 mm; slice thickness=4 mm; NEX=2; and FOV=320×320 mm. The sagittal T2-weighted FSE imaging parameters were as follows: TR=3000 ms; TE=102 ms; spacing=0.5 mm; slice thickness=4 mm; NEX=4; and FOV=200×200 mm. Sagittal IVIM-DWI images were acquired with the single-shot echo-planar imaging (ss-EPI)method and the following parameters: TR=4000 ms; TE=minimum; spacing=0.5 mm; slice thickness=4 mm; b values=0, 50, 100, 150, 200, 400, 600, 800, and 1200 s/mm2; NEX=2, 2, 2, 2, 2, 2, 4, 6, and 8; and FOV=320×320 mm. Sagittal IDEAL-IQ imaging was performed with the following parameters: TR=7.7 ms; TE=Min Full; spacing=0.5 mm; slice thickness=10 mm; NEX=0.5; and FOV=250×250 mm.
Image Analysis
All assessments were performed in a blinded manner by two musculoskeletal radiologists with 5 and 10 years of experience. All the data were transferred to a workstation (Advantage Windows Workstation 4.6; GE Healthcare, US) and then postprocessed. A region of interest (ROI) was placed from the L1 to L4 vertebrae at the central level on the sagittal images to extract the parameters described below. The ROI was made as large as possible to encompass the entire cancellous bone while maintaining a consistent range and position among the imaging maps for measuring the different parameters and avoiding areas of motion artifacts, the cortical bone of the vertebral body, focal lesions, the venous plexus, and the spinal canal (Figure 1). For this study, we chose to analyze the parameters fat fraction (FF) and R2*obtained from the IDEAL-IQ sequence images, and the slow (ADCslow) and fast apparent diffusion coefficients (ADCfast) and the perfusion fraction (f), obtained from the IVIM-DWI sequence images.
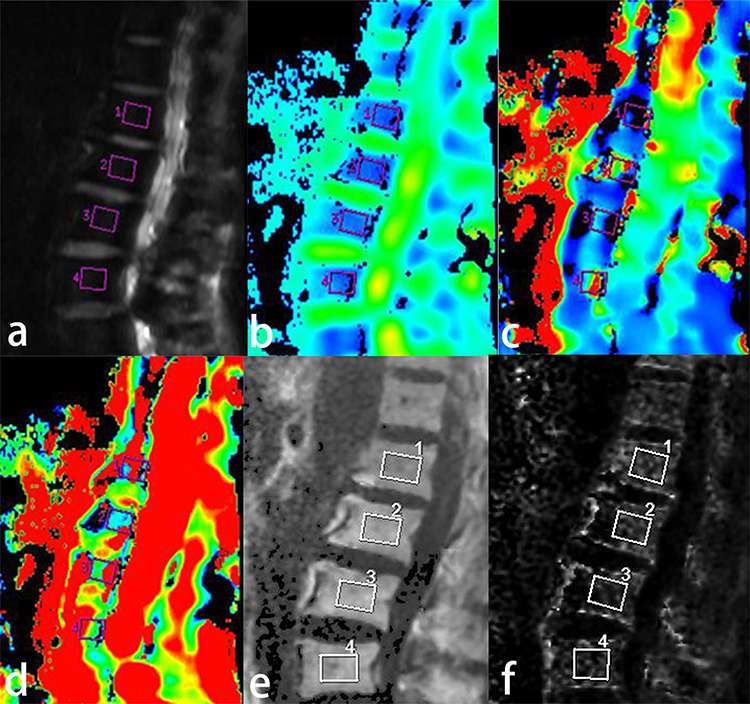 |
Figure 1 The DWI (a), ADCslow (b), ADCfast (c), f(d) of IVIM-DWI and FF (e), R2* (f) of IDEAL-IQ parameter maps of lumbar bone marrow. The pink and white rectangular areas show the regions of interest for measurements. |
Statistical Analysis
SPSS 25.0 (IBM) software was used for the statistical analysis, and a two-sided p<0.05 was considered significant. For all parameters, the Kolmogorov‒Smirnov (KS) test was used to assess the normality of the data distributions, and the Levene test was used to assess homogeneity of variance. All normally distributed data are presented as the means±standard deviations (x±s); the independent-sample t test was used for between-group comparisons, whereas one-way ANOVA for three-group comparisons. All nonnormally distributed data are presented as medians and interquartile ranges. The Mann‒Whitney test was used for between-group comparisons, and the Kruskal‒Wallis H-test was used for multiple-group comparisons. Spearman correlation coefficients were calculated to analyze the correlations between the different parameters and BMD values. MedCalc (version 20.210) software was used to analyze parameters with statistical significance and compare the diagnostic efficacy, optimal diagnostic threshold, sensitivity, and specificity of the parameters.
Results
Patient Characteristics and MRI Parameters
A total of 346 patients were included in this study, including 79 patients with normal bone mass (35 males, 44 females; mean age 59.14±5.31 years; age range (50–72 years), 92 patients with osteopenia (37 males, 55 females; mean age 58.35±4.99 years; age range 50–70 years) and 175 patients with osteoporosis (42 males, 133 females; mean age 68.56±7.15 years; age range 50–87 years).
The clinical and MRI parameters of all the subjects are described in Table 1. There were significant differences in all the imaging parameters except for ADCfast among the three groups. According to the results of post hoc analysis of the quantitative MRI parameters that were significantly different among the three groups, none of the parameters aside from FF were significantly different between the normal and osteopenia groups (P>0.05). However, all parameters were significantly different between the normal and osteoporosis groups and between the osteopenia and osteoporosis groups (P<0.05) (Table 2 and Figure 2).
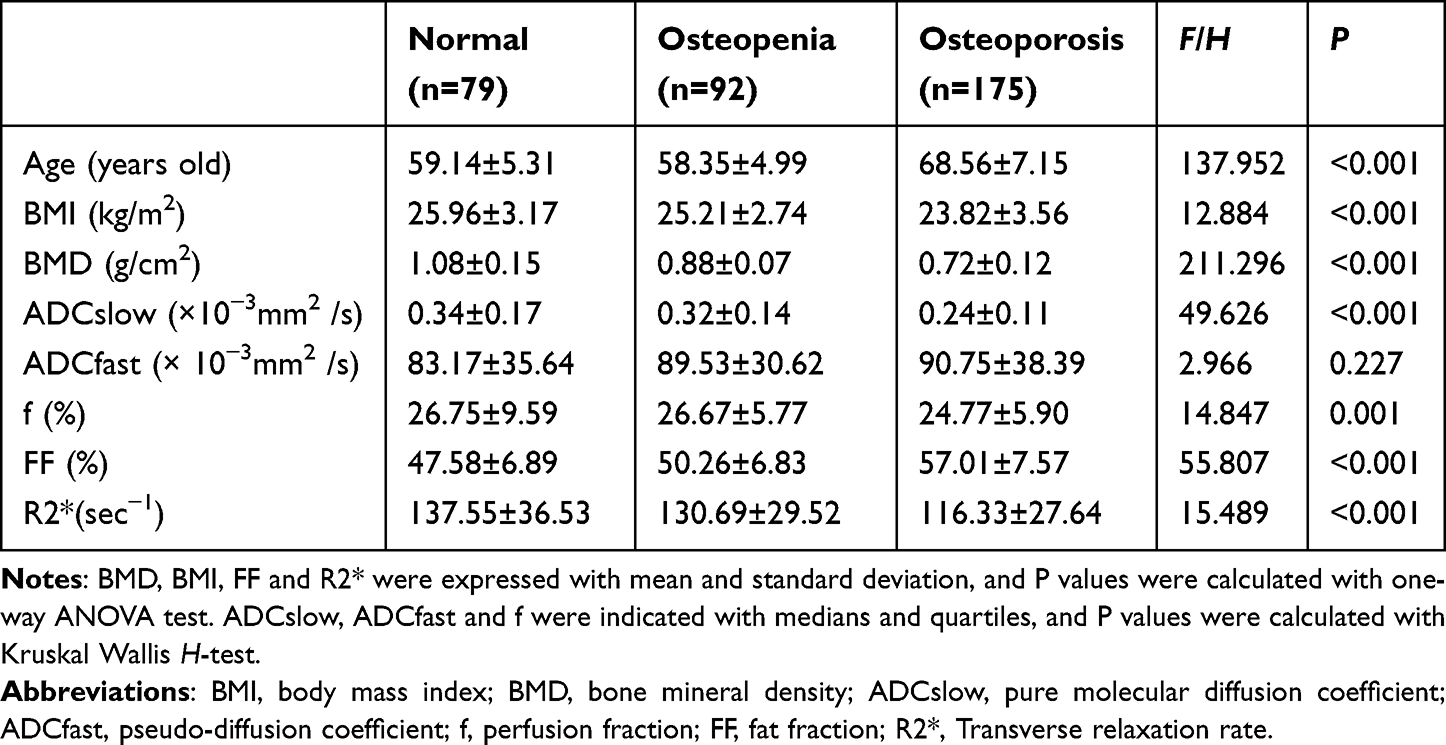 |
Table 1 Clinical and MRI Parameters of All Subjects in Different Group |
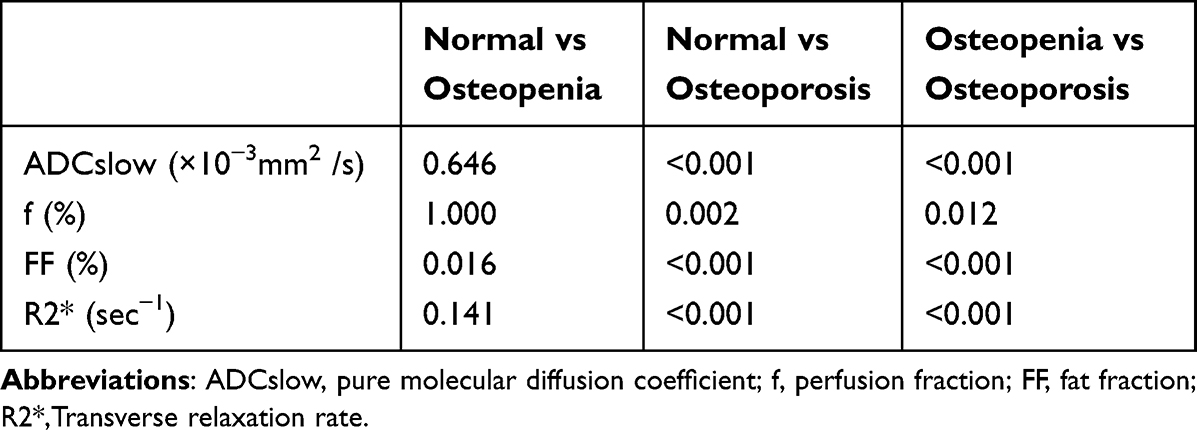 |
Table 2 Post Hoc Tests of MRI Parameters Between Different BMD Groups |
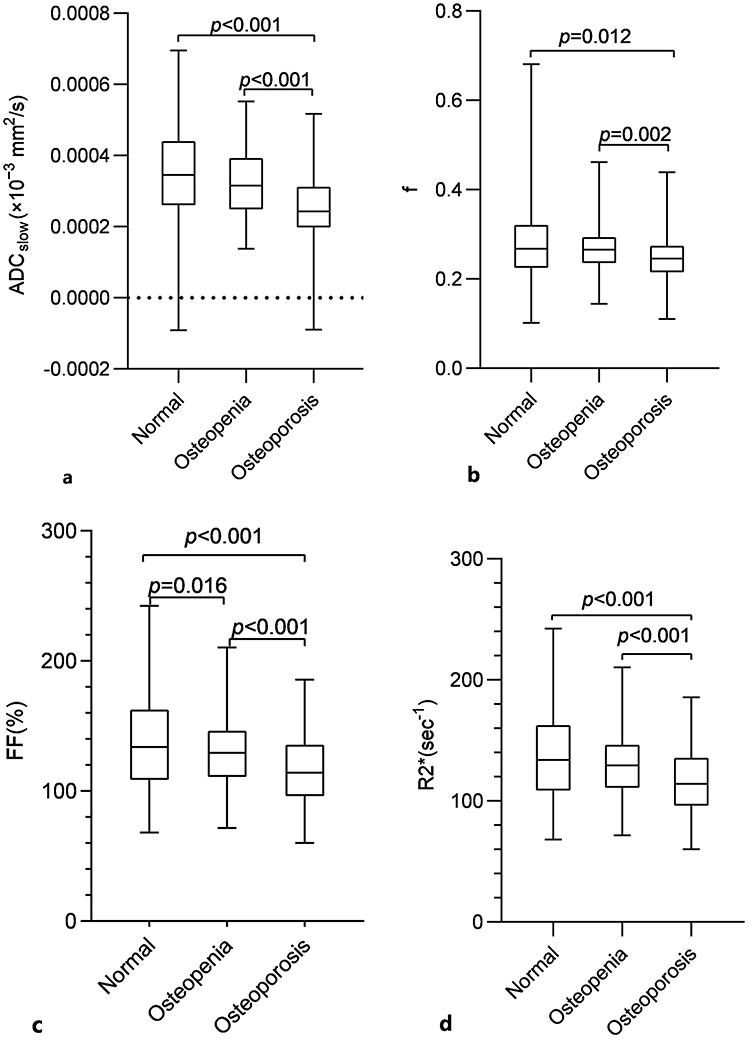 |
Figure 2 Boxplot analysis of ADCslow (a), f(b), FF (%) (c), R2* (d) values in three groups of the normal, osteopenia, and osteoporosis. Post hoc test confirmed the differences between different groups of each parameter respectively. |
Comparative Analysis of Clinical Indicators and MRI Parameters According to Age
According to the results of the Kruskal‒Wallis H-test, the values of BMI, BMD, ADCslow, and R2* significantly and gradually decreased and those of FF significantly and gradually increased with age (P<0.05), whereas the changes in the ADCfast and f values among the different age groups were not significant (P>0.05) (Table 3).
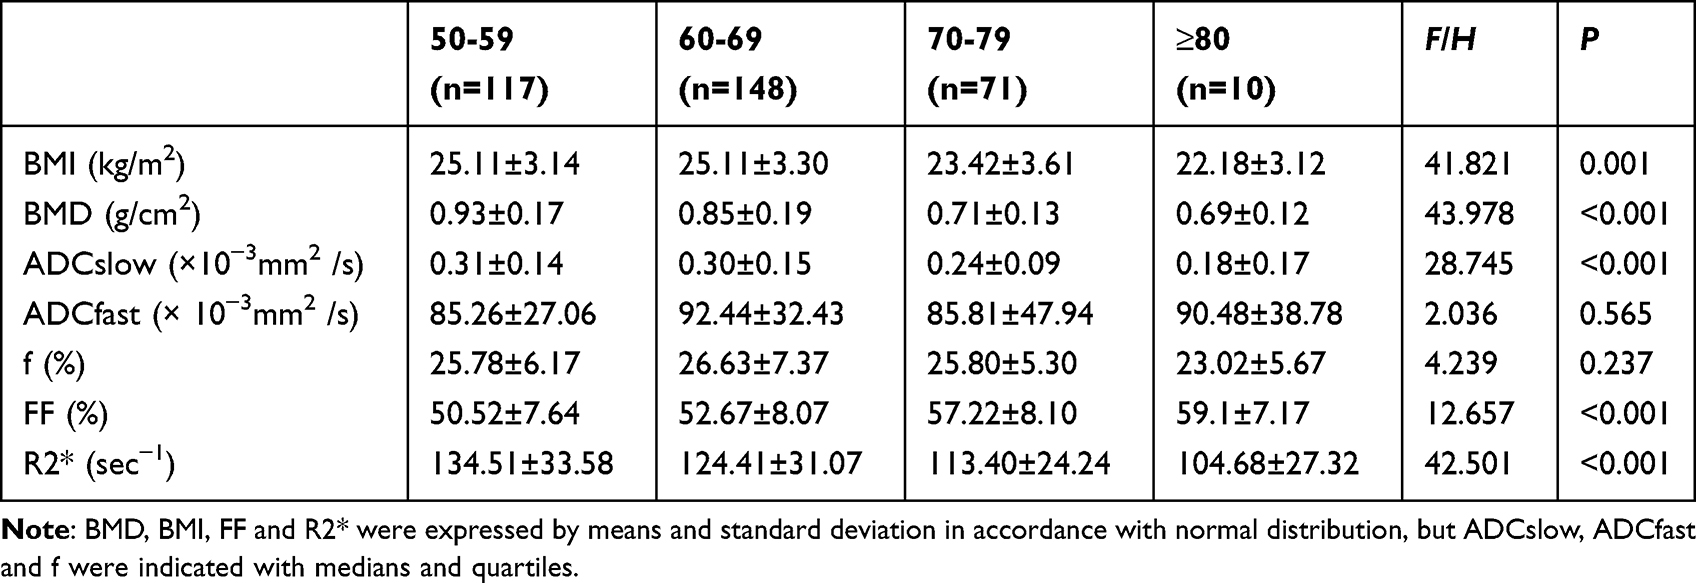 |
Table 3 Comparison of Clinical Indicators and MRI Parameters in Different Age Groups |
Comparison of Clinical Indicators and MRI Parameters According to Sex
As shown in Table 4, there were no significant differences in age, BMI, ADCfast, f or water values between males and females (P>0.05); however, the BMD, ADCslow, FF and R2* values were significantly different (P<0.05). The FF values were greater in females than in males, while the values of BMD and R2* were greater in males than in females.
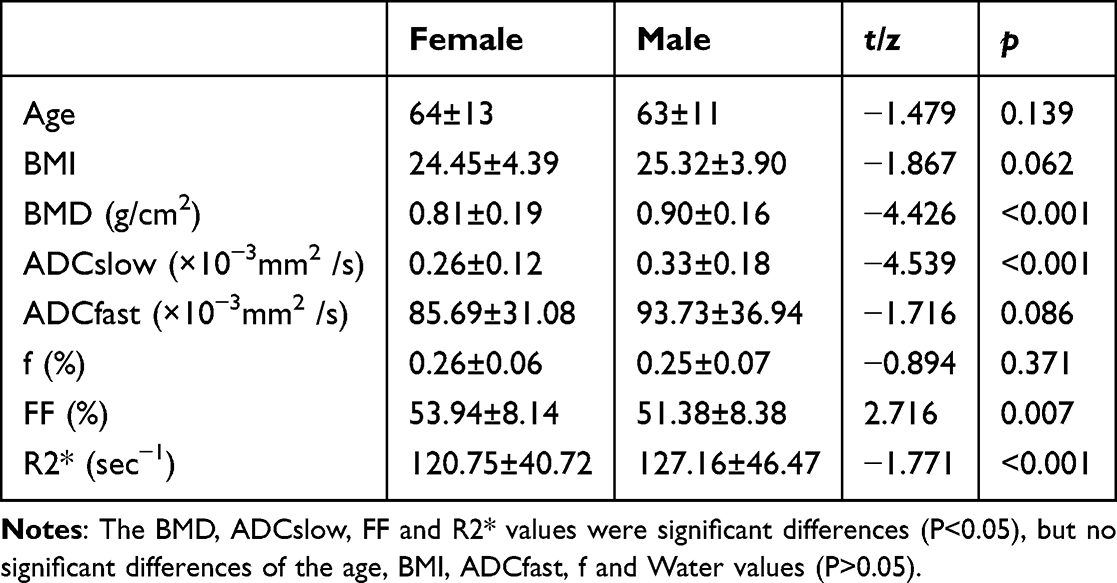 |
Table 4 Comparison of Clinical and MRI Indicators in Different Gender Group |
Partial Correlation Analysis Between BMD Values and MRI Parameters
Table 5 and Figure 3 present the results of a partial correlation analysis between the MRI parameters and BMD. BMD was weakly positively correlated with ADCslow, f, and R2* (r=0.494, 0.153, 0.182, 0.029, P < 0.001) and negatively correlated with FF (r=−0.402, P < 0.001).
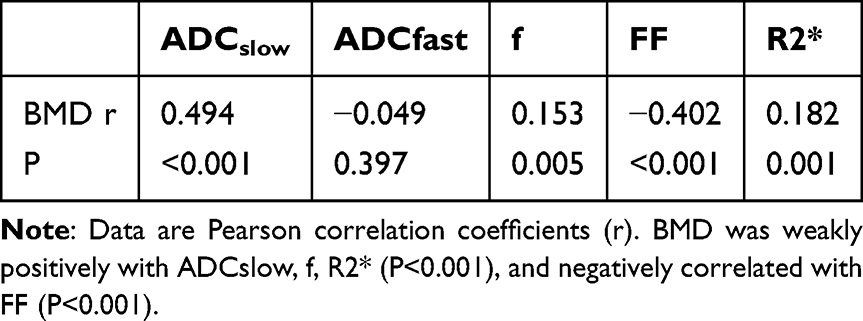 |
Table 5 Partial Correlation Analysis BMD and MRI Parameters |
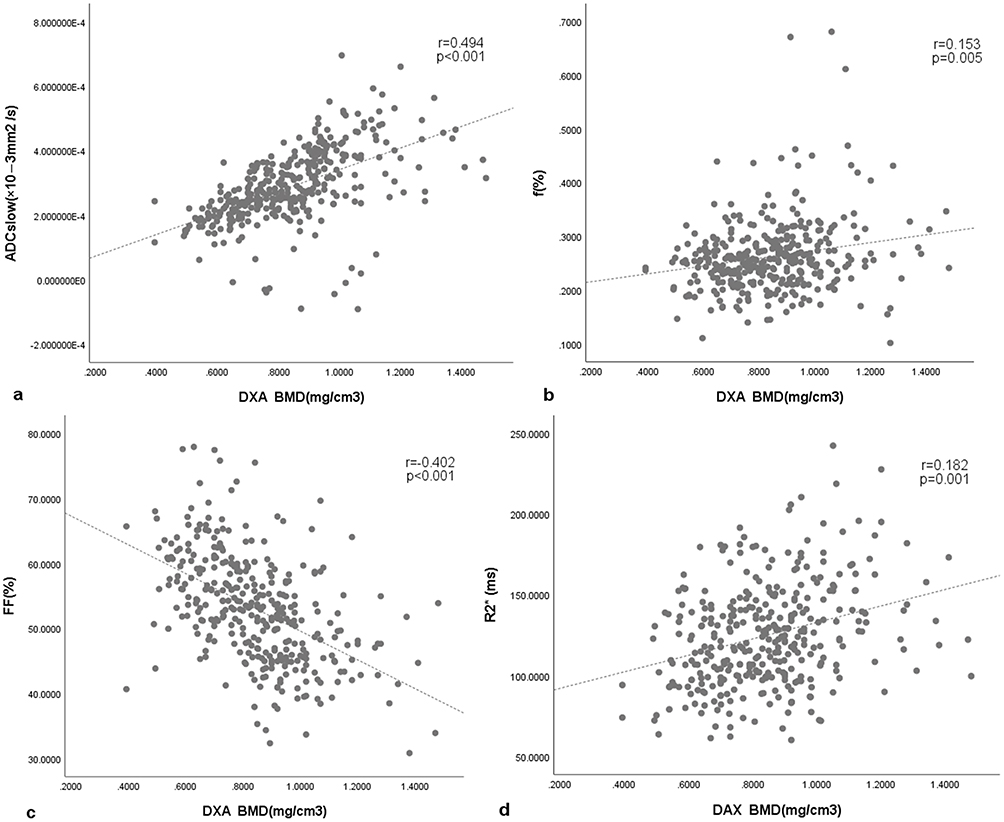 |
Figure 3 Scatter plots showing the correlations of BMD with ADCslow (a), f(b), FF (%)(c), and R2* (d) values. |
ROC Curve Analysis for Differentiating Normal Bone Status from Osteopenia and Osteoporosis in Patients
The results of our ROC curve analysis for distinguishing the three groups (normal bone, osteopenia and osteoporosis) are shown in Table 6 and Figure 4. FF had the highest AUCs (0.624, 0.831 and 0.747) and sensitivities (72.2%, 70.9% and 81.5%) in differentiating normal from osteopenic patients, normal from osteoporotic patients, and osteopenic from osteoporotic patients, respectively. However, ADCslow and f had the highest specificity (both 88%) in differentiating between the normal and osteopenia groups, ADCslow had the highest specificity (91.4%) in differentiating the normal from osteoporosis groups, and f had the highest specificity (69.7%) in differentiating the osteopenia group from the osteoporosis group.
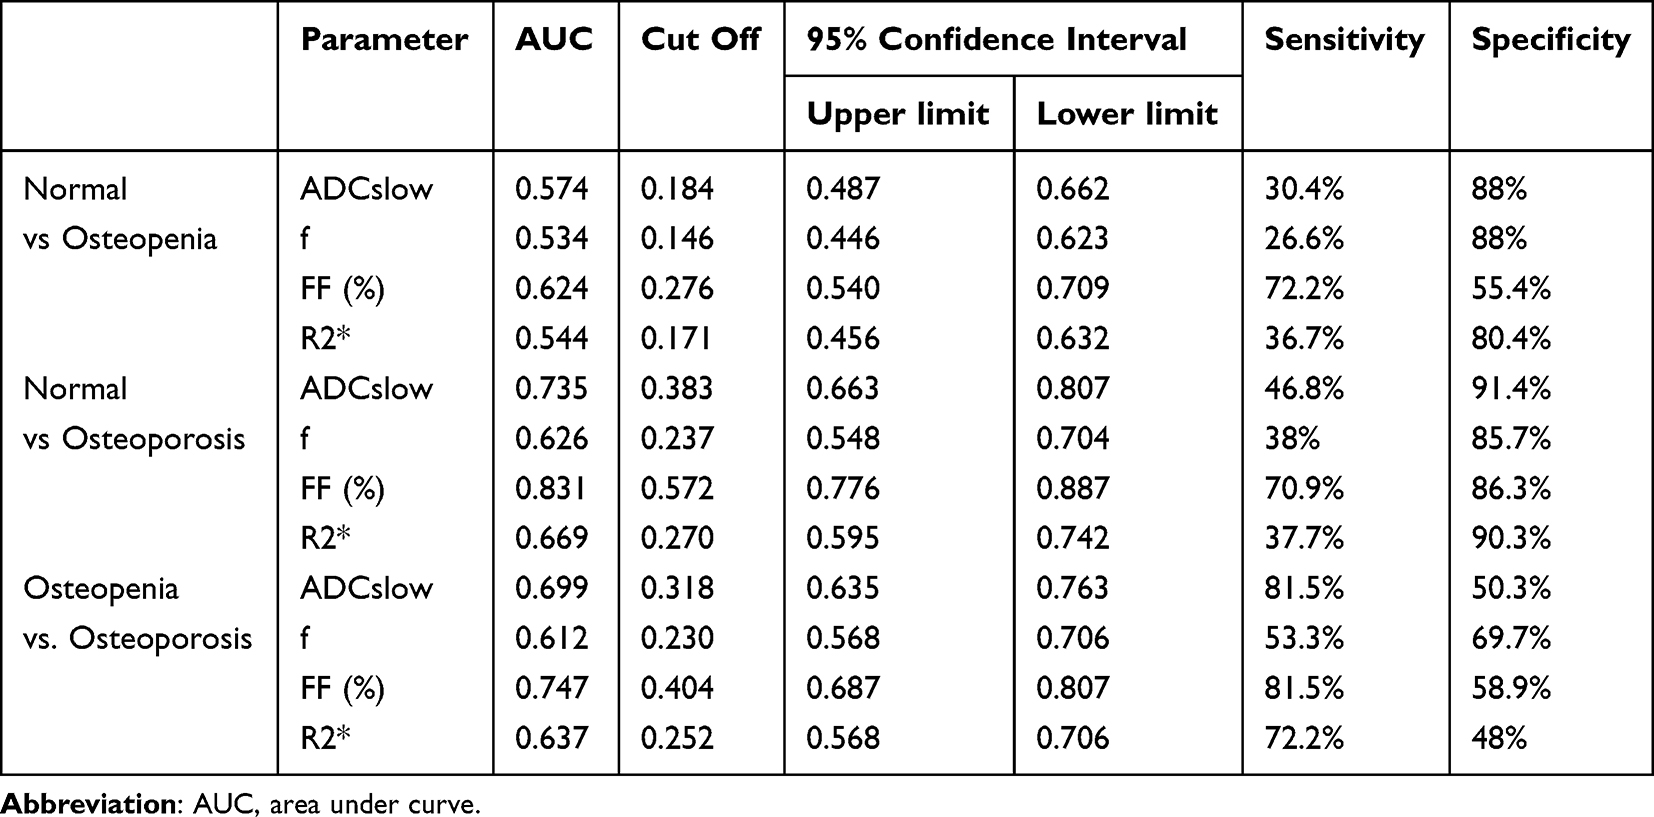 |
Table 6 ROC Analysis for Differentiation in Three Groups |
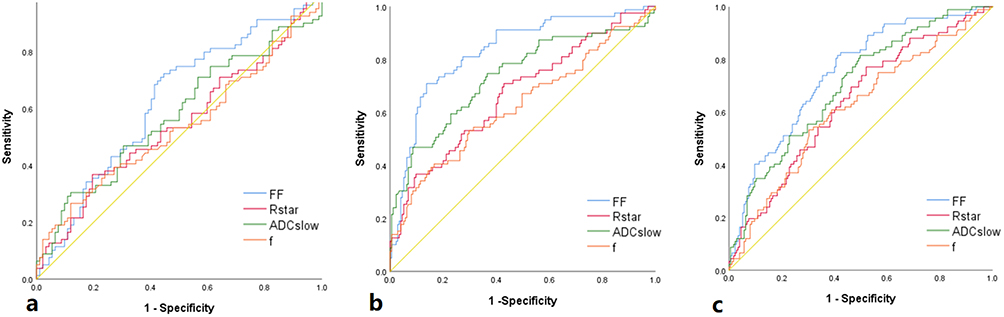 |
Figure 4 The (a–c) demonstrate the results of the ROC analysis for differentiating three groups (normal, osteopenia and osteoporosis group) respectively. |
Discussion
This study demonstrated the value of using multiparameter functional MRI (IVIM-DWI and IDEAL-IQ sequences) to assess osteoporosis quantitatively. The ADCslow, f, FF and R2* values all exhibited different degrees of correlation with BMD and could be used to differentiate BMD values by way of the three study groups. We recommend the IVIM and IDEAL-IQ sequences as the preferred methods for diagnosing OP in clinical practice.
DWI facilitates the detection of water molecule diffusion within living tissues. The ADC derived from DWI serves as an indicator of water molecule content, cellular 243 arrangement density, and cellular membrane integrity in vivo.20 Prior studies have highlighted the utility of DWI in diagnosing osteoporosis and distinguishing between 245benign and malignant fractures.21–23 Nonetheless, ADC values can be influenced by multiple factors, including the b value, water molecule motility patterns, and perfusion effects. By allowing the assessment of both the simple diffusion of water molecules (ADCslow) and microcirculatory perfusion diffusion (ADCfast), IVIM-DWI offers an enhanced evaluation of the vertebral microstructure, overcoming the limitations of DWI alone and enhancing diagnostic precision and specificity.24,25 In our investigation, the ADCslow values gradually and significantly decreased (P<0.05), whereas the ADCfast values gradually increased (albeit nonsignificantly, P>0.05) as the bone mass decreased. These findings imply that osteoporotic vertebrae exhibit increased cell density (abundant adipocytes), compressing the extracellular space and thereby restricting water molecule diffusion, resulting in reduced ADCslow. Conversely, the ADCfast values exhibited considerable variability and suboptimal signal‒to‒noise ratios, limiting their efficacy in diagnosing osteoporosis. These outcomes align with those of prior research,26,27 but are in contrast to those of studies suggesting that ADCfast is significantly correlated with BMD and has good diagnostic potential in distinguishing normal from abnormal bone metabolism (osteopenia and osteoporosis) groups in the context of diabetic osteoporosis;27 this discrepancy could be related to the characteristics of various study groups, disparities in sequence parameters, variations in the selection of b-value parameters, and the inability to redraw the double-blind region of interest (ROI).
Furthermore, our study revealed positive, albeit moderate (p<0.05), correlations between the ADCslow and f values and BMD within the vertebral bodies. This observation likely stems from the compression of true capillaries within the marrow cavity as osteoporosis progresses, accompanied by an increase in bone marrow adipocytes, leading to diminished microvascular perfusion (that is, a greater ADCslow value). Concurrently, an inadequate nutrient supply to trabecular bone and bone marrow cell hypoxia may suppress bone mineral deposition, lowering BMD. The complexity of this correlation is influenced by multiple factors,including the proportion of bone marrow adipocytes, perfused blood volume, and intricate microcirculatory dynamics. The IDEAL-IQ sequence is a sophisticated fat quantification method capable of acquiring FF images, R2* maps, and pure fat and water images in a single scan through multiecho acquisition.28 Notably, the FF and R2* values are commonly employed clinical quantitative parameters that have garnered significant interest in recent research in assessing fat content and iron concentration, respectively, outperforming conventional MRI techniques, such as two-point Dixon and magnetic resonance spectroscopy (MRS), in terms of accuracy.29,30 Prior studies have demonstrated the potential of FF in evaluating vertebral bone mineral loss, with a documented inverse relationship between FF and vertebral BMD.31,32 Previous research had shown that 28 iron overload is a risk factor for osteoporosis and the associated fractures.33
Our study revealed that the FF values in osteoporotic patients were significantly greater than those in patients with osteopenia or with normal bone (P<0.05) and were negatively correlated with BMD. Conversely, the R2* values in osteoporosis patients were notably lower than those in the osteopenic and normal groups and exhibited a positive correlation with BMD. Our results are consistent with the reported in the literature.34,35 Age-related trends included a gradual increase in FF indices and a decrease in R2* values. Additionally, we observed that women had higher FF values and lower R2* values than men did, and this may be attributable to variations in estrogen levels. A decrease in ovarian function and estrogen levels contributes to reduced bone formation and increased bone loss, leading to a marked decrease in BMD, an increase in FF, and a decrease in R2*making postmenopausal women particularly susceptible to osteoporosis. The results suggest that with increasing age, the vertebral body fat content increases and the bone mineral content and bone density decrease, all of which likely contribute to a higher risk of developing osteoporosis. However, it should be noted that may affect the generalizability of age-stratified analysis, due to an insufficient sample size in the elderly subgroup (≥80 years old, n=10) in this study.
These findings are mostly consistent with the results of Kugel’s research, who proposed that FF values increase by approximately 6% every decade in individuals aged 61 years or older, indicating that changes in fat content are also influenced by factors related to age.36 We also explored the diagnostic potential of all quantitative parameters from both the IVIM-DWI and IDEAL-IQ sequences in discriminating among the normal, osteopenic, and osteoporotic groups. Our findings showed that FF is a potent discriminator, achieving the highest AUC values of 0.624 in distinguishing normal from osteopenia patients, 0.831 for distinguishing normal from osteoporosis patients, and 0.747 for differentiating osteopenia from osteoporosis patients. Taken together with the results in the paragraph above, our findings indicate that FF may serve as an independent predictor of bone deterioration and is highly important in reliably, noninvasively quantifying marrow composition. ADCslow and R2* also demonstrated some value as quantitative parameters for assessing osteoporosis. Collectively, these quantitative metrics offer promise as potential biomarkers for osteoporosis evaluation.
Some limitations in our study should be noted. Firstly, this was a prospective study, and inevitably, much of the patients’ data may not have been obtained. A prospective study employing stricter control standards for the patients is necessary to better understand the value of the identified parameters in detecting osteoporosis. Secondly, DEXA may be less accurate than QCT because the former is influenced by many factors. Additionally, there is a limitation in age stratification due to an insufficient sample size in the elderly subgroup (≥80 years old, n=10), which may affect the generalizability of age-stratified analysis. Thus, future studies investigating the value of the imaging parameters identified in this study should employ QCT to verify the reliability of our results.
Conclusion
In summary, the IVIM-DWI and IDEAL-IQ sequences can be used for evaluating OP in the lumbar spine. The ADCslow, FF and R2* values can be reliable predictors of bone mass changes. We can obtain a large amount of microscopic data on an individual’s OP status through these two noninvasive sequences.
Abbreviations
IDEAL-IQ Iterative decomposition of water and fat with echo asymmetry and least squares estimation quantitation; IVIM-DWI Intravoxel incoherent motion diffusion weighted imaging; DEXA Dual energy X-ray absorptiometry; QCT Computed tomography; BMI Body mass index; BMD Bone mineral density; FF Fat fraction; R2* Transverse relaxation rate; DWI Diffusion-weighted imaging; ADC Apparent diffusion coefficients; ADCslow True-ADC; ADCfast Pseudo-ADC; MRS Magnetic resonance spectroscopy; AUC Area under the curve.
Data Sharing Statement
Datasets generated and analyzed during the current study are not publicly available but are available from the corresponding author, Zhang Yue, on reasonable request.
Ethics Approval and Informed Consent
This study was approved by the institutional ethics committee of the Second Affiliated Hospital of Shandong First Medical University. And this study was conducted in accordance with the principles of the Declaration of Helsinki. Patients provided written consent for participation in this analysis.
Consent for Publication
All authors have read and approved the final manuscript, and consent to publish the paper.
Acknowledgments
The authors would like to thank all the members of the research team for their assistance with manuscript preparation and the coordination of various stages of the study.
Author Contributions
All authors made a significant contribution to the work reported, whether that is in the conception, study design, execution, acquisition of data, analysis and interpretation, or in all these areas; took part in drafting, revising or critically reviewing the article; gave final approval of the version to be published; have agreed on the journal to which the article has been submitted; and agree to be accountable for all aspects of the work.
Funding
This work was supported by the Shandong Province Medical and Health Technology Development Plan Project (No. 202209010762), Comparative study of MR IDEAL-IQ and QCT in the evaluation of ankylosing spondylitis complicated with osteoporosis, (No.2020NS122), and The Natural Science Foundation of Shandong (ZR2024QH094).
Disclosure
The authors report no conflicts of interest in this work.
References
1. Compston JE, McClung MR, Leslie WD. Osteoporosis. Lancet. 2019;93(10169):364–366. doi:10.1016/S0140-6736(18)32112-3
2. Harvey N, Dennison E, Cooper C. Osteoporosis: impact on health and onomics. Nat Rev Rheumatol. 2010;6(2):99–105. doi:10.1038/nrrheum.2009.260
3. Si L, Winzenberg TM, Jiang Q, et al. Projection ofosteoporosis-related fractures and costs in China: 2010-2050.
4. Liang WANG, Tianzun TAO, Huilin YANG, et al. China guideline for diagnosis and treatment of senile osteoporosis(2023). Chin J Bone Joint Surg. 2023;16(10):865–879.
5. Chenlin, Zhang; Chinese Society of Osteoporosis and Bone Mineral search. Guidelines for the diagnosis and treatment of primary osteoporosis (2022). Chin Gen Med. 2023;26(14):1671–1691.
6. Liang W, Tianzhun T, Huilin Y, et al. Working group on the diagnosis and treatment guidelines for elderly osteoporosis in China (2023). Chin J Orthopedic Joint Surg. 2023;16(10):865–885.
7. Xu XM, Li N, Li K, et al. Discordance in diagnosis of osteoporosis by quantitative computed tomography and dual-energy X-ray absorptiometry in Chinese elderly men. J Orthop Transl. 2018;18:59–64.
8. Genant HK, Cann CE, Ettinger B, et al. The Classic: quantitative computed tomography of vertebral spongiosa: a sensitive method for detecting early bone loss after oophorectomy 1982. Clin Orthop Relat R. 2006;443:14–18. doi:10.1097/01.blo.0000202406.68891.d7
9. Link TM. Osteoporosis imaging: state of the art and advanced aging. Radiology. 2012;263(1):3–17. doi:10.1148/radiol.12110462
10. The China guideline for the diagnosis criteria of osteoporosis with quantitative computed tomography (QCT) working group. The China guideline for the diagnosis criteria of osteoporosis with quantitative computed tomography (QCT) (2018). Chin J Osteoporos. 2019;25(6):733–737.
11. Cheng X, Blake GM, Guo Z, et al. Correction of QCT vBMD using MRI measurements of marrow adipose tissue. Bone. 2018;120:120504–120511. doi:10.1016/j.bone.2018.12.015
12. Fathi Kazerooni A, Pozo JM, McCloskey EV, Saligheh Rad H, Frangi AF. Diffusion MRI for assessment of bone quality; a review of findings in healthy aging and osteoporosis. J Magn Reson Imaging. 2020;51:975–992. doi:10.1002/jmri.26973
13. Wehrli FW, Song HK, Saha PK, Wright AC. Quantitative MRI for the assessment of bone structure and function. NMR Biomed. 2006;19:731–764. doi:10.1002/nbm.1066
14. Grifth JF, Genant HK. New advances in imaging osteoporosis and its complications. Endocrine. 2012;42:39–51. doi:10.1007/s12020-012-9691-2
15. Roch PJ, Çelik B, Jäckle K, et al. Combination of vertebral bone quality scores from different magnetic resonance imaging sequences improves prognostic value for the estimation of osteoporosis. Spine J. 2023;23(2):305–311. doi:10.1016/j.spinee.2022.10.013
16. Kim D, Kim SK, Lee SJ, Choo HJ, Park JW, Kim KY. Simultaneous estimation of the fat fraction and R2* via T2*-corrected 6-Echo Dixon volumetric interpolated breath hold examination imaging for osteopenia and osteoporosis detection: correlations with sex, age, and menopause. Korean J Radiol. 2019;20(6):916–930. doi:10.3348/kjr.2018.0032
17. Varela V, Gregory J, Barr R, et al. MRI measurement of fractional fat in the proximal femur in subjects with osteoarthritis. Bone. 2010;47:S79–80.
18. Wu G, Xie R, Liu X, Hou B, Li Y, Li X. Intravoxel incoherent motion diffusion MR and diffusion kurtosis imaging for discriminating atypical bone metastasis from benign bone lesion. Br J Radiol. 2019;92(1100):20190119. doi:10.1259/bjr.20190119
19. Working group on guidelines for diagnosis and treatment of senile osteoporosis in China (2018), Osteoporosis Society of China Association of Gerontology and Geriatrics. 2018 China guideline for diagnosis and treatment of senile osteoporosis). Chin J Osteoporos. 2018;24(12):1541–1567.
20. Lobo J, Rodrigues Â, Antunes L, et al. High immunoexpression of Ki67, EZH2,and SMYD3 in diagnostic prostate biopsies independently predicts outcome in patients with prostate cancer. Urol Oncol-Semin Ori. 2017;36(4):161.e7–161.e17. doi:10.1016/j.urolonc.2017.10.028
21. Tang G, Liu Y, Li W, et al. Optimization of b value in diffusion-weighted MRI for the differential diagnosis of benign and malignant vertebral fractures. Skeletal Radiol. 2007;36(11):1035–1041. doi:10.1007/s00256-007-0358-7
22. Zhu HL, Ding JP, Qi YJ. Quantitative evaluation of lumbar spine osteoporosis by apparent diffusion coefficient and signal intensity ratio of magnetic resonance diffusion-weighted magnetic resonance imaging. China J Orthopaedics Traumatol. 2021;34(8):743–749. doi:10.12200/j.issn.1003-0034.2021.08.010
23. Momeni M, Asadzadeh M, Mowla K, et al. Sensitivity and specificity assessment of DWI and ADC for the diagnosis of osteoporosis in postmenopausalpatients. Radiol Med. 2019;125(1):68–74. doi:10.1007/s11547-019-01080-2
24. Yang H, Liang Z. IVIM-DWI abdominal application and its progress. Magnetic Resonance Imaging. 2016;7(7):546–550.
25. Xing T. Diagnostic value of voxel incoherent motion diffusion-weighted imaging for osteoporosis. Wannan Medical College. 2019.
26. Liu C, Wang K, Chan Q, et al. Intravoxel incoherent motion MR imaging for breast lesions: comparison and correlation with pharmacokinetic evaluation from dynamic contrast-enhanced MR imaging. Eur Radiol. 2016;26(11):3888–3898. doi:10.1007/s00330-016-4241-6
27. Yang H, Cui X, Zheng X, et al. Preliminary quantitative analysis of vertebral microenvironment changes in type 2 diabetes mellitus using FOCUS IVIM-DWIand IDEAL-IQ sequences. Magn Reson Imaging. 2021;84:84–91. doi:10.1016/j.mri.2021.09.008
28. Karampinos DC, Ruschke S, Dieckmeyer M, et al. Quantitative MRI andspectroscopy of bone marrow. J Magn Reson Imaging. 2017;47(2):332–353. doi:10.1002/jmri.25769
29. Jeon KJ, Lee C, Choi YJ, et al. Assessment of bone marrow fat fractions in the mandibular condyle head using the iterative decomposition of water and fat withecho asymmetry and least-squares estimation (IDEAL-IQ) method. PLoS One. 2021;16(2):e0246596. doi:10.1371/journal.pone.0246596
30. Colgan TJ, Van Pay AJ, Sharma SD, Mao L, Reeder SB. Diurnal variation of proton density fat fraction in the liver using quantitative chemical shiftencoded MRI. J Magn Reson Imaging. 2020;51(2):407–414. doi:10.1002/jmri.26814
31. Ji Y, Hong W, Liu M, et al. Intervertebral disc degeneration associated with vertebral marrow fat, assessed using quantitative magnetic resonance imaging. Skeletal Radiol. 2020;49(11):1753–1763. doi:10.1007/s00256-020-03419-7
32. Jerban S, Moazamian D, Mohammadi HS, et al. More accurate trabecular bone imaging using UTE MRI at the resonance frequency of fat. Bone. 2024;184:117096.
33. Sun L, Guo W, Yin C, et al. Hepcidin deficiency undermines bone load-bearing capacity through inducing iron overload. Gene. 2014;543(1):161–165. doi:10.1016/j.gene.2014.02.023
34. Li G, Xu Z, Li X, et al. Adding marrow R2* to proton density fat fraction improves the discrimination of osteopenia and osteoporosis in postmenopausal women assessed with 3D FACT sequence. Menopause. 2021;28(7):800–806. doi:10.1097/GME.0000000000001799
35. Hwang SN. Editorial for “Practical approaches to bone marrow fat fraction quantification across magnetic resonance imaging platforms”. J Magn Resonimaging. 2020;52(1):307–308.
36. Kugel H, Jung C, Schulte O, et al. Age- and sex-specific differences in the 1H-spectrum of vertebral bone marrow. J Magn Reson Imaging. 2001;13:263–268. doi:10.1002/1522-2586(200102)13:2<263::AID-JMRI1038>3.0.CO;2-M
 © 2025 The Author(s). This work is published and licensed by Dove Medical Press Limited. The
full terms of this license are available at https://www.dovepress.com/terms
and incorporate the Creative Commons Attribution
- Non Commercial (unported, 4.0) License.
By accessing the work you hereby accept the Terms. Non-commercial uses of the work are permitted
without any further permission from Dove Medical Press Limited, provided the work is properly
attributed. For permission for commercial use of this work, please see paragraphs 4.2 and 5 of our Terms.
© 2025 The Author(s). This work is published and licensed by Dove Medical Press Limited. The
full terms of this license are available at https://www.dovepress.com/terms
and incorporate the Creative Commons Attribution
- Non Commercial (unported, 4.0) License.
By accessing the work you hereby accept the Terms. Non-commercial uses of the work are permitted
without any further permission from Dove Medical Press Limited, provided the work is properly
attributed. For permission for commercial use of this work, please see paragraphs 4.2 and 5 of our Terms.