Back to Journals » Medical Devices: Evidence and Research » Volume 16
Assessment of a Non-Invasive Brain Pulse Monitor to Measure Intra-Cranial Pressure Following Acute Brain Injury
Authors Dixon B, Sharkey JM, Teo EJ ![]() , Grace SA, Savage JS
, Grace SA, Savage JS ![]() , Udy A, Smith P, Hellerstedt J
, Udy A, Smith P, Hellerstedt J ![]() , Santamaria JD
, Santamaria JD
Received 29 November 2022
Accepted for publication 13 January 2023
Published 24 January 2023 Volume 2023:16 Pages 15—26
DOI https://doi.org/10.2147/MDER.S398193
Checked for plagiarism Yes
Review by Single anonymous peer review
Peer reviewer comments 2
Editor who approved publication: Dr Scott Fraser
Barry Dixon,1– 3 Jessica M Sharkey,1 Elliot J Teo,1,2 Sally A Grace,1 Jacqui S Savage,1 Andrew Udy,4 Paul Smith,5,6 Jack Hellerstedt,1 John D Santamaria2
1Cyban Pty Ltd, Melbourne, VIC, Australia; 2Department of Critical Care Medicine, St Vincent’s Hospital, Melbourne, Australia; 3Department of Medicine, University of Melbourne, Melbourne, Vic, Australia; 4Department of Critical Care Medicine, The Alfred Hospital, Melbourne, Australia; 5Department of Neurosurgery, St Vincent’s Hospital, Melbourne, Australia; 6University of Melbourne Medical School, Melbourne, Vic, Australia
Correspondence: Barry Dixon, Department of Critical Care Medicine, St Vincent’s Hospital (Melbourne), 41 Victoria Parade, Fitzroy, VIC, 3065, Australia, Tel +61 3 9231 4425, Email [email protected]
Background: Intracranial pressure (ICP) monitoring requires placing a hole in the skull through which an invasive pressure monitor is inserted into the brain. This approach has risks for the patient and is expensive. We have developed a non-invasive brain pulse monitor that uses red light to detect a photoplethysmographic (PPG) signal arising from the blood vessels on the brain’s cortical surface. The brain PPG and the invasive ICP waveform share morphological features which may allow measurement of the intracranial pressure.
Methods: We enrolled critically ill patients with an acute brain injury with invasive ICP monitoring to assess the new monitor. A total of 24 simultaneous invasive ICP and brain pulse monitor PPG measurements were undertaken in 12 patients over a range of ICP levels.
Results: The waveform morphologies were similar for the invasive ICP and brain pulse monitor PPG approach. Both methods demonstrated a progressive increase in the amplitude of P2 relative to P1 with increasing ICP levels. An automated algorithm was developed to assess the PPG morphological features in relation to the ICP level. A correlation was demonstrated between the brain pulse waveform morphology and ICP levels, R2=0.66, P < 0.001.
Conclusion: The brain pulse monitor’s PPG waveform demonstrated morphological features were similar to the invasive ICP waveform over a range of ICP levels, these features may provide a method to measure ICP levels.
Trial Registration: ACTRN12620000828921.
Keywords: intracranial pressure, acute brain injury, monitoring, non-invasive, photoplethysmography
Introduction
A major challenge in managing acute brain injury is how to continuously monitor the brain to detect secondary brain injury. Early detection of a complication is vital to reduce death and disability,1–4 and is recommended by expert panels, including the Australian Trauma Guidelines and The International Consensus Conference on Monitoring in Neurocritical Care.5–7
Monitoring for secondary brain injury in unconscious critically ill patients remains problematic. Options include intermittent clinical examination of brain stem reflexes or invasive forms of brain monitoring. Both have major limitations. Clinical examination is often poorly done, but even when done well it detects brain injury relatively late, at a potentially irreversible stage.8 The American Association of Neurological Surgeons Traumatic Brain Injury Guideline, therefore, recommends that treatment be informed by monitoring rather than clinical assessment.9 Invasive intra-cranial pressure (ICP) monitoring, while potentially providing continuous and earlier detection of complications, is expensive and has significant risks, including ventricular infection rates of up to 9%, haemorrhage of 22%, and haemorrhage causing clinical deterioration in 1% of cases.10 Due to the high costs and risks, invasive monitoring is usually reserved for cases of severe brain injury.2,11–13 For most patients, therefore, monitoring is confined to just clinical examination.
While a non-invasive method to measure ICP would greatly enhance patient care, available methods have limitations. Brain4care (B4C) have developed an extra-cranial strain gauge sensor that detects small variations in skull deformation induced by intracranial pressure changes; the “brain stethoscope” has a similar approach with the signal arising from tympanic membrane pulsations.14–17 These methods both detect a ICP waveform. Only B4C has published preliminary data in brain injured patients.18,19 Other approaches include the HeadSense monitor that uses an acoustic method.20 Both optical nerve ultra-sound and transcranial Doppler have been demonstrated to provide a reasonable correlation with invasive ICP levels, but require a skilled operator and are difficult to use continuously and cannot be positioned over multiple regions of the brain.21
Diffuse correlation spectroscopy (DCS), and other near infrared (NIRS) non-invasive techniques, can capture a pulsatile brain signal. While the pulsatile waveform morphologies do not closely resemble an ICP waveform, features may be extracted to assess parameters such as cerebral blood flow, cerebral blood volume and ICP.22–26 A relationship with ICP levels was demonstrated in some studies, but the algorithms also included other variables known to correlate with ICP, such as blood pressure.22,23 The contribution of the scalp tissues blood flow to the signal may also be a limitation.22,26–28 To date these approaches remain at a research stage.
We have developed a non-invasive brain pulse monitor that captures a brain photoplethysmographic (PPG) signal.29,30 The PPG waveform shares similar morphological features with the invasive ICP pulse waveform. These features may allow measurement of the intracranial pressure.31–33 The aim of this study was to assess the potential correlation between the invasive ICP measurement with the non-invasive brain PPG signal in patients with acute brain injuries.
Methods
Subject Selection
The inclusion criteria were critically ill adult patients admitted to the Critical Care Unit with an acute brain injury that may require intracranial pressure monitoring. Patients were excluded if non-invasive brain monitoring was not possible due to a wound dressing, skin or bone trauma or severely damaged brain or haematoma, preventing placement of the sensor for brain PPG detection.
The brain pulse monitor uses the wavelength 660 nm to capture a brain pulsatile waveform that is used to assess ICP levels. The monitor may also be used to assess brain oxygen levels, for this purpose 660 nm and 940 nm are used. This paper presents data in relation to ICP assessment only.
Unlike a number of other brain near infra-red (NIR) monitors, such as cerebral oximeters, each sensor has a single light emitting diode (LED) and photodetector (PD). As with any NIR approach removing potential contamination of photon absorption by the extra-cranial scalp layers is fundamental to obtain an accurate brain signal. The novel geometry of the LED and PD in the sensor hub preferentially detects photons reflected from deeper tissues, minimising pulsatile extra-cranial sources contributing to the PPG signal. This is achieved, in part, by the position of the LED and PD, relative to the skin. This and other aspects of the sensor’s hub allow the detection of a PPG signal arising from the brain. Further details of the sensor design are not disclosed at this time for commercial reasons.
The major blood source of the brain PPG signal is likely to arise from cardiac induced blood volume changes in the pial venous vessels that lay on the surface of the cortical gyri. The pial venules contain 75% to 85% of the total pial vessel’s blood volume.34–36 The blood volume in the pial vessels is 4-fold higher relative to the capillary vessels deeper in the cortex.37,38
The brain PPG signal has distinctive features that allow it to be distinguished from a conventional skin PPG signal. The brain pulse waveform is typically inverted, relative to the skin PPG waveform. The inverted brain PPG signal likely represents compression (and emptying) of the pial (low pressure) vein/venules by the expanding brain volume during early systole.39–41 Consequently, unlike the skin, the blood volume in the pial vein/venules may reduce during systole, giving rise to the inverted PPG signal.
The Brain Pulse Monitor
The bedside monitoring unit is comprised of a roll-stand with an enclosure containing the Graphical User Interface (GUI) (a Tablet PC), a power supply for all components (Figure 1).
 |
Figure 1 The bedside monitoring unit. |
The monitors LED and PD are controlled and processed by an Integrated Analog Front End circuit board, which digitizes the received signal from each sensor and sends the data stream to the Tablet PC. The PC receives the sensor data from the Processing Unit, and presents the data on a display, along with patient identifier data to the operator, via a custom software application. The power supply is a medical grade (IEC60601-1 approved) 120 V AC power supply for the processing unit. The architecture of the system is shown in Figure 2. All components of the Brain Pulse Monitor were developed and built by Cyban Pty Ltd in Melbourne, Australia.
 |
Figure 2 Architecture of the brain pulse monitoring system. |
A brain pulse sensor was placed over each hemisphere. A NellcorTM SPO2 Forehead Sensor was placed on the forehead (midline) to provide a reference conventional skin pulse oximeter PPG waveform (wavelengths 660 and 900 nm) for comparison purposes only (Figure 3). The brain pulse sensors were typically placed over the frontal or the temporal lobes and secured in position with a headband. The sensor’s position may need to be adjusted if a skin PPG signal is initially obtained. The distinctive features of the brain PPG signals provide a method to adjust the position the sensor for optimal brain signal detection. This need for adjustment may reflect the fixed geographical distribution of pial veins and venules in relation to the cortical gyri and sulci. Each gyrus has a dominant vein or veins occupying the centre with abundant arborisations and vast numbers of venules. Larger cortical draining veins lay along the sulci. The venule rich gyri are the likely source of the brain signal, as the relative blood volume is higher compared to the other areas. Consequently, to obtain an optimal brain signal the sensor may need placement over a gyrus.42 If required, the hair was shaved to improve signal quality. The sensor was not placed over areas of large focal haemorrhages, present on routine brain imaging, as this may give rise to an atypical ICP waveform. Synchronous recordings were made from all three sensors and the invasive ICP.
 |
Figure 3 A brain pulse monitor was placed on each temple. A NellcorTM SPO2 A skin pulse oximeter was placed on the forehead (midline) to provide a reference conventional skin PPG waveform for comparison. The extra-ventricular drains (EVD) used to measure intracranial pressure are highlighted by the Orange arrows. Abbreviation: ICP, intracranial pressure. |
Invasive ICP Measurement
An extra-ventricular drain was placed into the left or right lateral ventricles. The pressure levels were zeroed at the tragus and monitored by a Philips IntelliVue system. The physiological data were exported, including the ICP waveforms using ICM+ (Cambridge Enterprise, Cambridge, UK).
Brain Pulse Signal Pre-Processing
We applied a Butterworth bandpass filter with order 3 and lower and higher 3-dB frequencies 0.1 (Hz) and (8.5 Hz), respectively, using the Scipy signal “butter” and “filtfilt” (v1.9.0). The sampling frequency is set to 500 (Hz). Pulse starts were identified using methods previously applied to QRS complex whereby the signal second derivative is taken through filters, which exaggerates areas of the graphs of fastest change.43 Then, a moving average filter is applied to merge minor peaks, where a broader the moving average filter merges larger features. We then added an additional layer of logic to localise these pulse starts to within −80 milliseconds preceding and +60 milliseconds following the skin pulse starts. A pulse-end was defined as the next pulse-start. The algorithm was developed through an iterative comparison to the invasively measured ICP levels over the range of 0 to 40 mmHg. The invasive ICP level was defined as the highest point during the ICP pulse. Invasive ICP levels >40 mmHg were given the value of 40 mmHg. For each participant, a timestamp at each hemisphere was visually inspected and recorded whereby a clean signal was identified at the time of invasive ICP measurement. Non-invasive ICP measurements were calculated for each pulse and averaged over a window of recording which was at least 30 seconds.
Brain Pulse Monitor ICP Estimation
An automated algorithm was developed to assess the brain pulse monitor’s correlation with ICP levels based on the brain pulse waveform, using ICP morphological waveform features known to be associated with raised ICP.44–46 The normal ICP waveform typically comprises 3 peaks P1 (the percussion wave, representing the early systolic increase in brain volume), P2 (the mid/late systolic tidal wave) and P3 (the dicrotic wave, following closure of the aortic valve during diastole). The dicrotic notch represents an earlier nadir associated with aortic valve closure. Normal ICP levels are associated with the relative amplitudes of the peaks, where P1 > P2 > P3. With raised ICP levels there is an increase in the amplitude of P2 and P3 relative with P1, a temporal delay in the pulse’s peak, an increasingly indistinct P3 and dicrotic notch and changes in the area under curve of the waveform.44–47 The peaks were determined using the Scipy signal “find_peaks” function (v1.8.0) and area under the curve was estimated using the Numpy “Trapz” function (v1.22.3). Further details of the algorithm are not disclosed at this time for commercial reasons.
St Vincent’s Hospital (Melbourne, Australia) Human Research Ethics Committee (HREC) granted ethics committee approval. Because participants lacked the capacity to consider participation at the time of eligibility, informed consent was obtained from their person responsible prior to enrolment. This was written consent except when the person responsible was unable to attend the hospital; in these circumstances, and in accordance with the approved consent procedures, verbal (telephone) consent was obtained. All medical protocols in this study adhered to the Declaration of Helsinki. All methods were performed in accordance with the relevant guidelines and regulations of our hospital. Informed consent to release information and images from online open-access publications was obtained from all participants.
Statistical Analysis
We used linear regression to determine the coefficient of correlation between the non-invasive ICP prediction and the invasive ICP measurements. Figures and the Pearson correlation was performed using GraphPad Prism version 9.4 (Graph Pad Inc, San Diego, USA). The slope of the line of best fit was used to determine the predicted ICP measurements from the algorithm estimations. All assumptions for statistical tests were met. Aggregate patient demographic data is presented as median with interquartile range (IQR) unless otherwise stated. Values over p < 0.05 were considered significant.
Results
Patient Characteristics
A total of 24 simultaneous recordings were recorded in 12 (4 males, 8 females) patients with a median age of 61 (46–72) years (Table 1). Eight patients suffered a sub-arachnoid hemorrhage (SAH), one suffered a stroke, 2 suffered intracerebral hemorrhage (ICH) and one underwent complicated surgery for a retro-orbital tumour. The median length of stay in hospital was 22.5 (IQR, 16.5–28.75) days, and 11 (IQR 7–14.5) days in the critical care unit. Seven patients survived.
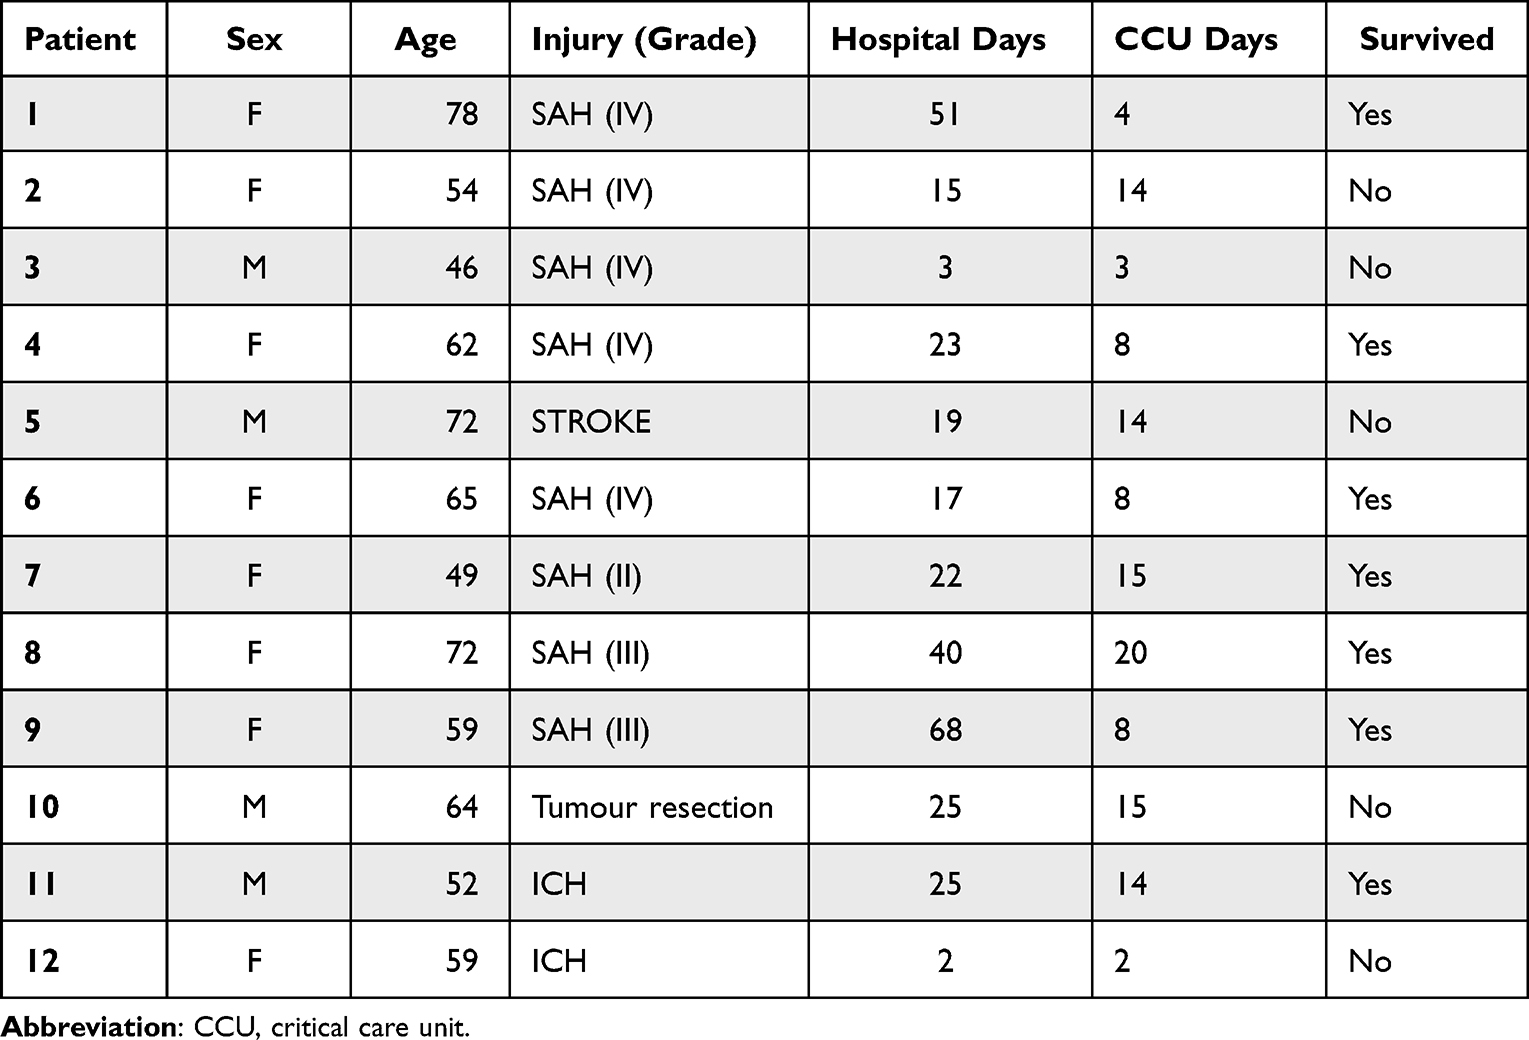 |
Table 1 Patient Characteristics |
Brain Pulse Waveform Morphology
The brain pulse monitor PPG demonstrated features similar to the invasive ICP waveform. These included peaks at P1, P2, P3 and a dicrotic notch. Figure 4 demonstrates the morphological features of the left and right brain pulse monitor PPG signals in relation to the conventional forehead skin PPG signal and simultaneous invasive ICP waveforms.
 |
Figure 4 Simultaneous conventional skin and brain PPG signals (over one pulse period) compared with the invasive intracranial pressure from a patient presenting with a sub-arachnoid haemorrhage. The shape of the waveforms for both the right and left brain pulse monitor PPG signals are inverted compared with the skin PPG. The morphological features of the right and left brain waveforms were similar to the invasive ICP waveform in terms of the peaks’ temporal positions (P1, P2, P3) and the dicrotic notch (indicated by arrow). Note the raw skin PPG signal is presented without being flipped as is the convention with bedside commercial monitors. Abbreviations: ICP, intracranial pressure; V, Volts; PPG, photoplethysmography. |
The relationship of these waveform features (P1, P2, P3, notch) was similar to the invasive ICP waveform, over a range of ICP levels. Figure 5 demonstrates the changes in the brain pulse monitor PPG signal in comparison to the invasive ICP waveform in a patient over a 3-day period in which the ICP increased. Both methods demonstrated an increase in the amplitudes of P2 and P3 relative to P1, a later pulse peak and a progressively indistinct notch and P3.44–46
 |
Figure 5 The evolution of the morphological waveform features of the brain pulse monitor PPG signal over a 3 day period in relation to the simultaneous invasive ICP (one pulse period) measured from an external ventricular drain positioned in the right lateral ventricle of a patient with a grade 5 sub-arachnoid haemorrhage. Day 1: Normal ICP. The relative amplitudes of the waveform peaks were P1 > P2 > P3, (indicated by the angle of the green line segment), and there is a rapid increase from the beginning of the pulse wave to the pulse peak in early systole (t1; 0.13 seconds). Day 2: Raised ICP. The P2 amplitude is now greater than P1 and P3 and there is an increased time lag (t2; 0.22 seconds) to the highest pulse peak. Day 3: Markedly raised ICP. The P2 and P3 amplitudes are very much greater than P1 and the time lag to reach the pulse peak is extended further (t3; 0.24 seconds). Abbreviations: ICP, intracranial pressure; V, Volts; PPG, photoplethysmography, (t time to peak). |
Based on these waveform morphological features, an automated algorithm was developed to predict ICP from the brain pulse waveform. A single outlier data point was removed based on analysis of the standard residuals which identified a z-score of 3.49, more than 3 standard deviations less than the mean. A significant correlation between the invasive and predicted ICP levels, R2=0.66, p<0.001 (Figure 6).
 |
Figure 6 (A) Correlation between the brain pulse monitor predicted ICP and invasive ICP measurements. The solid line represents the best linear fit and the dark shaded area represents the 95% confidence interval of the fit, and the light shaded area represents the prediction interval of the fit; (B) Bland-Altman plot (difference as a percentage vs mean ICP), the central dashed line represents the mean bias that was less than 1%, the outer dashed lines represent the mean ± 1.96 standard deviations demonstrating that 95% of the data points were ± 13.6% of the invasive measurement. R2 = 0.66, P<0.001 (Pearson). Abbreviation: ICP, intracranial pressure. |
Discussion
We found the non-invasive brain pulse monitor’s PPG waveform demonstrated morphological features similar to the invasive ICP waveform across a range of ICP levels. These features were used to develop an algorithm which demonstrated a significant correlation with invasive ICP levels. Our findings suggest the brain pulse monitor may provide a simple method to continuously and safely monitor the brain to provide earlier detection of brain injury and its complications. Early detection and treatment of complications could markedly improve patient outcomes.
Cardiac induced pulsatile blood volume changes are the likely source of the common waveform features seen with the 2 monitoring methods. During early systole brain volume increases with the arterial inflow of blood, from mid systole the brain volume falls as venous drainage exceeds arterial inflows.39,48 Early systolic expansion of the brain volume may compress the low pressure pial veins/venules on the cortical surface emptying these vessels, while subsequent relaxation of the brain re-expands the pial blood volume.39 This mechanism may also explain why the brain and skin PPG signals are inverted in relation to each other, unlike the skin, the blood volume in the pial veins/venules reduces during systole.
These distinct differences between the brain and skin PPG signals provide a method to reduce extra-cranial contamination from the skin by allowing adjustment of the sensor position till an optimal brain waveform is found. This is a major difference with existing commercial NIR devices, such as cerebral oximeters, which may have significant levels of extra-cranial contamination.49–51
Brain swelling from acute brain injury may negatively impact on venous drainage through compression of the large venous sinuses, particularly the sagittal and transverse sinuses.48,52–54 The ICP waveform and the brain PPG changes seen with raised ICP are likely to represent prolonged systolic brain volume expansion due to a mismatch between arterial blood flow in and limited venous flows out. The ICP waveform peak is therefore delayed with a dominant P2. The brain relaxation phase is shorter.55 Studies have demonstrated that augmenting venous drainage resolves these ICP waveform changes and reduces the ICP.48,52–54
Limitations
To obtain an optimal brain PPG signal and to avoid a skin PPG signal the sensor’s position may need adjustment. This process can, however, delay obtaining a signal and if the sensor moves the brain PPG signal may be lost.
The brain pulse monitor waveform assesses ICP levels in the sub-arachnoid space, we compared with invasive ICP levels measured at a much deeper and distinct anatomical site, the lateral ventricle with an extra-ventricular drain. Studies have shown that both the pressure levels and waveforms vary at these distinct anatomical sites.56–58 Furthermore, following a focal injury that has not resulted in a global insult, ICP increases may be localised and vary between regions of the brain.59,60 In addition, the ICP waveform also reflects changes in brain compliance, hence in patients with early compliance changes, the ICP may still be normal.61–63 These factors could result in an anticipated loss of accuracy and variation in the relative waveform morphologies relative to the invasive ICP levels used in the study. Other limitations include the absence of blinding in the study design.
Conclusion
The non-invasive brain pulse monitor PPG waveform demonstrated morphological features similar to the invasive ICP waveform over a range of ICP levels. An algorithm based on the PPG morphology found the brain pulse monitor ICP levels were significantly correlated with invasive ICP levels. Our findings raise the possibility that this novel non-invasive monitor could provide a simple method to continuously and safely monitor the brain to provide earlier detection of brain injury or its complications.
Data Sharing Statement
The data that support the findings of this study are available from the corresponding author upon reasonable request.
Acknowledgments
We would like to acknowledge Robert Tran from Keylead Health for his contributions to the algorithm development.
Author Contributions
All authors made a significant contribution to the work reported, whether that is in the conception, study design, execution, acquisition of data, analysis and interpretation, or in all these areas; took part in drafting, revising or critically reviewing the article; gave final approval of the version to be published; have agreed on the journal to which the article has been submitted; and agree to be accountable for all aspects of the work. Specific contributions included but were not limited to the following. B.D conceived the study. B.D., J.D.S., A.U. and P.S. designed the human study protocol. B.D and J.S.S developed the sensor hub. B.D., J.S., and E.J.T collected data. B.D., J.S., S.A.G. J.H and E.J.T analyzed the data and interpreted the results. B.D. wrote the first manuscript draft.
Funding
The research was supported by a grant from the Biomedtech Horizons Program part of the Medical Research Future Fund of the Australian Government.
Disclosure
BD is the founder and Chief Scientific Officer of Cyban, Pty Ltd and reports grants, personal fees from Cyban, during the conduct of the study; In addition, Dr Barry Dixon has patents US9717446B2 and WO2008134813A1 issued to Cyban. J.M.S., S.A.G., E.J.T., J.H and J.S.S. are paid employees of Cyban. The hospital departments of J.D.S, and A.U. received financial support from Cyban to undertake the study. A.U. reports non-financial support from Integra Lifesciences, outside the submitted work. The remaining author, P.S., has no conflicts of interest to declare for this work.
References
1. Stiefel MF, Spiotta A, Gracias VH., et al. Reduced mortality rate in patients with severe traumatic brain injury treated with brain tissue oxygen monitoring. J Neurosurg. 2005;103(5):805–811. doi:10.3171/jns.2005.103.5.0805
2. Okonkwo DO, Shutter LA, Moore C, et al. Brain oxygen optimization in severe traumatic brain injury Phase-II: a Phase II randomized trial. Crit Care Med. 2017;45(11):1907–1914. doi:10.1097/CCM.0000000000002619
3. Xie Q, Wu HB, Yan YF, Liu M, Wang ES. Mortality and outcome comparison between brain tissue oxygen combined with intracranial pressure/cerebral perfusion pressure-guided therapy and intracranial pressure/cerebral perfusion pressure-guided therapy in traumatic brain injury: a meta-analysis. World Neurosurg. 2017;100:118–127. doi:10.1016/j.wneu.2016.12.097
4. Maloney-Wilensky E, Gracias V, Itkin A, et al. Brain tissue oxygen and outcome after severe traumatic brain injury: a systematic review. Crit Care Med. 2009;37(6):2057–2063. doi:10.1097/CCM.0b013e3181a009f8
5. Health NMo. Adult Trauma Clinical Practice Guidelines Initial Management of Closed Head Injury in Adults 2nd Edition. Health NMo; 2011.
6. Victoria T. Traumatic brain injury. Available from: http://trauma.reach.vic.gov.au/guidelines/traumatic-brain-injury/key-messages.
7. Le Roux P, Menon DK, Citerio G, et al. The international multidisciplinary consensus conference on multimodality monitoring in neurocritical care: evidentiary tables: a statement for healthcare professionals from the neurocritical care society and the European society of intensive care medicine. Neurocrit Care. 2014;21(Suppl 2):S297–S361. doi:10.1007/s12028-014-0081-x
8. McCredie VA, Chavarria J, Baker AJ. How do we identify the crashing traumatic brain injury patient - The intensivist’s view. Curr Opin Crit Care. 2021;27(3):320–327. doi:10.1097/MCC.0000000000000825
9. Carney N. Guidelines for the Management of severe traumatic brain injury 4th edition. Brain Trauma Foundation; 2016. Available from: https://braintrauma.org/uploads/03/12/Guidelines_for_Management_of_Severe_TBI_4th_Edition.pdf.
10. Tavakoli S, Peitz G, Ares W, Hafeez S, Grandhi R. Complications of invasive intracranial pressure monitoring devices in neurocritical care. Neurosurg Focus. 2017;43(5):E6. doi:10.3171/2017.8.FOCUS17450
11. Oddo M, Levine JM, Mackenzie L, et al. Brain hypoxia is associated with short-term outcome after severe traumatic brain injury independently of intracranial hypertension and low cerebral perfusion pressure. Neurosurgery. 2011;69(5):1037–45; discussion 1045. doi:10.1227/NEU.0b013e3182287ca7
12. Barone DG, Czosnyka M. Brain monitoring: do we need a hole? An update on invasive and noninvasive brain monitoring modalities. Sci World J. 2014;2014:795762. doi:10.1155/2014/795762
13. Frigieri G, Andrade RAP, Dias C, et al. Analysis of a non-invasive intracranial pressure monitoring method in patients with traumatic brain injury. Acta Neurochir Suppl. 2018;126:107–110. doi:10.1007/978-3-319-65798-1_23
14. Ballestero MFM, Frigieri G, Cabella BCT, de Oliveira SM, de Oliveira RS. Prediction of intracranial hypertension through noninvasive intracranial pressure waveform analysis in pediatric hydrocephalus. Childs Nerv Syst. 2017;33(9):1517–1524. doi:10.1007/s00381-017-3475-1
15. Rossi DM, Bevilaqua-Grossi D, Mascarenhas S, et al. Noninvasive intracranial pressure monitoring in women with migraine. Sci Rep. 2022;12(1):2635. doi:10.1038/s41598-022-06258-9
16. Dhar R, Sandler RH, Manwaring K, Kostick N, Mansy HA. Noninvasive detection of elevated ICP using spontaneous tympanic membrane pulsation. Sci Rep. 2021;11(1):21957. doi:10.1038/s41598-021-01079-8
17. Kostick N, Manwaring K, Dhar R, Sandler R, Mansy H. The “brain stethoscope”: a non-invasive method for detecting elevated intracranial pressure. Cureus. 2021;13(3):e13865. doi:10.7759/cureus.13865
18. Brasil S, Frigieri G, Taccone FS, et al. Noninvasive intracranial pressure waveforms for estimation of intracranial hypertension and outcome prediction in acute brain-injured patients. J Clin Monit Comput. 2022:1–8. doi:10.1007/s10877-022-00941-y
19. Brasil S, Solla DJF, Nogueira RC, Teixeira MJ, Malbouisson LMS, Paiva WDS. A novel noninvasive technique for intracranial pressure waveform monitoring in critical care. J Pers Med. 2021;11(12). doi:10.3390/jpm11121302
20. Herklots MW, Moudrous W, Oldenbeuving A, et al. Prospective evaluation of noninvasive HeadSense intracranial pressure monitor in traumatic brain injury patients undergoing invasive intracranial pressure monitoring. World Neurosurg. 2017;106:557–562. doi:10.1016/j.wneu.2017.07.022
21. Evensen KB, Eide PK. Measuring intracranial pressure by invasive, less invasive or non-invasive means: limitations and avenues for improvement. Fluids Barriers CNS. 2020;17(1):34. doi:10.1186/s12987-020-00195-3
22. Ruesch A, Yang J, Schmitt S, Acharya D, Smith MA, Kainerstorfer JM. Estimating intracranial pressure using pulsatile cerebral blood flow measured with diffuse correlation spectroscopy. Biomed Opt Express. 2020;11(3):1462–1476. doi:10.1364/BOE.386612
23. Tabassum S, Ruesch A, Acharya D, et al. Clinical translation of noninvasive intracranial pressure sensing with diffuse correlation spectroscopy. J Neurosurg. 2022:1–10. doi:10.3171/2022.9.JNS221203
24. Fischer JB, Ghouse A, Tagliabue S, et al. Non-invasive estimation of intracranial pressure by diffuse optics: a proof-of-concept study. J Neurotrauma. 2020;37(23):2569–2579. doi:10.1089/neu.2019.6965
25. Themelis G, D’Arceuil H, Diamond SG, et al. Near-infrared spectroscopy measurement of the pulsatile component of cerebral blood flow and volume from arterial oscillations. J Biomed Opt. 2007;12(1):014033. doi:10.1117/1.2710250
26. Milej D, Abdalmalak A, Rajaram A, St Lawrence K. Direct assessment of extracerebral signal contamination on optical measurements of cerebral blood flow, oxygenation, and metabolism. Neurophotonics. 2020;7(4):045002. doi:10.1117/1.NPh.7.4.045002
27. Ruesch A, Schmitt S, Yang J, Smith MA, Kainerstorfer JM. Fluctuations in intracranial pressure can be estimated non-invasively using near-infrared spectroscopy in non-human primates. J Cereb Blood Flow Metab. 2020;40(11):2304–2314. doi:10.1177/0271678X19891359
28. Abay TY, Phillips JP, Uff C, Roldan M, Kyriacou PA. In vitro evaluation of a non-invasive photoplethysmography based intracranial pressure sensor. Appl Sci. 2023;13(1). doi:10.3390/app13010534
29. Dixon B, MacLeod DB. Assessment of a non invasive brain oximeter in volunteers undergoing acute hypoxia. Med Devices. 2020;13:183–194. doi:10.2147/MDER.S250102
30. Dixon B, Turner R, Christou C. Assessment of a non-invasive brain oximeter in a sheep model of acute brain injury. Med Devices. 2019;12:479–487. doi:10.2147/MDER.S235804
31. Cardoso ER, Rowan JO, Galbraith S. Analysis of the cerebrospinal fluid pulse wave in intracranial pressure. J Neurosurg. 1983;59(5):817–821. doi:10.3171/jns.1983.59.5.0817
32. Hirai O, Handa H, Ishikawa M, Kim SH. Epidural pulse waveform as an indicator of intracranial pressure dynamics. Surg Neurol. 1984;21(1):67–74. doi:10.1016/0090-3019(84)90404-X
33. Hirai O, Handa H, Ishikawa M, Kim SH, Yoshida S. Changes in intracranial pressure and epidural pulse waveform following cold injury. Acta Neurochir. 1985;77(1–2):14–21. doi:10.1007/BF01402300
34. Gagnon L, Sakadzic S, Lesage F, et al. Quantifying the microvascular origin of BOLD-fMRI from first principles with two-photon microscopy and an oxygen-sensitive nanoprobe. J Neurosci. 2015;35(8):3663–3675. doi:10.1523/JNEUROSCI.3555-14.2015
35. Havlicek M, Uludag K. A dynamical model of the laminar BOLD response. Neuroimage. 2020;204:116209. doi:10.1016/j.neuroimage.2019.116209
36. Hua J, Liu P, Kim T, et al. MRI techniques to measure arterial and venous cerebral blood volume. Neuroimage. 2019;187:17–31. doi:10.1016/j.neuroimage.2018.02.027
37. Weber B, Keller AL, Reichold J, Logothetis NK. The microvascular system of the striate and extrastriate visual cortex of the macaque. Cereb Cortex. 2008;18(10):2318–2330. doi:10.1093/cercor/bhm259
38. van Raaij ME, Lindvere L, Dorr A, et al. Quantification of blood flow and volume in arterioles and venules of the rat cerebral cortex using functional micro-ultrasound. Neuroimage. 2012;63(3):1030–1037. doi:10.1016/j.neuroimage.2012.07.054
39. Greitz D, Wirestam R, Franck A, Nordell B, Thomsen C, Stahlberg F. Pulsatile brain movement and associated hydrodynamics studied by magnetic resonance phase imaging. The Monro-Kellie doctrine revisited. Neuroradiology. 1992;34(5):370–380. doi:10.1007/BF00596493
40. Soellinger M, Ryf S, Boesiger P, Kozerke S. Assessment of human brain motion using CSPAMM. J Magn Reson Imaging. 2007;25(4):709–714. doi:10.1002/jmri.20882
41. Britt RH, Rossi GT. Quantitative analysis of methods for reducing physiological brain pulsations. J Neurosci Methods. 1982;6(3):219–229. doi:10.1016/0165-0270(82)90085-1
42. Duvernoy HM. Cortical Veins of the Human Brain. Springer Vienna; 1983:3–38.
43. Murthy IS, Rangaraj MR. New concepts for PVC detection. IEEE Trans Biomed Eng. 1979;26(7):409–416. doi:10.1109/tbme.1979.326420
44. Brasil S, Solla DJF, Nogueira RC, Jacobsen Teixeira M, Malbouisson LMS, Paiva WS. Intracranial compliance assessed by intracranial pressure pulse waveform. Brain Sci. 2021;11(8):971. doi:10.3390/brainsci11080971
45. Smits M, Dippel DW, Steyerberg EW, et al. Predicting intracranial traumatic findings on computed tomography in patients with minor head injury: the CHIP prediction rule. Ann Intern Med. 2007;146(6):397–405. doi:10.7326/0003-4819-146-6-200703200-00004
46. Ellis T, McNames J, Aboy M. Pulse morphology visualization and analysis with applications in cardiovascular pressure signals. IEEE Trans Biomed Eng. 2007;54(9):1552–1559. doi:10.1109/TBME.2007.892918
47. Relander FAJ, Ruesch A, Yang J, et al. Using near-infrared spectroscopy and a random forest regressor to estimate intracranial pressure. Neurophotonics. 2022;9(4):045001. doi:10.1117/1.NPh.9.4.045001
48. Wilson MH. Monro-Kellie 2.0: the dynamic vascular and venous pathophysiological components of intracranial pressure. J Cereb Blood Flow Metab. 2016;36(8):1338–1350. doi:10.1177/0271678X16648711
49. McAvoy J, Jaffe R, Brock-Utne J, Lopez J, Brodt J. Cerebral oximetry fails as a monitor of brain perfusion in cardiac surgery: a case report. A A Pract. 2019;12(11):441–443. doi:10.1213/XAA.0000000000000963
50. Greenberg S, Murphy G, Shear T, et al. Extracranial contamination in the INVOS 5100C versus the FORE-SIGHT ELITE cerebral oximeter: a prospective observational crossover study in volunteers. Can J Anaesth. 2016;63(1):24–30. doi:10.1007/s12630-015-0451-7
51. Kato S, Yoshitani K, Kubota Y, Inatomi Y, Ohnishi Y. Effect of posture and extracranial contamination on results of cerebral oximetry by near-infrared spectroscopy. J Anesth. 2017;31(1):103–110. doi:10.1007/s00540-016-2275-1
52. Buell T, Ding D, Raper D, et al. Resolution of venous pressure gradient in a patient with idiopathic intracranial hypertension after ventriculoperitoneal shunt placement: a proof of secondary cerebral sinovenous stenosis. Surg Neurol Int. 2021;12:14. doi:10.25259/SNI_700_2020
53. Lazzaro MA, Darkhabani Z, Remler BF, et al. Venous sinus pulsatility and the potential role of dural incompetence in idiopathic intracranial hypertension. Neurosurgery. 2012;71(4):877–883. doi:10.1227/NEU.0b013e318267a8f9
54. Qureshi AI, Qureshi MH, Majidi S, Gilani WI, Siddiq F. Dural venous sinuses distortion and compression with supratentorial mass lesions: a mechanism for refractory intracranial hypertension? J Vasc Interv Neurol. 2014;7(1):35–42.
55. Kasprowicz M, Lalou DA, Czosnyka M, Garnett M, Czosnyka Z. Intracranial pressure, its components and cerebrospinal fluid pressure-volume compensation. Acta Neurol Scand. 2016;134(3):168–180. doi:10.1111/ane.12541
56. Eide PK. Comparison of simultaneous continuous intracranial pressure (ICP) signals from ICP sensors placed within the brain parenchyma and the epidural space. Med Eng Phys. 2008;30(1):34–40. doi:10.1016/j.medengphy.2007.01.005
57. Raabe A, Totzauer R, Meyer O, Stockel R, Hohrein D, Schoche J. Reliability of epidural pressure measurement in clinical practice: behavior of three modern sensors during simultaneous ipsilateral intraventricular or intraparenchymal pressure measurement. Neurosurgery. 1998;43(2):306–311. doi:10.1097/00006123-199808000-00073
58. Nornes H, Sundbarg G. Simultaneous recording of the ventricular fluid pressure and the epidural pressure. Eur Neurol. 1972;7(6):364–372. doi:10.1159/000114440
59. Childs C, Shen L. Regional pressure and temperature variations across the injured human brain: comparisons between paired intraparenchymal and ventricular measurements. Crit Care. 2015;19:267. doi:10.1186/s13054-015-0982-x
60. Wolfla CE, Luerssen TG, Bowman RM, Putty TK. Brain tissue pressure gradients created by expanding frontal epidural mass lesion. J Neurosurg. 1996;84(4):642–647. doi:10.3171/jns.1996.84.4.0642
61. Robertson CS, Narayan RK, Contant CF, et al. Clinical experience with a continuous monitor of intracranial compliance. J Neurosurg. 1989;71(5 Pt 1):673–680. doi:10.3171/jns.1989.71.5.0673
62. Brasil S. Intracranial pressure pulse morphology: the missing link? Intensive Care Med. 2022;48(11):1667–1669. doi:10.1007/s00134-022-06855-2
63. Germon K. Interpretation of ICP pulse waves to determine intracerebral compliance. J Neurosci Nurs. 1988;20(6):344–351. doi:10.1097/01376517-198812000-00004
 © 2023 The Author(s). This work is published and licensed by Dove Medical Press Limited. The
full terms of this license are available at https://www.dovepress.com/terms
and incorporate the Creative Commons Attribution
- Non Commercial (unported, 3.0) License.
By accessing the work you hereby accept the Terms. Non-commercial uses of the work are permitted
without any further permission from Dove Medical Press Limited, provided the work is properly
attributed. For permission for commercial use of this work, please see paragraphs 4.2 and 5 of our Terms.
© 2023 The Author(s). This work is published and licensed by Dove Medical Press Limited. The
full terms of this license are available at https://www.dovepress.com/terms
and incorporate the Creative Commons Attribution
- Non Commercial (unported, 3.0) License.
By accessing the work you hereby accept the Terms. Non-commercial uses of the work are permitted
without any further permission from Dove Medical Press Limited, provided the work is properly
attributed. For permission for commercial use of this work, please see paragraphs 4.2 and 5 of our Terms.