Back to Journals » Therapeutics and Clinical Risk Management » Volume 13
Are adipocytokines inflammatory or metabolic mediators in patients with inflammatory bowel disease?
Authors Kahraman R ![]() , Calhan T
, Calhan T ![]() , Sahin A
, Sahin A ![]() , Ozdil K, Caliskan Z, Bireller ES, Cakmakoglu B
, Ozdil K, Caliskan Z, Bireller ES, Cakmakoglu B ![]()
Received 27 April 2017
Accepted for publication 20 August 2017
Published 30 September 2017 Volume 2017:13 Pages 1295—1301
DOI https://doi.org/10.2147/TCRM.S140618
Checked for plagiarism Yes
Review by Single anonymous peer review
Peer reviewer comments 3
Editor who approved publication: Professor Garry Walsh
Resul Kahraman,1 Turan Calhan,1 Abdurrahman Sahin,1 Kamil Ozdil,1 Zuhal Caliskan,1 Elif Sinem Bireller,2 Bedia Cakmakoglu3
1Department of Gastroenterology, Umraniye Education and Training Hospital, Health Sciences University, 2Department of Pharmaceutical Microbiology, Faculty of Pharmacy, Istanbul Yeni Yuzyil University, 3Department of Molecular Medicine, Aziz Sancar Institute of Experimental Medicine, Istanbul University, Istanbul, Turkey
Abstract: This study examined the adiponectin and leptin levels and insulin resistance (IR) in patients with inflammatory bowel disease (IBD) and the associations between these factors and IBD characteristics. Fasting serum leptin, adiponectin, glucose, and insulin levels, as well as inflammatory parameters, were measured in 105 patients with IBD (49 patients with Crohn’s disease [CD], 56 patients with ulcerative colitis [UC]) and 98 healthy controls [HC]. IR was evaluated using the Homeostatic Model Assessment of Insulin Resistance (HOMA-IR). Disease activity and severity in patients with UC were evaluated using the Truelove–Witts index, and patients with CD were evaluated using the Crohn’s Disease Activity Index. Serum adiponectin levels were found to be significantly lower in patients with CD and UC (p<0.001). Serum leptin levels were also found to be significantly higher in both the UC and CD groups (p<0.001). When HOMA-IR levels were compared, no significant difference was detected for either the CD or UC groups compared with the controls. In conclusion, it was shown that leptin levels increased and adiponectin levels decreased in patients with IBD, which is thought to be related to chronic inflammation. The effects of adipocytokines in patients with IBD with inflammatory and metabolic processes need to be investigated in further broader studies.
Keywords: ulcerative colitis, Crohn’s disease, insulin resistance, adiponectin, leptin
Introduction
Inflammatory bowel diseases (IBDs) are chronic inflammatory diseases of the gastrointestinal tract.1 Crohn’s disease (CD) and ulcerative colitis (UC) are the main forms of IBD. Chronic inflammation plays a significant role in the development of insulin resistance (IR), metabolic syndrome (MS), and diabetes via various inflammatory mediators and adipocytokines, including adiponectin and leptin.2–4 In recent years, it has been found that adipose tissue actively participates in local and systemic immune responses via molecules called adipocytokines secreted by adipose tissue. Activation of inflammatory cells located in visceral adipose tissue, namely, macrophages, and secretion of adipocytokines such as leptin, adiponectin, and tumor necrosis factor-alpha (TNF-α) have been found to activate inflammatory pathways, which leads to the development of IR, steatohepatitis, and atherosclerosis.5,6 Mesenteric visceral adipose tissue hyperplasia, also known as creeping fat, is a pathognomonic finding of CD. These mesenteric fat deposits are secondary to intestinal inflammation and increased by inflammatory cytokines such as TNF-α, inflammatory cells such as macrophages, and preadipocytes.7
The first investigated adipocytokine associated with intestinal inflammation was leptin. In experimental colitis models, intestinal inflammation was significantly reduced in leptin-deficient (ob/ob) mice.8 On the other hand, intrarectal leptin administration has been shown to cause mucosal inflammation in mice.9 It has been shown in experimental studies that leptin has an important function in many autoimmune diseases as a proinflammatory cytokine.10 Leptin, together with interleukin 1 alpha (IL-1α), TNF-α, and interleukin 6 (IL-6), plays an active role in inflammatory processes.11 Another function of leptin is to regulate food intake and energy balance. It has been shown that a lack of leptin or leptin resistance was correlated with the development of obesity, IR, and diabetes.12
Adiponectin, another important adipocytokine synthesized in large quantities from adipocytes, has anti-inflammatory effects. In the experimental colitis model, adiponectin (−/−) mice showed a significant increase in colitis severity due to adiponectin deficiency, which suggested possible protective effects of adiponectin against colitis.13 Studies in humans have reported conflicting results about systemic serum levels of adiponectin in patients with IBD. Some authors reported that serum adiponectin levels decrease in patients with IBD,14,15 whereas others reported no change or increased levels.16–18
Adiponectin also plays a significant role in energy homeostasis. Adiponectin is involved in glucose regulation and fatty acid catabolism. It decreases gluconeogenesis and increases glucose uptake in cells, beta oxidation, and fat clearance. Lower serum adiponectin levels are associated with IR and metabolic diseases in the general population.19 Adiponectin may be regarded as a potential biomarker of MS.20 It has been shown that cytokines lead to decreased adiponectin expression in fat tissue.
IR is a factor that has significance in the development of atherosclerosis; it forms the basis for the development of MS and diabetes and indirectly affects morbidity and mortality. This study assessed the serum adiponectin and leptin levels and IR in adult patients with IBD and the associations between these factors and characteristics of IBD.
Patients and methods
Patient population
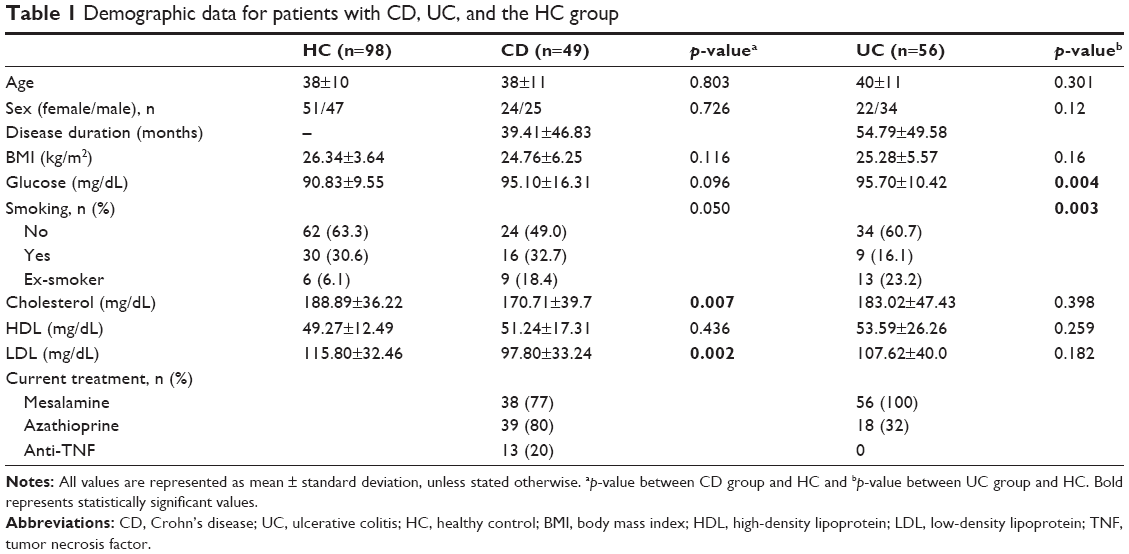
A total of 105 patients who were followed up after being diagnosed as having IBD (56 with UC [(22 females and 34 males)], mean age 40±11 years; 49 with CD [24 females and 25 males], mean age 38±11 years) and 98 healthy controls [HC], who had similar baseline demographic values, were enrolled in the study. Patients with diabetes mellitus, thyroid diseases, chronic obstructive pulmonary disease (COPD), coronary heart disease, malignant hypertension, or renal failure; those receiving hormone replacement therapy or corticosteroids in the past 6 months; who were pregnant; or those with liver cirrhosis were excluded. After obtaining written informed consent from the participants and approval from Istanbul University’s ethics committee (2012-4873), the study was conducted in accordance with the Declaration of Helsinki. Disease activity and severity were evaluated using the Truelove–Witts (TW) index in patients with UC and the Crohn’s Disease Activity Index (CDAI) in patients with CD. There were no patients with severe active colitis among patients with UC. Crohn’s patients were divided into two groups as CDAI <150 and CDAI ≥150 in terms of activity index. There were no patients with CDAI >450. Patients with UC were divided into two groups according to extension: left-sided, determined as limited distal of the splenic flexure, and extensive involvement exceeding the splenic flexure. Patients with CD were divided into two groups as ileal CD and ileocolonic CD.
Laboratory analysis
Blood samples were taken from antecubital vein using 20-gage needles between 8:30–10:30 am after fasting for 8–12 hours. The levels of glucose, insulin, cholesterol, triglyceride, low-density lipoprotein (LDL), high-density lipoprotein (HDL), very-low-density lipoprotein (VLDL), complete blood count, sedimentation, C-reactive protein (CRP), and hemoglobin A1c (HbA1c) levels were studied on the same day. Blood samples taken for the measurement of adiponectin were centrifuged for 6 minutes at 5,000 rpm, and the obtained 1–2 mL serum samples were stored at −80°C. All materials used during the study were in compliance with the specifications of kits identified in the operation manual, and the steps in the operating manual were carefully observed while performing each test. Serum adiponectin and leptin levels were evaluated by commercial enzyme-linked immunosorbent assay (ELISA) kits (AssayMax Human ELISA, AssayPro, St Charles, MO, USA).
Assessing IR
IR was calculated in the patient and HC group. The Homeostatic Model Assessment of Insulin Resistance (HOMA-IR) index was used to assess IR. The HOMA-IR formula used is as follows: HOMA-IR = fasting plasma glucose (mmol/L) × fasting plasma insulin (mU/L)/22.5. HOMA ≥2.5 was accepted as IR.21
Statistical methods
All data obtained at the end of the study were analyzed using the Statistical Package for the Social Sciences (SPSS), version 20 (IBM Corporation, Armonk, NY, USA). The analysis of variance (ANOVA) test and Student’s t-test were used to compare averages of variables in more than two groups. The calculation of differences between sexes was made using the chi-square test. For the assessment of correlation between the variables, Pearson’s and Spearman’s correlation analyses were conducted for parametric and nonparametric variables, respectively. A p-value of <0.05 was considered as statistically significant. The Shapiro–Wilk test and Kolmogorov–Smirnov test were used to evaluate the distribution of the variables. Categorical variables were presented as frequencies and percentages. Normally distributed continuous variables are expressed as mean ± standard deviation, and skewed distributed continuous variables are expressed as median (interquartile range).
Results
The demographic and laboratory data of patients with CD and UC and HC are presented in Table 1. When the patient and control groups were compared, there was no difference in terms of age, sex, or body mass index (BMI). In the UC group, serum glucose levels were found to be significantly higher than that of the control group (p=0.004), however in the CD group, cholesterol and LDL levels were found to be significantly lower than that of the control group (p=0.007, p=0.002 respectively, Table 1).
 | Table 1 Demographic data for patients with CD, UC, and the HC group |
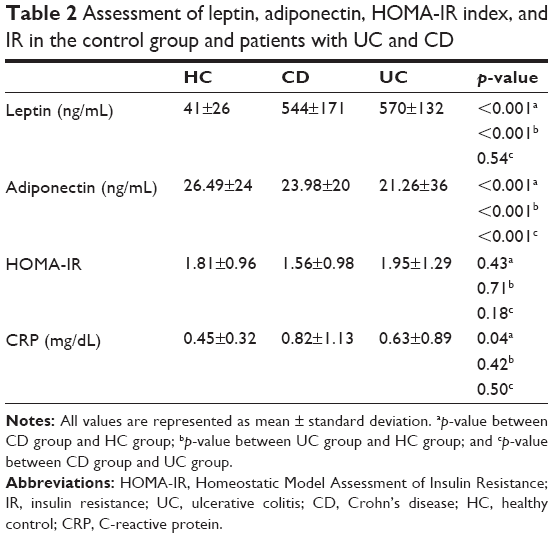
Assessment of leptin, adiponectin, and HOMA-IR index in the study groups is shown in Table 2. CRP levels were significantly higher in patients with CD compared with the control group (p=0.04, Table 2). Serum adiponectin levels were found to be significantly lower both in patients with CD and UC compared with the HC (p<0.001; Figure 1). Serum leptin levels were also found to be significantly higher in both the UC and CD groups compared with the HC group (p<0.001; Figure 2). When HOMA-IR levels were compared, no significant difference was detected for either the CD or UC group compared with the HC. The HOMA-IR index and BMI were clearly correlated (r=0.43, p<0.001 and r=0.43, p<0.001, respectively) in the IBD and control groups.
 | Table 2 Assessment of leptin, adiponectin, HOMA-IR index, and IR in the control group and patients with UC and CD |
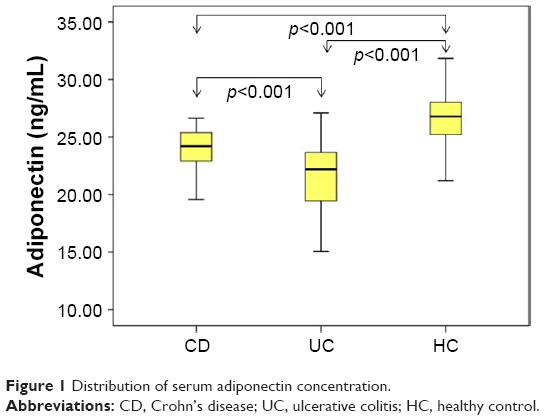 | Figure 1 Distribution of serum adiponectin concentration. |
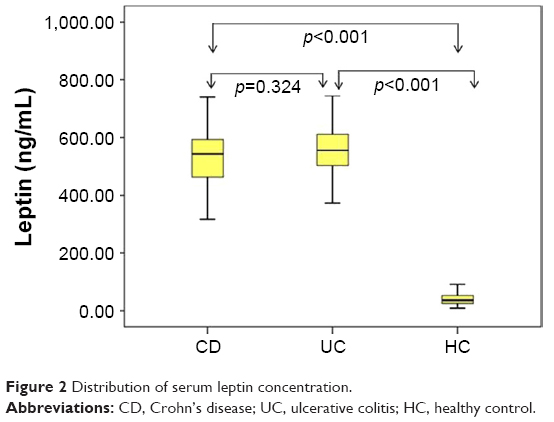 | Figure 2 Distribution of serum leptin concentration. |
Serum leptin, adiponectin, and HOMA-IR index were assessed for patients with UC and CD with normal and high CRP levels, and no significant difference was found (Table 3).
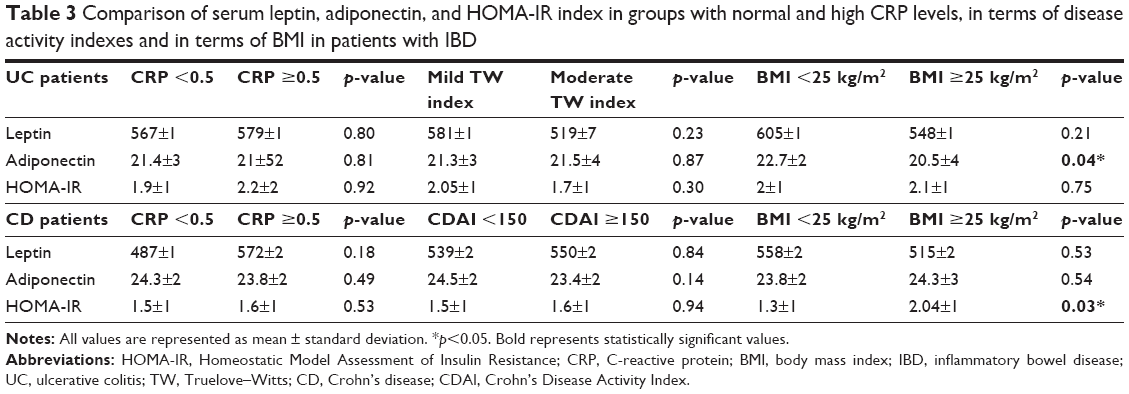 | Table 3 Comparison of serum leptin, adiponectin, and HOMA-IR index in groups with normal and high CRP levels, in terms of disease activity indexes and in terms of BMI in patients with IBD |
In UC patients, serum adiponectin levels were significantly higher in patients with BMI <25 kg/m2 than BMI ≥25 kg/m2 (p=0.04). In CD patients, HOMA-IR levels were significantly increased in patients with BMI ≥25 kg/m2 compared with those of BMI <25 (p=0.03, Table 3).
Disease activity and IR, HOMA-IR index, leptin, and adiponectin were assessed according to the disease activity in UC as mild and moderate TW index; no significant correlation with disease activity was detected. When patients with CD who had CDAI values <150 and ≥150 were compared in terms of adiponectin, leptin, and the HOMA-IR index, no significant difference was found (Table 3).
When patients with UC were divided into two groups according to localization as limited to the distal of splenic flexure (proctitis: 5, rectosigmoiditis: 15, left side: 12; n=32) and exceeding the splenic flexure (extensive: 4, pancolitis: 19; n=23), no significant difference was noted regarding serum leptin level (551±116 vs 590±150; p=0.38), adiponectin level (21.57±36 vs 20.80±38; p=0.53), and the HOMA-IR index (1.93±1.02 vs 2.09±1.60; p=0.85) between the two groups (data not shown).
Similarly, when patients with CD were divided into two groups according to the involvement areas as ileal involvement (n=21) and ileocolonic involvement (n=28), no significant difference was found in terms of serum leptin (526±155 vs 570±180; p=0.46), adiponectin (24.31±16 vs 23.78±22; p=0.46), and the HOMA-IR index (1.49±1.10 vs 1.56±0.95; p=0.82; data not shown).
In both IBD and control groups, HOMA-IR was found to be significantly correlated with BMI (r=0.43, p<0.001 and r=0.43, p<0.001, respectively). However, the HOMA-IR score was not found to be associated with adipocytokine levels (data not shown).
Discussion
In this study, it was shown that serum adiponectin levels in adult patients with IBD were significantly lower than those in the HC group. Adiponectin levels in patients with UC were also significantly lower than those in patients with CD. As another important adipocytokine, serum leptin levels were found significantly higher in both the UC and CD groups than in the HC group. When patients with IBD were evaluated for serum leptin levels, adiponectin levels, and HOMA-IR index, no significant correlation was found between disease localization and disease activity.
Capristo et al22 first reported that entire body glucose uptake and oxidation were similar in patients with IBD, irrespective of disease activity. In the study by Nagahori et al,23 MS prevalence in Japanese patients with IBD was found to be considerably higher in patients with UC compared with patients with CD. In the study by Yorulmaz et al,24 the incidence of MS was found to be higher in patients with UC than in patients with CD. In our study, the incidence of IR in patients with UC was 21% and in those with CD was 18%. There were no significant differences between the IBD subgroups and control group.
In a study by Chouliaras et al17 in which glucose metabolism and adipocytokines were assessed for pediatric patients with UC and CD, it was reported that IR was considerably higher in patients with both UC and CD. Bregenzer et al25 assessed IR and β-cell activity using the HOMA-IR test in 17 patients with CD, and IR was detected higher in the patient group compared with the control group. It was thought that IR could be correlated with chronic inflammation.
Dagli et al26 assessed risk factors in IBD regarding atherosclerotic diseases and included 40 patients with IBD and 40 controls in their study. In patients with IBD, carotid artery stiffness, CRP, HOMA-IR, and homocysteine were found to be considerably higher compared with the control group. In our study, the HOMA-IR index was found to be significantly higher in patients with BMI ≥25 kg/m2 in both groups and the control group. In the UC group, serum adiponectin levels were higher in patients with BMI <25 kg/m2 compared with patients who had BMI ≥25 kg/m2. Higher IR and lower serum adiponectin levels were the expected findings in patients who were overweight–obese. However, in our study, the absence of significant elevations in the IR index may be due to the absence of patients with severe active disease.
In experimental models, a decrease in adiponectin levels was demonstrated to be associated with the development of IR and diabetes.27 Serum adiponectin was also regarded as a biomarker of MS, and it was shown that a decrease in serum adiponectin level led to an increase in IR and was an independent predictor for the development of diabetes.28–31
In the study by Valentini et al, 44 patients with UC and 49 patients with CD were examined and IR and adiponectin levels were evaluated. In their study, serum adiponectin levels were found to be significantly lower in the patient group compared with the HC group and hyperinsulinemia was detected.14
Adiponectin has been demonstrated in experimental animal studies in relation to intestinal inflammation. In an experimental colitis model, it was shown that the severity of colitis was significantly increased in adiponectin-deficient mice and that adiponectin had protective effects against colitis.13,32 In contrast, another study showed that the experimental colitis model regulates inflammatory cytokines but does not affect disease severity.33
Yamamoto et al34 found that adiponectin expression in mesenteric fat tissues increased in patients with CD. On the other hand, Rodrigues et al15 showed that adiponectin levels significantly decreased in patients with active CD, but adiponectin levels did not change in those in remission. Weigert et al35 found higher adiponectin levels in patients with UC than in those with CD and HC. Adiponectin levels were found to be similar for all three groups (UC, CD, and HC) in the studies of Karmiris et al18 and Waluga et al.16 In our study, serum adiponectin levels were detected to be significantly lower in patients with CD and UC compared with those in the control group. Although serum adiponectin levels decreased in the entire IBD group, the decrease was more notable in patients with UC than in patients with CD. As mentioned in the earlier studies, serum adiponectin levels are variable in patients with IBD and their role in the pathogenesis of the disease is still unclear.
Leptin has metabolic, endocrinologic, and also immunologic effects. Leptin stimulates T lymphocytes by regulating the release of various cytokines. The direct role assumed by leptin in intestinal inflammation was indicated in experimental models.10 Leptin mRNA overexpression in mesenteric adipose tissue was found in patients with IBD.36 Leptin receptors were detected in inflamed colonic epithelium of patients with IBD, and leptin levels were found to be considerably high.37 It was indicated in another study that colonic lavage leptin concentrations were 15 times higher in patients with UC and CD compared with the control group. It has also been demonstrated that the increase in leptin level was correlated with severity of disease and inversely correlated with the number of T regulator cells.9 Tuzun et al38 showed that leptin levels were substantially higher in patients with active UC. On the other hand, Waluga et al16 found that leptin levels were very high in patients with CD during the posttreatment period. In our study, leptin levels were also detected to be higher both in patients with UC and CD. It was found to be high in both mild-to-moderate active patients, independent of disease activity. However, leptin levels were reported to be lower in the study by Karmiris et al.18 In the study of Nishi et al,39 there was no significant difference in leptin levels in patients with CD compared with those in the control group. Similarly, in the study by Rodrigues et al,15 leptin levels in patients with CD did not change. In a recently published study by Ghomraoui et al,40 leptin levels were found to be lower in patients with IBD compared with those in the control group, but no significant difference in leptin levels was found between the control group and patients with IBD. These conflicting results regarding leptin levels merit further studies on this issue.
Conclusion
A significant increase in leptin levels and a decrease in adiponectin levels were found in patients with IBD. These findings suggest that adipocytokines may play a role in inflammatory and metabolic processes in patients with IBD. Further studies are needed to investigate the possible effects of adipocytokines on inflammatory and metabolic processes in patients with IBD.
Disclosure
The authors report no conflicts of interest in this work.
References
Sanchez-Munoz FA, Dominguez-Lopez A, Yamamoto-Furusho JK. Role cytokines in inflammatory bowel disease. World J Gastroenterol. 2008;14(27):4280–4288. | ||
Reaven GM. Banting lecture 1988. Role of insulin resistance in human disease. Diabetes. 1988;37(12):1595–1607. | ||
Hotamisligil GS, Peraldi P, Budavari A, Ellis R, White MF, Spiegelman BM. IRS-1-mediated inhibition of insulin receptor tyrosine kinase activity in TNF-alpha- and obesity-induced insulin resistance. Science. 1996;271(5249):665–668. | ||
Sethi JK, Hotamisligil GS. The role of TNF alpha in adipocyte metabolism. Semin Cell Dev Biol. 1999;10(1):19–29. | ||
Tilg H, Moschen AR. Inflammatory mechanisms in the regulation of insulin resistance. Mol Med. 2008;14(3–4):222–231. | ||
Al-Dokhi LM. Adipokines and etiopathology of metabolic disorders. Saudi Med J. 2009;30(9):1123–1132. | ||
Kredel LI, Siegmund B. Adipose-tissue and intestinal inflammation – visceral obesity and creeping fat. Front Immunol. 2014;5:462. | ||
Siegmund B, Lehr HA, Fantuzzi G. Leptin: a pivotal mediator of intestinal inflammation in mice. Gastroenterology. 2002;122(7):2011–2025. | ||
Sitaraman S, Liu X, Charrier L, et al. Colonic leptin: source of a novel proinflammatory cytokine involved in IBD. FASEB J. 2004;18(6):696–698. | ||
Otero M, Lago R, Gomez R, et al. Towards a pro-inflammatory and immunomodulatory emerging role of leptin. Rheumatology. 2006;45(8):944–950. | ||
Grunfeld C, Zhao C, Fuller J, et al. Endotoxin and cytokines induce expression of leptin, the ob gene product, in hamsters. J Clin Invest. 1996;97(9):2152–2157. | ||
Platt TL, Beckett TL, Kohler K, Niedowicz DM, Murphy MP. Obesity, diabetes, and leptin resistance promote tau pathology in a mouse model of disease. Neuroscience. 2016;315:162–174. | ||
Nishihara T, Matsuda M, Araki H, et al. Effect of adiponectin on murine colitis induced by dextran sulfate sodium. Gastroenterology. 2006;131(3):853–861. | ||
Valentini L, Wirth EK, Schweizer U, et al. Circulating adipokines and the protective effects of hyperinsulinemia in inflammatory bowel disease. Nutrition. 2009;25(2):172–181. | ||
Rodrigues VS, Milanski M, Fagundes JJ, et al. Serum levels and mesenteric fat tissue expression of adiponectin and leptin in patients with Crohn’s disease. Clin Exp Immunol. 2012;170(3):358–364. | ||
Waluga M, Hartleb M, Boryczka G, Kukla M, Zwirska-Korczala K. Serum adipokines in inflammatory bowel disease. World J Gastroenterol. 2014;20(22):6912–6917. | ||
Chouliaras G, Panayotou I, Margoni D, et al. Circulating leptin and adiponectin and their relation to glucose metabolism in children with Crohn’s disease and ulcerative colitis. Pediatr Res. 2013;74(4):420–426. | ||
Karmiris K, Koutroubakis IE, Xidakis C, Polychronaki M, Voudouri T, Kouroumalis EA. Circulating levels of leptin, adiponectin, resistin, and ghrelin in inflammatory bowel disease. Inflamm Bowel Dis. 2006;12(2):100–105. | ||
Statnick MA, Beavers LS, Conner LJ, et al. Decreased expression of apM1 in omental and subcutaneous adipose tissue of humans with type 2 diabetes. Int J Exp Diabetes Res. 2000;1(2):81–88. | ||
Hug C, Lodish HF. The role of the adipocyte hormone adiponectin in cardiovascular disease. Curr Opin Pharmacol. 2005;5(2):129–134. | ||
Matthews DR, Hosker JP, Rudenski AS, Naylor BA, Treacher DF, Turner RC. Homeostasis model assessment: insulin resistance and beta-cell function from fasting plasma glucose and insulin concentrations in man. Diabetologia. 1985;28(7):412–419. | ||
Capristo E, Mingrone G, Addolorato G, Greco AV, Gasbarrini G. Glucose metabolism and insulin sensitivity in inactive inflammatory bowel disease. Aliment Pharmacol Ther. 1999;13(2):209–217. | ||
Nagahori M, Hyun SB, Totsuka T, et al. Prevalence of metabolic syndrome is comparable between inflammatory bowel disease patients and the general population. J Gastroenterol. 2010;45(10):1008–1013. | ||
Yorulmaz E, Adali G, Yorulmaz H, Ulasoglu C, Tasan G, Tuncer I. Metabolic syndrome frequency in inflammatory bowel diseases. Saudi J Gastroenterol. 2011;17(6):376–382. | ||
Bregenzer N, Hartmann A, Strauch U, Schölmerich J, Andus T, Bollheimer LC. Increased insulin resistance and beta cell activity in patients with Crohn’s disease. Inflamm Bowel Dis. 2006;12(1):53–56. | ||
Dagli N, Poyrazoglu OK, Dagli AF, et al. Is inflammatory bowel disease a risk factor for early atherosclerosis? Angiology. 2010;61(2):198–204. | ||
Hotta K, Funahashi T, Bodkin NL, et al. Circulating concentrations of the adipocyte protein adiponectin are decreased in parallel with reduced insulin sensitivity during the progression to type 2 diabetes in rhesus monkeys. Diabetes. 2001;50(5):1126–1133. | ||
Ryo M, Nakamura T, Kihara S, et al. Adiponectin as a biomarker of the metabolic syndrome. Circ J. 2004;68(11):975–981. | ||
Daimon M, Oizumi T, Saitoh T, et al; Funagata Study. Decreased serum levels of adiponectin are a risk factor for the progression to type 2 diabetes in the Japanese population: the Funagata study. Diabetes Care. 2003;26(7):2015–2020. | ||
Snehalatha C, Mukesh B, Simon M, Viswanathan V, Haffner SM, Ramachandran A. Plasma adiponectin is an independent predictor of type 2 diabetes in Asian Indians. Diabetes Care. 2003;26(12):3226–3229. | ||
Yamauchi T, Kamon J, Waki H, et al. The fat-derived hormone adiponectin reverses insulin resistance associated with both lipoatrophy and obesity. Nat Med. 2001;7(8):941–946. | ||
Saxena A, Fletcher E, Larsen B, Baliga MS, Durstine JL, Fayad R. Effect of exercise on chemically-induced colitis in adiponectin deficient mice. J Inflamm. 2012;21:30. | ||
Gove ME, Pini M, Fayad R, Cabay RJ, Fantuzzi G. Adiponectin deficiency modulates adhesion molecules expression and cytokine production but does not affect disease severity in the transfer model of colitis. Cytokine. 2009;47(2):119–125. | ||
Yamamoto K, Kiyohara T, Murayama Y, et al. Production of adiponectin, an anti-inflammatory protein, in mesenteric adipose tissue in Crohn’s disease. Gut. 2005;54(6):789–796. | ||
Weigert J, Obermeier F, Neumeier M, et al. Circulating levels of chemerin and adiponectin are higher in ulcerative colitis and chemerin is elevated in Crohn’s disease. Inflamm Bowel Dis. 2010;16(4):630–637. | ||
Barbier M, Vidal H, Desreumaux P, et al. Overexpression of leptin mRNA in mesenteric adipose tissue in inflammatory bowel diseases. Gastroenterol Clin Biol. 2003;27:987–991. | ||
Barrenetxe J, Villaro AC, Guembe L, et al. Distribution of the long leptin receptor isoform in brush border, basolateral membrane, and cytoplasm of enterocytes. Gut. 2002;50(6):797–802. | ||
Tuzun A, Uygun A, Yesilova Z, et al. Leptin levels in the acute stage of ulcerative colitis. J Gastroenterol Hepatol. 2004;19(4):429–432. | ||
Nishi Y, Isomoto H, Ueno H, et al. Plasma leptin and ghrelin concentrations in patients with Crohn’s disease. World J Gastroenterol. 2005;11(46):7314–7317. | ||
Ghomraoui FA, Alotaibi ST, Alharthi MA, et al. Plasma ghrelin and leptin in patients with inflammatory bowel disease and its association with nutritional status. Saudi J Gastroenterol. 2017;23(3):199–205. |
 © 2017 The Author(s). This work is published and licensed by Dove Medical Press Limited. The
full terms of this license are available at https://www.dovepress.com/terms
and incorporate the Creative Commons Attribution
- Non Commercial (unported, 3.0) License.
By accessing the work you hereby accept the Terms. Non-commercial uses of the work are permitted
without any further permission from Dove Medical Press Limited, provided the work is properly
attributed. For permission for commercial use of this work, please see paragraphs 4.2 and 5 of our Terms.
© 2017 The Author(s). This work is published and licensed by Dove Medical Press Limited. The
full terms of this license are available at https://www.dovepress.com/terms
and incorporate the Creative Commons Attribution
- Non Commercial (unported, 3.0) License.
By accessing the work you hereby accept the Terms. Non-commercial uses of the work are permitted
without any further permission from Dove Medical Press Limited, provided the work is properly
attributed. For permission for commercial use of this work, please see paragraphs 4.2 and 5 of our Terms.