Back to Journals » International Journal of Chronic Obstructive Pulmonary Disease » Volume 16
Application Value of Broadband 3-Dimensional Impulse Oscillometry in COPD
Authors Tang Z ![]() , Li M
, Li M ![]() , Chu G, Mou Y, Chen Q, Zhu H
, Chu G, Mou Y, Chen Q, Zhu H
Received 11 October 2020
Accepted for publication 7 January 2021
Published 4 February 2021 Volume 2021:16 Pages 215—223
DOI https://doi.org/10.2147/COPD.S285927
Checked for plagiarism Yes
Review by Single anonymous peer review
Peer reviewer comments 2
Editor who approved publication: Prof. Dr. Richard Russell
Zhonghao Tang,1,* Minjing Li,1,* Guokun Chu,1 Yan Mou,1 Qi Chen,2 Huili Zhu1
1Department of Pulmonary Medicine, Huadong Hospital, Fudan University, Shanghai, 200040, People’s Republic of China; 2Department of Pulmonology Medicine, Shuguang Hospital Affiliated to Shanghai University of Traditional Chinese Medicine, Shanghai, 201203, People’s Republic of China
*These authors contributed equally to this work
Correspondence: Huili Zhu
Department of Pulmonary Medicine, Huadong Hospital, Fudan University, Shanghai, 200040, People’s Republic of China
Email [email protected]
Qi Chen
Department of Pulmonology Medicine, Shuguang Hospital Affiliated to Shanghai University of Traditional Chinese Medicine, Shanghai, 201203, People’s Republic of China
Email [email protected]
Objective: To explore the correlation of respiratory resistance in stable COPD patients measured by broadband 3-dimensional impulse oscillometry (3D-IOS) and traditional pulmonary function test (PFT). To access the diagnostic value of 3D-IOS in COPD.
Methods: A total of 107 COPD patients and 61 healthy subjects as controls were chosen to collect and statistically analyze the data of R5, R5–R20, R20, X5 and Fres measured by broadband 3D-IOS and FEV1%pred, FVC%pred and FEV1/FVC by PFTs. The diagnostic value of broadband 3D-IOS parameters in COPD was evaluated by receiver operating characteristic curve (ROC). 3D-colored images used to show dynamic changes of respiratory resistance in COPD.
Results: The COPD group showed significant increases in R5, R20, R5–R20 and Fres, and a decrease in X5 (P< 0.05). With the increase of GOLD grade, R5, R5–R20 and Fres increased whereas X5 decreased (P< 0.05). Compared with FEV1%pred, FVC%pred and FEV1/FVC in the COPD group, R5, R5–R20 and Fres were negatively collated (P< 0.05), whereas X5 was positively collated (P< 0.01). R20 was uncorrelated with the traditional lung function parameters (P> 0.05). Fres and FEV1/FVC (r=− 0.467), and X5 and FEV1%pred (r=0.412) showed the strongest correlation. The AUC of R5, R5–R20, X5 and Fres was 0.7808, 0.7659, 0.8947 and 0.9095, respectively. Typical 3D-colored images of COPD displayed a green pattern in the inhalation phase and yellow–red–blue graduation in the expiration phase.
Conclusion: R5, R5-R20, X5 and Fres measured by broadband 3D-IOS can reflect the change of respiratory resistance in COPD. And they have good correlation with the traditional lung function parameters (FEV1%pred, FVC%pred, FEV1/FVC). Fres has the highest diagnostic accuracy. Comprehensive analysis of R5, R5–R20, Fres and X5 helps to determine the degree of respiratory obstruction in COPD. X5 and Fres can reflect changes in lung tissue compliance. 3D-colored images can visually show the change of respiratory resistance and reactance in COPD.
Keywords: 3-dimensional impulse oscillometry, respiratory resistance, pulmonary function test, chronic obstructive pulmonary disease
Background
COPD is a disease characterized by persistent respiratory symptoms and airflow limitation. There are 99.9 million COPD patients diagnosed by lung function in China, and the prevalence rate is as high as 13.7% in people over 40 years old.1 The World Health Organization predicts that COPD will become the third leading cause of death by 2030.2 At present, the diagnosis of COPD still depends on the traditional PFT which needs patients’ cooperation to conduct powerful exhalation and inhalation motions. In order to obtain the real forced vital capacity, each test lasts for nearly 20–30 minutes, which is not well-tolerated by most elderly or weak people. Moreover, the change of bronchial tension caused by repeated forced breathing may lead to false positive results, especially in elderly patients.3 It is reported that only 30% of patients can perform a PFT that meets all the quality standards defined by ERS/ATS, and the proportion is even lower in the elderly.4,5
Broadband 3D-IOS is a new type of 3D comprehensive assessment system for lung function. It has a broadband 3D pulse module that releases multi-frequency pulse waves in the resolution range from 4 Hz to 36 Hz, and outputs 3D-colored images to show characteristic curves of Rrs and Xrs that change with time and frequency. The technology is based on traditional forced oscillation technology (FOT) principles, and collects respiration reactance by spectrum analysis of the eupnea process under pulse oscillation, which makes it unique from traditional PFT.
In this study, we use a 3D-IOS device to measure the respiratory resistance in stable COPD patients and healthy controls during eupnea. The correlation between respiratory resistance parameters and traditional pulmonary function parameters was statistically analyzed to clarify the clinical application value of the technique.
Method
Object
We collected 132 patients with different degrees of airway obstruction in the outpatient department and ward of the respiratory department of Huadong Hospital from September 2017 to December 2018. According to the following inclusion and exclusion criteria, 107 stable COPD patients (COPD group) were enrolled in the study, including 76 males and 31 females, with an average age of 70.14±8.97 years. Among them there were 16 grade I cases, 58 grade II cases, 28 grade III cases and 5 grade IV cases.
Inclusion Criteria
- Patients aged ≥40 years, both male and female, who were diagnosed with COPD in the past and are currently in a stable stage.
- Newly-diagnosed COPD patients who meet the diagnostic criteria proposed by the 2018 GOLD Guidelines and Diagnosis and Treatment Guidelines for COPD (revised in 2017).6,7 Any patient with dyspnea, chronic cough or expectoration symptoms, and/or with a history of exposure to risk factors should undergo PFT. If FEV1/FVC is less than 70% after inhaling bronchodilators, persistent airflow restriction can be determined, which led to diagnosis as COPD followed by exclusion for other diseases.
- All subjects had no acute respiratory tract infection in the past one month. The COPD patients had no obvious aggravation cough, expectoration, dyspnea and other symptoms.
Exclusion Criteria
- Patients who have lung diseases other than COPD, such as bronchial asthma, pleural effusion, bronchiectasis, interstitial lung disease or lung surgery (history), which affects the pulmonary ventilation function and lung ventilation function.
- Patients who have complications such as locomotor system diseases, serious cardiovascular and cerebrovascular diseases, which can cause the decline of exercise endurance.
- Patients who have diseases causing restrict thoracic movement, such as thoracic deformity and scoliosis.
- Patients who have severe liver or kidney insufficiency, malignant tumor and other poor body conditions.
- Patients who have mental disorders or cognitive disorders, who cannot cooperate in the test.
Control Group
61 healthy subjects in the same period were selected as the control group in accordance with:
- Age ≥40 years, both male and female;
- No history of chronic cardiopulmonary disease;
- No history of respiratory tract infection in the recent one month;
- No dust and other toxic particles exposure history and special occupational history.
This study was conducted in accordance with the Declaration of Helsinki. It was approved by the ethics committee of Huadong Hospital Affiliated to Fudan University. All subjects were informed and agreed to participate.
Instruments and Methods
General Information
The general information of each subject was collected and recorded before the examination, including their date of birth, gender, smoking history, height and weight.
Instruments and Equipment
Traditional PFT system: Masterscreen pulmonary function instrument (Jaeger, Germany)
3D-IOS pulmonary function test system: MostGraph-01 (Chest, Japan)
Preparation
- Before the examination, medicines such as oral glucocorticoids, beta blockers, barbiturates, diazepams, antihistamines and their components were stopped for more than 48 hours;
- Oral administration of long-acting/sustained-release beta agonists or theophylline drugs withdrawal is required for more than 24 hours;
- Corticosteroids and oral short-acting beta agonists or theophylline drugs withdrawal was required for more than 12 hours;
- Short-acting beta agonists or anticholinergic drugs withdrawal was required for more than 6 hours;
- No drinking tea, coffee and alcoholic beverages for at least 6 hours before the test;
- No strenuous exercise or cold air inhalation for at least 2 hours before the test.
Inspection Method
168 subjects (107 COPD patients and 61 healthy controls) were examined for respiratory resistance, and then conventional pulmonary function tests were performed.
Respiratory resistance test: according to the ERS recommended standard.8 The subjects took a seat and clamped their nose with an airway clamp. The subjects must keep their teeth on their jaws, their tongue and lips close to the mouth paper of the spirometer, and thus keep their respiratory tract unobstructed and prevent air leakage. Touch the cheek with both hands to minimize the vibration of it. The subjects kept natural breathing so as to increase oral compliance. After the patients breathe evenly, we start recording at the 45th second, and release the brake after expiratory stop. After an interval of 1 minute, the test was repeated 3–4 times, and the best value was selected.
Traditional PFT: according to the lung function examination standard recommended by the society of respiratory diseases, Chinese Medical Association Determination.9 The test process shall be repeated at least 3 times (generally no more than 8 times at most), with an interval of 10 minutes for each test, and the error is less than 5%. The best curve and data are taken as the final measured value.
Measurement Parameters
Respiratory resistance parameters: respiratory resistance R5 (at 5 Hz) and R20 (at 20 Hz), the subtraction of respiratory resistance at 5 Hz and 20 Hz (R5–R20), reactance X5 (oscillation frequency at 5 Hz) and coseismic frequency (Fres) are obtained.
Traditional pulmonary function parameters: the ratio of forced expiratory volume to forced vital capacity in the first second (FEV1/FVC), the percentage of forced expiratory volume (FEV1% pred) and the percentage of forced vital capacity (FVC) of the predicted value (FVC% pred).
Statistical Methods
We use SPSS 22.0 and GraphpadPrism 6.0 to collate statistics. The single sample K–S test (Kolmogorov–Smirnov test) is adopted in normality test of statistical data, and the chi-square test is used for counting data. Measurement data are recorded in the form of mean±standard deviation (x±s). The t test is used for comparison between two groups, and analysis of variance was used for multi-group comparison. The correlation between respiratory resistance parameters and traditional pulmonary function parameters was analyzed by Spearman bivariate correlation analysis. We use the ROC curve drawn by GraphPadPrism software to analyze the respiratory resistance parameters. To judge the diagnostic value of COPD severity, P<0.05 was defined to be statistically significant.
Results
Basic Information of Research Object
As shown in Table 1, there were 76 males and 31 females with an average age of 70.14±8.97 years. In the healthy control group, there were 41 males and 20 females with an average age of 65.71±11.10 years.
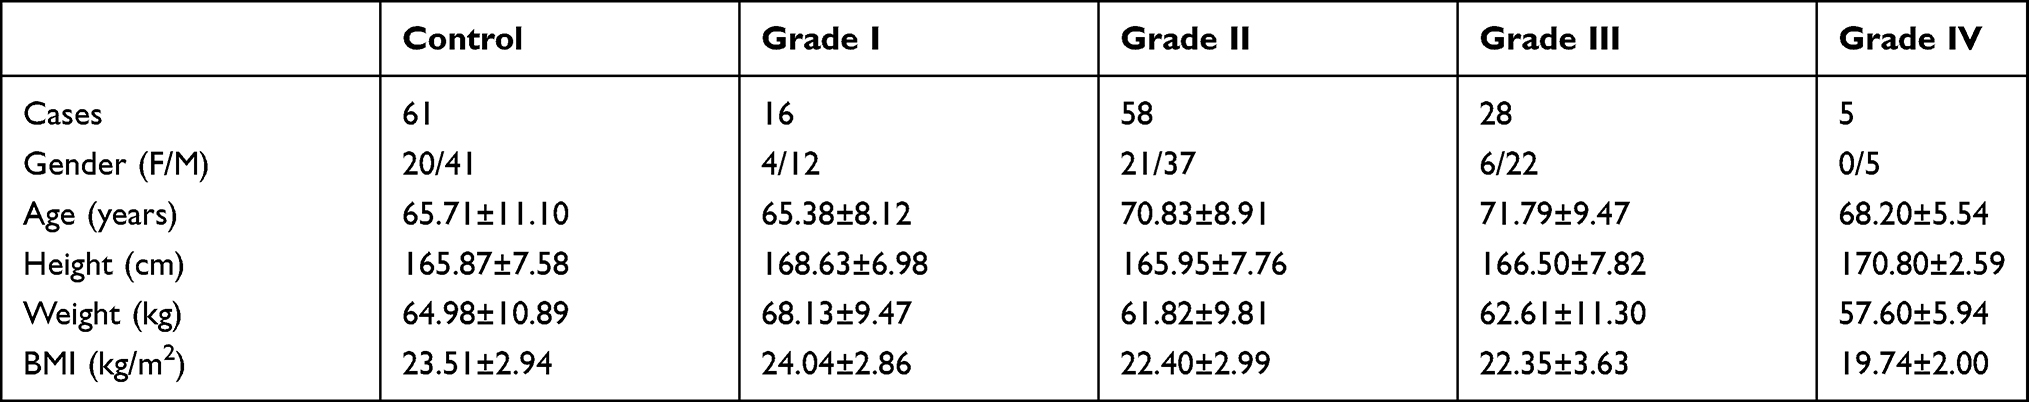 |
Table 1 Basic Information of Research Object |
There was no significant difference in gender, age, height and weight between the two groups (P>0.05).
Comparison of Traditional Pulmonary Function Parameters Between COPD Group and Healthy Control Group
As shown in Table 2, the traditional pulmonary function parameters of the two groups were in normal distribution. FVC% pred, FEV1% pred and FEV1/FVC in the COPD group were significantly different from those in the healthy control group (P<0.05). FVC% pred, FEV1%pred and FEV1/FVC in the COPD group were 73.74±19.68, 59.87±18.99 and 59.19±8.28, which were significantly lower than those in the healthy control group (P<0.05).
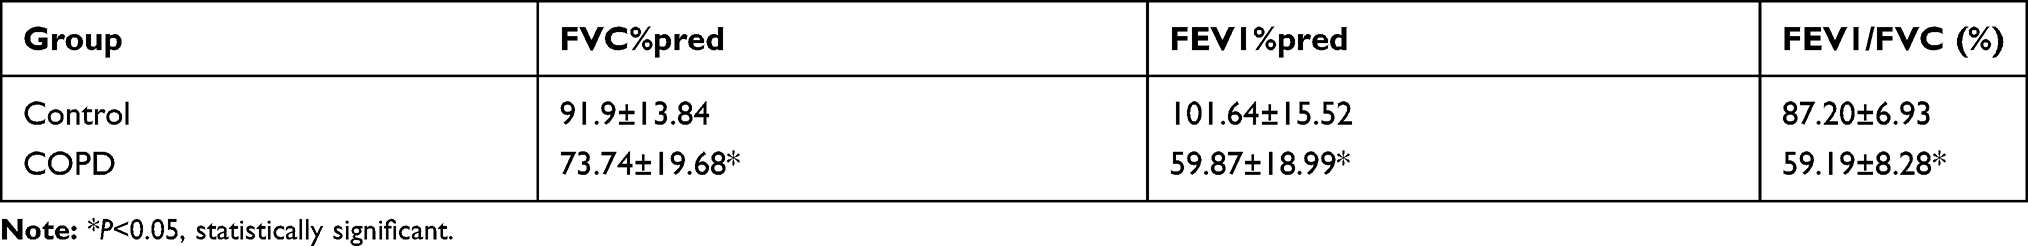 |
Table 2 Traditional Lung Function Parameters in COPD Group and Control Group |
Comparison of Respiratory Resistance Parameters Measured by 3D-IOS Between COPD Group and Healthy Control Group
The respiratory resistance parameters of the two groups were in normal distribution. The respiratory resistance parameters R5, R20, R5–R20 and Fres in the COPD group were significantly higher than those in the healthy control group, while X5 was significantly lower than that in the healthy control group (P<0.05), as shown in Table 3.
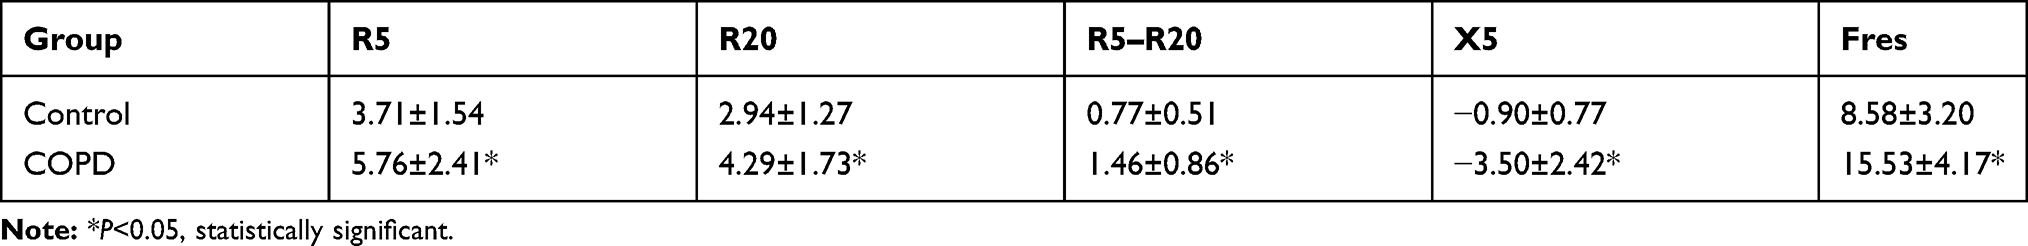 |
Table 3 3D-IOS Parameters in COPD Group and Control Group |
Comparison Respiratory Resistance Parameters Measured by PFT and 3D-IOS Among COPD Patients of Different GOLD Grades
The traditional lung function parameters such as FVC%pred, FEV1%pred and FEV1/FVC decreased with the increase of GOLD grade, and the differences between groups were statistically significant (P<0.05). With the increase of GOLD grade, the respiratory resistance parameters R5, R5–R20 and Fres measured by the MostGraph-01 pulmonary function test system also increased gradually. X5 decreased with the increase of pulmonary function severity, and the differences were statistically significant (P<0.05). However, there was no significant difference in R20 between different GOLD grades (P<0.05), as shown in Tables 4 and 5.
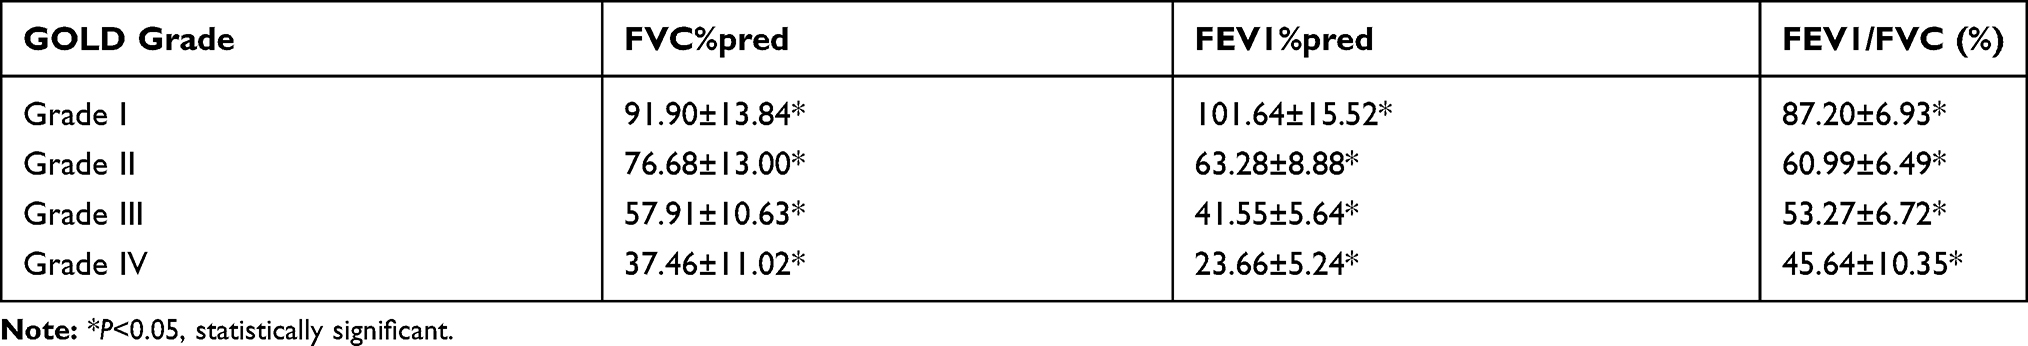 |
Table 4 Comparison of Traditional Lung Function Parameters Among COPD Groups |
 |
Table 5 Respiratory Resistance and Reactance Parameters Among COPD Groups |
Correlation Analysis of Lung Function Parameters Between IOS and PFT in COPD Groups
In Table 6, the correlation analysis of respiratory resistance parameters by IOS and PFT in the COPD group shows that R5, R5–R20 and Fres were significantly negatively correlated with FEV1%pred, FVC%pred and FEV1/FVC (P<0.05), X5 was significantly positively correlated with FEV1%pred, FVC%pred and FEV1/FVC (P<0.01), while R20 has no correlation with FEV1%pred, FVC%pred and FEV1/FVC (P>0.05). Among the parameters, X5 had the highest correlation with FEV1%pred (r=0.412), and Fres had the highest correlation with FEV1/FVC (r=−0.467).
 |
Table 6 Correlation of Lung Function Parameters Between IOS and PFT in COPD Group |
The Diagnostic Value of 3D-IOS to Detect the Relevant Parameters of Respiratory Resistance and Reactance in COPD
As shown in Figures 1–4, the area under the curve of R5, R5–R20, X5 and Fres is 0.7808 [95% CI (0.7069, 0.8546), P<0.0001], 0.7659 [95% CI (0.6923, 0.8395), P<0.0001], 0.8947 [95% CI (0.8484, 0.9409), P<0.0001] and 0.9095 [95% CI (0.8676, 0.9515), P<0.0001], respectively, Fres>X5>R5>R5–R20, where Fres has the highest diagnosis accuracy.
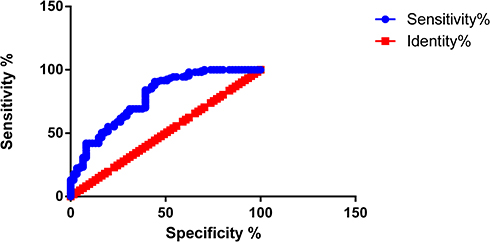 |
Figure 1 ROC of R5. |
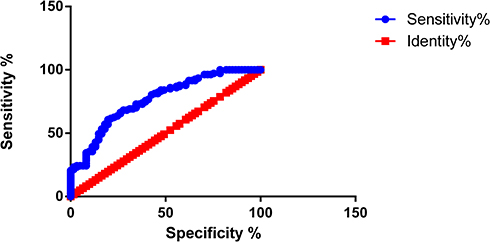 |
Figure 2 ROC of R5–R20. |
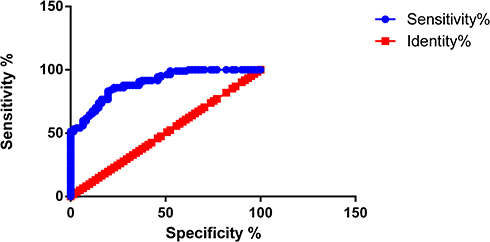 |
Figure 3 ROC of X5. |
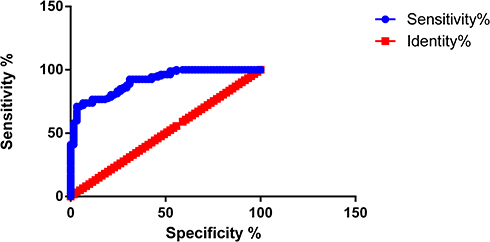 |
Figure 4 ROC of Fres. |
3D-Colored Visualization of Oscillation Characteristics
As shown in Figure 5, a typical COPD patient displayed green during the inhalation phase and yellow–red–blue scale during the expiration phase, indicating respiratory cycle dependence. As shown in Figure 6, the healthy control displayed green representing low resistance throughout the respiratory cycle, with no obvious respiratory cycle dependence.
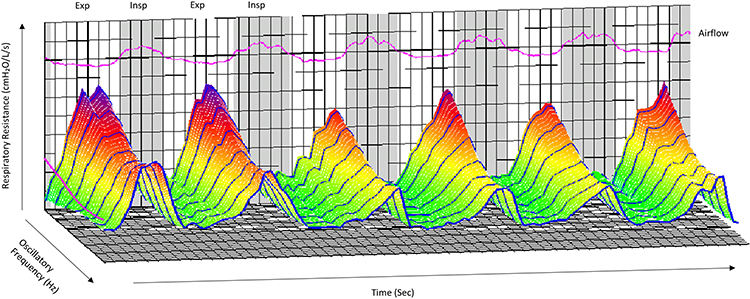 |
Figure 5 3D-colored images of COPD patient. |
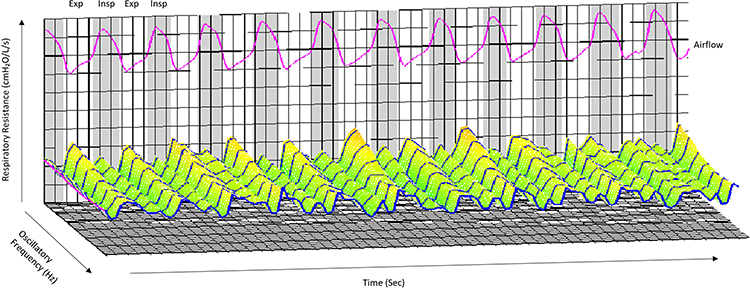 |
Figure 6 3D-colored images of healthy control. |
Discussion
At present, COPD is a very serious public health problem in China.10 In recent years, the number of deaths due to the disease has reached more than 1 million per year.11,12 The diagnosis of COPD relies on traditional PFT, which is widely accepted for its practicality and reliability.13 However, in daily practice, the subject must exhale forcefully until the expiratory plateau (volume change <0.025 L) appears on the volume–time curve and lasts for more than 1 second in order to obtain accurate FVC results. In cases of severe airway obstruction, there might be no plateau after exhalation for more than 20 or even 30 seconds, which affects the accuracy of the results evidently.14 Some researchers also proved a good correlation between the IOS and traditional PFT parameters, and assumed that IOS can be used to evaluate COPD.15–17
The principle of broadband 3D-IOS is that electromagnetic pulses produced by an external generator transform into mechanical waves at different frequencies by Fourier transformation. During eupnea, they are applied to the respiratory system through the mouthpiece at intervals of 0.25 seconds. The oral pressure and flow signals were collected to build Rrs and Xrs characteristic curves at the oscillation frequency of 4 Hz to 36 Hz. By adding a time axis, the system can dynamically detect changes in total respiratory resistance at different pulse frequency, and can accurately analyze changes in respiratory resistance at different frequencies. The system can reveal the dynamics properties of the airway during calm breathing in patients with airway obstructive diseases.18,19 The parameters collected by broadband 3D-IOS include R5, R20, R5–R20, X5 and Fres. R represents viscous resistance, which mainly comes from the airway, lung parenchyma and thorax. And respiratory resistance (including central respiratory resistance and peripheral respiratory resistance) is the most important part, where R5 represents total respiratory resistance and R20 represents central respiratory resistance, R5–R20 represents peripheral respiratory resistance. X represents the sum of lung elastic resistance and inertial resistance. Fres represents the resonance frequency when elastic resistance and inertial resistance are equal.20
In this study, 107 patients with stable COPD were tested for respiratory resistance and traditional PFT. The results showed that compared with healthy controls, the respiratory resistance parameters R5, R5–R20, Fres and the traditional lung function parameters FVC%pred, FEV1%pred and FEV1/FVC all increased significantly, while the respiratory resistance parameter X5 decreased significantly (P<0.05). The respiratory resistance parameter R20 between the two groups had no significant difference (P>0.05). As the severity of COPD increases, the respiratory resistance parameters R5, R5–R20 and Fres measured by broadband 3D-IOS gradually increase, and X5 decreases. The outcome confirms that the increase in respiratory resistance of COPD patients is characterized by increased peripheral respiratory resistance, which is consistent with the conclusions of many domestic and foreign studies.11,18,20–23 COPD is an airflow restricted disease. Continuous airflow restriction further causes pulmonary ventilation dysfunction. The characteristic COPD pathophysiological process included the decrease of lung tissue elasticity, continuous expansion and retraction obstacles of alveoli, increase of residual air volume, and reduction of lung compliance as a result. In this study, we found that X5 of the COPD group was significantly lower than that of the healthy control group. X5 represents the sum of the elastic resistance and inertial resistance of the lung at 5 Hz. This result is consistent with the overinflation of the peripheral lung tissue, the reduction of lung compliance and the increase of respiratory resistance of COPD patients. The decrease of X5 can reflect not only the degree of airway obstruction, but also the hyperinflation of peripheral lung tissue and changes in lung compliance. These findings indicate that the respiratory resistance parameters in this study can better reflect the changes in respiratory physiology and respiratory mechanics in COPD patients.
By analyzing the correlation of respiratory resistance parameters between traditional lung function parameters and IOS, we found that R5, R5–R20 and Fres and FEV1%pred, FVC%predand FEV1/FVC were significantly negatively correlated (P<0.05), and X5 was significantly positive correlated with FEV1%pred, FVC%pred and FEV1/FVC (P<0.01). Among the parameters, Fres had the highest correlation with FEV1/FVC (r=0.412), and X5 had the highest correlation with FEV1%pred (r=−0.467). There was no correlation between R20 and FEV1%pred, FVC%pred and FEV1/FVC (P<0.05). The outcome turned out that Fres was the most sensitive parameter to reflect airflow obstruction and had the highest value in the diagnosis of COPD, which is consistent with the research results of many scholars.11,24
Colorimetric analysis showed that in COPD patients, Rrs increased at a lower frequency and decreased with the increase of the oscillation frequency. However, the oscillation frequency of Rrs to healthy subjects was almost constant. This phenomenon is called frequency dependence of Rrs.21 What is the reason for the formation of frequency dependence? The destruction of the alveolar wall is a characteristic pathological change of COPD, but the degree of destruction of each part is not completely the same, which will lead to uneven emphysema in the lung and uneven changes in the resistance of the bronchioles as well as the elasticity of the alveoli. As a result, the local distribution of mechanical components is obviously uneven, and the phenomenon of uneven ventilation in the lungs appears. Uneven ventilation in the lung is a unique pathological phenomenon of COPD. In addition, COPD patients also have negative frequency dependence, that is, blue at lower frequencies and yellow or red at higher frequencies. By colorimetric analysis, it can be seen intuitively that typical COPD patients display a green pattern during the inhalation phase and yellow–red–blue graduation during the expiration phase, while the healthy control group displays a green pattern representing low resistance throughout the expiration cycle. Total breath analysis and intra-breath analysis (inspiration–exhalation analysis) help to understand the dynamic changes of respiratory resistance in the respiratory cycle of COPD patients. In addition, Mori et al also found that by using 3D-IOS to measure the respiratory resistance of asthma patients,21 colorimetric analysis showed that the overall resistance increased and displayed a yellow pattern. Therefore, 3D-colored visualized images can better reflect the complex oscillating characteristics of the respiratory system, and intuitively display specific patterns of diseases.25
In short, the parameters R5, R5–R20, X5 and Fres measured by broadband 3D-IOS not only have a good correlation with traditional lung function parameters, but also can judge the severity of respiratory obstruction in COPD patients. And the unique broadband 3D-colored imaging technology can dynamically display respiratory resistance in the inhalation and expiration phases, which can be used for early diagnosis and disease assessment of COPD. The method does not change the airway tension, and the examination can be completed by calm breathing. In addition, the operation is simple and well-repeatable. It is especially suitable for the elderly, children and critical patients.
Funding
Our study is supported by Guanghua Medical Fund Project.
Disclosure
The authors report no conflicts of interest in this work.
References
1. Wang C, Xu J, Yang L, et al. Prevalence and risk factors of chronic obstructive pulmonary disease in China (the China Pulmonary Health [CPH] study): a national cross-sectional study. Lancet. 2018;391(10131):1706–1717. doi:10.1016/S0140-6736(18)30841-9
2. Chung KS, Jung JY, Park MS, et al. Cut-off value of FEV1/FEV6 as a surrogate for FEV1/FVC for detecting airway obstruction in a Korean population. Int J Chron Obstruct Pulmon Dis. 2016;11:1957–1963. doi:10.2147/COPD.S113568
3. Liu Z, Lin L, Liu X. Clinical application value of impulse oscillometry in geriatric patients with COPD. Int J Chron Obstruct Pulmon Dis. 2017;12:897–905. doi:10.2147/COPD.S129974
4. Tomalak W, Czajkowska-Malinowska M, Radliński J. Application of impulse oscillometry in respiratory system evaluation in elderly patients. Pneumonol Alergol Pol. 2014;82(4):330–335. doi:10.5603/PiAP.2014.0041
5. Czajkowska-Malinowska M, Tomalak W, Radliński J. Quality of spirometry in the elderly. Pneumonol Alergol Pol. 2013;81(6):511–517.
6. Global Initiative for Chronic Obstructive Lung Disease. GOLD 2018 global strategy for the diagnosis, management, and prevention of chronic obstructive pulmonary disease. Available from: http://www.goldcopd.org.
7. Yufeng D, Qian L, Xuejun L. Interpretation of the key points of the 2017 guidelines for chronic obstructive pulmonary disease. Chin Electron J Geriatr Res. 2017;03:18–21.
8. Oostveen E, MacLeod D, Lorino H, et al. The forced oscillation technique in clinical practice: methodology, recommendations and future developments. Eur Respir J. 2003;22(6):1026–1041. doi:10.1183/09031936.03.00089403
9. Pulmonary Function Professional Group, Chinese Medical Association Respiratory Diseases Branch. Guidelines for pulmonary function examination (Part 2)-spirometer examination. Chin J Tuberculosis Respir Med. 2014;37(7):481–486.
10. de Miguel Díez J, Jiménez García R, Hernández Barrera V, et al. Trends in self-rated health status and health services use in COPD patients (2006–2012). A Spanish population-based survey. Lung. 2015;193(1):53–62. doi:10.1007/s00408-014-9682-6
11. Dan M, Xiaoyan Z, Jianwu Z, et al. Application value of pulse oscillation pulmonary function test in the treatment of stable chronic obstructive pulmonary disease. Chin J Lung Dis. 2017;03:313–316.
12. Hitomi Y, Tanaka A, Yasunari K, et al. Association between respiratory impedance measured by forced oscillation technique and exacerbations in patients with COPD. Int J Chron Obstruct Pulmon Dis. 2017;13:79–89. doi:10.2147/COPD.S146669
13. Uchida A, Ito S, Suki B, Matsubara H, Hasegawa Y. Influence of cheek support on respiratory impedance measured by forced oscillation technique. Springerplus. 2013;2:342. doi:10.1186/2193-1801-2-342
14. Zitao C, Ziqi M, Hongli G, et al. The feasibility study and cut-off value of FEV_1/FEV_6 for screening middle-aged and elderly patients with chronic obstructive pulmonary disease. J Guangdong Med Coll. 2016;06:553–557.
15. Jarenbäck L, Ankerst J, Bjermer L, Tufvesson E. Acinar ventilation heterogeneity in COPD relates to diffusion capacity, resistance and reactance. Respir Med. 2016;110:28–33. doi:10.1016/j.rmed.2015.11.005
16. Nikkhah M, Amra B, Eshaghian A, et al. Comparison of impulse osillometry system and spirometry for diagnosis of obstructive lung disorders. Tanaffos. 2011;10(1):19–25.
17. Wei X, Shi Z, Cui Y, et al. Impulse oscillometry system as an alternative diagnostic method for chronic obstructive pulmonary disease. Medicine (Baltimore). 2017;96(46):e8543. doi:10.1097/MD.0000000000008543
18. Shan Z, Hao-yan W. Discussion on the diagnostic value of pulse oscillation method in chronic obstructive pulmonary disease. J Heart Lung Vasc Dis. 2015;02:96–100.
19. Weihan X, Haoyan W. Clinical application of pulse oscillation pulmonary function test in chronic obstructive pulmonary disease. J Heart Lung Vasc Dis. 2013;04:519–522.
20. Pingping L, Ruiying W, Jianying X. The clinical significance of the impulse concussion method in evaluating the severity of chronic obstructive pulmonary disease. Int J Respir. 2016;36(16):1239–1243.
21. Mori K, Shirai T, Mikamo M, et al. Colored 3-dimensional analyses of respiratory resistance and reactance in COPD and asthma. COPD. 2011;8(6):456–463. doi:10.3109/15412555.2011.626818
22. Yamauchi Y, Kohyama T, Jo T, Nagase T. Dynamic change in respiratory resistance during inspiratory and expiratory phases of tidal breathing in patients with chronic obstructive pulmonary disease. Int J Chron Obstruct Pulmon Dis. 2012;7:259–269. doi:10.2147/COPD.S30399
23. Brashier B, Salvi S. Measuring lung function using sound waves: role of the forced oscillation technique and impulse oscillometry system. Breathe (Sheff). 2015;11(1):57–65. doi:10.1183/20734735.020514
24. Peng L, Gang H, Qiuyue W, et al. The value of impulse oscillation method in evaluating respiratory impedance in patients with different clinical subtypes of chronic obstructive pulmonary disease. Pract J Cardio-Cerebral Pneumal Vasc Dis. 2015;02:34–37.
25. Shirai T, Mori K, Mikamo M, et al. Usefulness of colored 3D imaging of respiratory impedance in asthma. Allergy Asthma Immunol Res. 2013;5(5):322–328. doi:10.4168/aair.2013.5.5.322
 © 2021 The Author(s). This work is published and licensed by Dove Medical Press Limited. The
full terms of this license are available at https://www.dovepress.com/terms
and incorporate the Creative Commons Attribution
- Non Commercial (unported, 3.0) License.
By accessing the work you hereby accept the Terms. Non-commercial uses of the work are permitted
without any further permission from Dove Medical Press Limited, provided the work is properly
attributed. For permission for commercial use of this work, please see paragraphs 4.2 and 5 of our Terms.
© 2021 The Author(s). This work is published and licensed by Dove Medical Press Limited. The
full terms of this license are available at https://www.dovepress.com/terms
and incorporate the Creative Commons Attribution
- Non Commercial (unported, 3.0) License.
By accessing the work you hereby accept the Terms. Non-commercial uses of the work are permitted
without any further permission from Dove Medical Press Limited, provided the work is properly
attributed. For permission for commercial use of this work, please see paragraphs 4.2 and 5 of our Terms.