Back to Journals » International Journal of Nanomedicine » Volume 13
Application of quasi-emulsification and modified double emulsification techniques for formulation of tacrolimus microsponges
Authors Zaman M, Qureshi S, Sultana K, Hanif M, Mahmood A, Shaharyar ZA, Gulzar F ![]() , Barkat K, Abdel-Daim MM
, Barkat K, Abdel-Daim MM ![]()
Received 23 February 2018
Accepted for publication 9 April 2018
Published 10 August 2018 Volume 2018:13 Pages 4537—4548
DOI https://doi.org/10.2147/IJN.S166413
Checked for plagiarism Yes
Review by Single anonymous peer review
Peer reviewer comments 2
Editor who approved publication: Dr Thomas Webster
Muhammad Zaman,1 Sundus Qureshi,1 Kishwar Sultana,1 Muhammad Hanif,2 Asif Mahmood,1 Zaib Ali Shaheryar,1 Faisal Gulzar,1 Kashif Barkat,1 Mohamed M Abdel-Daim3
1Faculty of Pharmacy, University of Lahore, Lahore, Pakistan; 2Department of Pharmacy, Bahauddin Zakariya University, Multan, Pakistan; 3Department of Pharmacology, Suez Canal University, Ismailia, Egypt
Background: The present study was to develop a stable and sustained-release delivery system of tacrolimus (TCM). TCM is a macrolide antibiotic used as an immunosuppressant. It is formulated as a microsponge, which is a safe and effective delivery system with reduced side effects.
Materials and methods: The method used to prepare ethyl cellulose (EC) and xanthan gum (XG)-facilitated EC-based microsponges employed emulsification and modified double emulsification techniques. TCM-containing microsponges were prepared using varying concentrations followed by evaluation of micromeritics, compatibility of drug and excipients, production yield, drug content and entrapment efficiency, zeta potential, size distribution and drug release.
Results: The results showed excellent flow properties with adequate entrapment efficiency of the system and satisfactory release of active pharmaceutical ingredient. In vitro dissolution studies, which were conducted to determine the amount of drug released, illustrated a pronounced sustained effect up to 8 h. Zeta size and zeta potential analysis of microsponges confirmed the existence of micro-sized (1.99–3.09 µm) and stable particles (-15.33 to -3.38 mV), respectively.
Conclusion: Conclusively, the applied technique and selected combination of ingredients were found suitable for the preparation of TCM-containing sustained-release microsponges.
Keywords: ethylcellulose, xanthan gum, macrolides, tacrolimus, sustained release
Introduction
Tacrolimus (TCM) is a macrolide antibiotic which was first discovered in 1984. It is obtained from Streptomyces tsukubaensis and used as an immunosuppressant. It has potential therapeutic applications in graft rejection therapy and atopic dermatitis. It acts by inhibiting T lymphocytes1 and exhibits its immunosuppressive effect by inhibiting an enzyme called calcineurin, which is fundamental for multiplication of T cells responsible for immune response. Use of oral TCM facilitates dose reduction of steroids during transplantation to prevent transplant rejection. Due to this “steroid-sparing effect”, TCM reduces the side effects which can occur when larger doses of steroids are used for a longer period, thus preventing transplant rejection. TCM was approved by the US Food and Drug Administration in April 1994 for liver transplantation and has also been used in patients undergoing heart, kidney, small bowel and bone marrow transplantations.
TCM is administered twice a day at a dose of 0.075–0.2 mg/kg. Interindividual dose variability depends upon patient conditions. One of the side effects of TCM is abdominal pain, which can be reduced by taking it with food, especially fatty food. Grapefruit juice increases the blood level of TCM, so its concurrent use should be avoided.2
Microsponges are novel drug delivery systems, which ensure safe and effective release of drugs with their sustained effect.3 The microsponge drug delivery system has unique properties including self-sterilizability, due to the minimal pore size of 0.25 μm, which does not allow bacteria to enter and contaminate the formulation.4 It causes minimal side effects and can entrap drug up to three times its weight due to its porosity, as an average 25 μm microsponge particle contains about 25,000 pores and can have a 1 ft length and a storage capacity of up to 1 mL/g.5 This dosage form has a higher safety profile due to its stability over a wide range of pH values and temperatures, and is not irritating and allergic or mutagenic in nature.6 Dose-related side effects of TCM can be avoided by incorporating it into a microsponge drug delivery system, which may improve patient compliance. Microsponges can be applied topically,7 transdermally, parenterally or even through oral route.8 Therefore, this study was conducted to develop two types of TCM-containing sustained release microsponges, ethyl cellulose (EC) and xanthan gum (XG)-facilitated EC-based formulations, for reducing the dosing frequency and for sustained delivery of TCM.
Materials and methods
Materials
TCM was obtained from Almond Pharmaceuticals Pvt. Ltd., acetone from Loope (UK), dichloromethane (DCM) from RdH Laborchemikalien GmbH & Co. KG (Seelze, Germany), distilled water from the research laboratory of the University of Lahore, ethyl cellulose (EC) from Kima Chemicals, Zibo Co., Ltd (Shandong, People’s Republic of China), polyvinyl alcohol (PVA) from Hong Kong Jia Ying International Trade Co., Ltd. (Hubei, People’s Republic of China), xanthan gum (XG) from Qingdao Kaineng Chemical Co., Ltd. (Shandong, People’s Republic of China) and hydrochloric acid from Merck (Darmstadt, Germany). All chemicals used were of analytical grade.
Methods
Polymeric porous spheres of TCM were prepared by two approaches: quasi-emulsification technique employing EC-based TCM microsponges and modified double emulsification technique employing XG-facilitated EC microsponges. Formulations were designed according to the composition described in Table 1 using varying concentrations of polymers in formulations ECT1–4 and XECT1–4.
 | Table 1 Composition of EC and XG-facilitated EC-based TCM-containing microsponges |
Method for preparation of TCM-containing EC microsponges
TCM-containing EC microsponges were prepared by quasi-emulsion method. Different formulations of TCM-based EC microsponges were designed using varying drug-to-polymer ratios. The internal phase of the emulsion system was prepared by adding weighed amounts of TCM and EC into 8 mL of DCM under continuous stirring at 1,500 rpm. The prepared internal phase was added dropwise into a continuous phase consisting of 1% PVA solution under continuous stirring. The mixture was stirred at 1,500 rpm using GUO-HUA multifunctional overhead stirrer for 60 min followed by filtration through Whatman filter paper. The residue obtained was dried and stored for further analysis (Figure 1A).
 | Figure 1 Pictorial illustration of quasi-emulsion method for preparation of EC-based TCM-containing microsponges (A) and quasi-emulsion method involving w/o/w-type emulsification for preparation of XG-facilitated EC-based microsponges of TCM (B). |
Preparation of XG-facilitated TCM-containing EC microsponges
XG-facilitated TCM-containing EC microsponges were prepared by quasi-emulsion method, which involved w/ow-type emulsification. In this method, 0.2% XG solution was prepared in acetone:water (2:8) followed by dispersion of 10 mL of the stated solution into a solution of TCM and EC in DCM. This mixture was subjected to continuous stirring for 30 min at 1,500 rpm using GUO-HUA multifunctional overhead stirrer. This process resulted in the formation of a phasic mixture, which was dispersed in 1% PVA solution under constant stirring for 60 min. The optimized formulation was filtered, and the residue was dried and stored for further analysis (Figure 1B).
Evaluation of TCM-containing microsponges
The prepared microsponges were evaluated for various parameters as discussed below.
Micromeritics
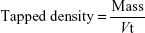
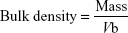
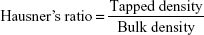
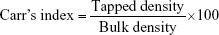
Micrometric studies were conducted on the prepared formulations of TCM microsponges. Parameters such as tapped density, bulk density, Hausner’s ratio, Carr’s index and angle of repose were evaluated. Results were calculated using the following equations:15–18
|
|
|
|
|
Production yield
Production yield is an important parameter to judge the efficiency of the method used for the preparation of microsponges. It is the percentage of the total mass of product obtained from the total mass used which can be calculated from the following formula:5,9
|
Percent drug content and entrapment efficiency
Percent drug content and encapsulation efficiency of the prepared microsponges were estimated by taking weighed samples of microsponges and dissolving them in a buffer of 0.1 N HCl, and sonicating the solution for 4 h at 30°C. The solution was then filtered and observed at 228 nm. Percent drug content and entrapment efficiency were calculated using the following equations:9
|
|
where Mact is the actual amount of drug in microsponges, Mms is the weighed amount of microsponges and M is the theoretical amount of drug in microsponges.
Surface morphology
Optical microscopy and scanning electron microscopy (SEM) were used for surface analysis of the prepared microsponges. The prepared formulations of TCM were evaluated for their sphericity, spongy surface and other morphological features under a digital light microscope by placing a small amount of microsponges on a slide and wetting them with castor oil.10 SEM of the prepared microsponges was carried out to evaluate their morphology more precisely.11
In vitro drug release studies
The prepared TCM microsponges were subjected to in vitro dissolution studies using type II dissolution apparatus. The microsponges were wrapped up in a cellophane membrane and suspended in 900 mL of 0.1 N HCl, which was used as dissolution media. Temperature was set at 37°C±5°C, and the paddles at 50 rpm. Samples were taken at regular intervals for 8 h to evaluate the amount and mechanism of drug release using a double-beam UV–visible spectrophotometer (T80; PG Instruments, Lutterworth, UK). A fresh medium, of volume equivalent to that taken as samples, was added to maintain a constant volume (900 mL) of the dissolution medium. Observed absorbance of samples was used to calculate the percent drug release using the following equation:
|
Zeta potential
Zeta potential is an indicator of particle surface charge and particle stability. Particles will not adhere to each other if the value of zeta potential is above +30 or below −30 mV.12
Zeta size
A Zetasizer was used to determine the particle size distribution of the given samples. Malvern software was used to analyze the intensity distribution data of particles of different size ranges, and a graphical representation was obtained. The peak on the graph indicates the size of most particles present in the sample.12
Compatibility of ingredients
Fourier-transform infrared (FTIR) spectroscopy was used for compatibility studies of ingredients. FTIR spectra of pure drug, polymer, their physical mixture and the prepared formulations were recorded in a scanning range of 500–4,000 cm−1. The presence of different functional groups produces different vibrations resulting in different spectra depending upon the absorbance of each bond. Physicochemical compatibility was studied through this analysis.13
X-ray diffraction (XRD)
XRD analysis of pure drug, polymer and formulation of TCM-containing microsponges was conducted to evaluate the nature of drug particles alone as well as in the form of formulated microsponges.
Statistical analysis of data
Production yield, drug content and entrapment efficiency of different formulations were statistically evaluated by applying analysis of variance (ANOVA) followed by Tukey’s multiple comparisons test using GraphPad Prism Version 7.1.
Results
Micromeritics
Micromeritic studies of all the prepared formulations of EC and XG-facilitated EC-based microsponges were performed to evaluate their flow properties. Table 2 shows the different parameters determined by deducing the results for flow properties of the prepared microsponges.
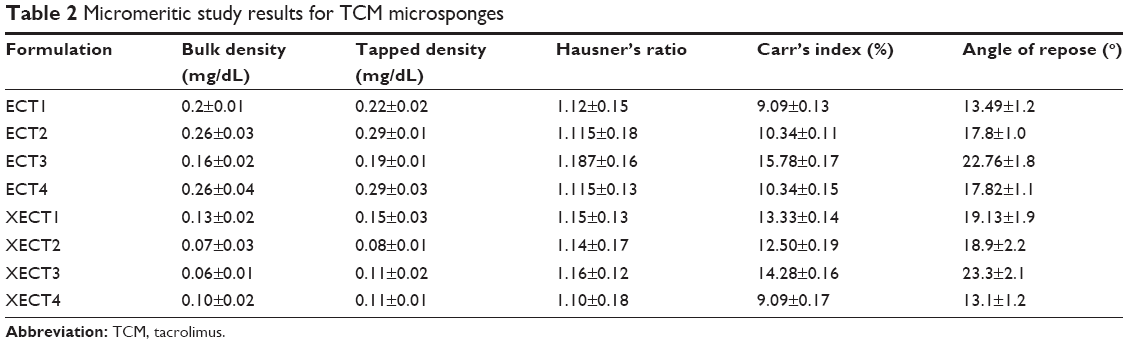 | Table 2 Micromeritic study results for TCM microsponges |
Production yield
Studies were performed to evaluate the efficiency of the process used for the preparation of formulations. Results proved that up to 90% yield can be achieved by this method; however, they also proved that the yield may decrease with an increase in polymeric content.
Percent drug content and entrapment efficiency
A similar trend was observed while calculating percent drug content, but an opposite behavior was noticed while calculating entrapment efficiency, as the entrapment efficiency of the formulations increased with an increase in polymeric content, and vice versa. Results demonstrated a relative correlation between variable concentrations of the polymers used, consolidating the claim that an increase in polymer concentration results in decreased production yield, decreased percent drug content and increased drug entrapment efficiency (Figure 2).
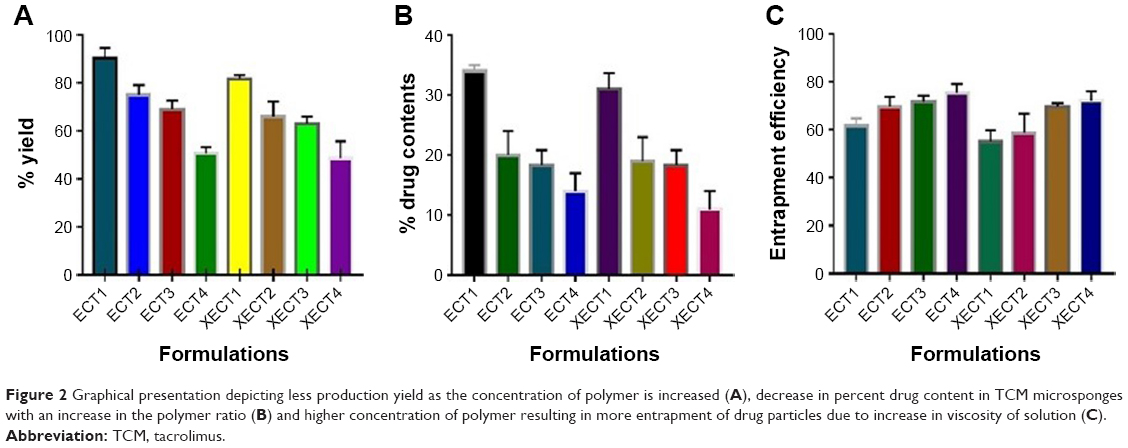 | Figure 2 Graphical presentation depicting less production yield as the concentration of polymer is increased (A), decrease in percent drug content in TCM microsponges with an increase in the polymer ratio (B) and higher concentration of polymer resulting in more entrapment of drug particles due to increase in viscosity of solution (C). |
Surface morphology
Optical microscopic images (Figure 3A and B) reflected the circular shape of the prepared microsponges; however, a crystalline structure of drug (Figure 3C) and a bit rough and spongy surface were observed in SEM images of the prepared microsponges (Figure 3D and E).
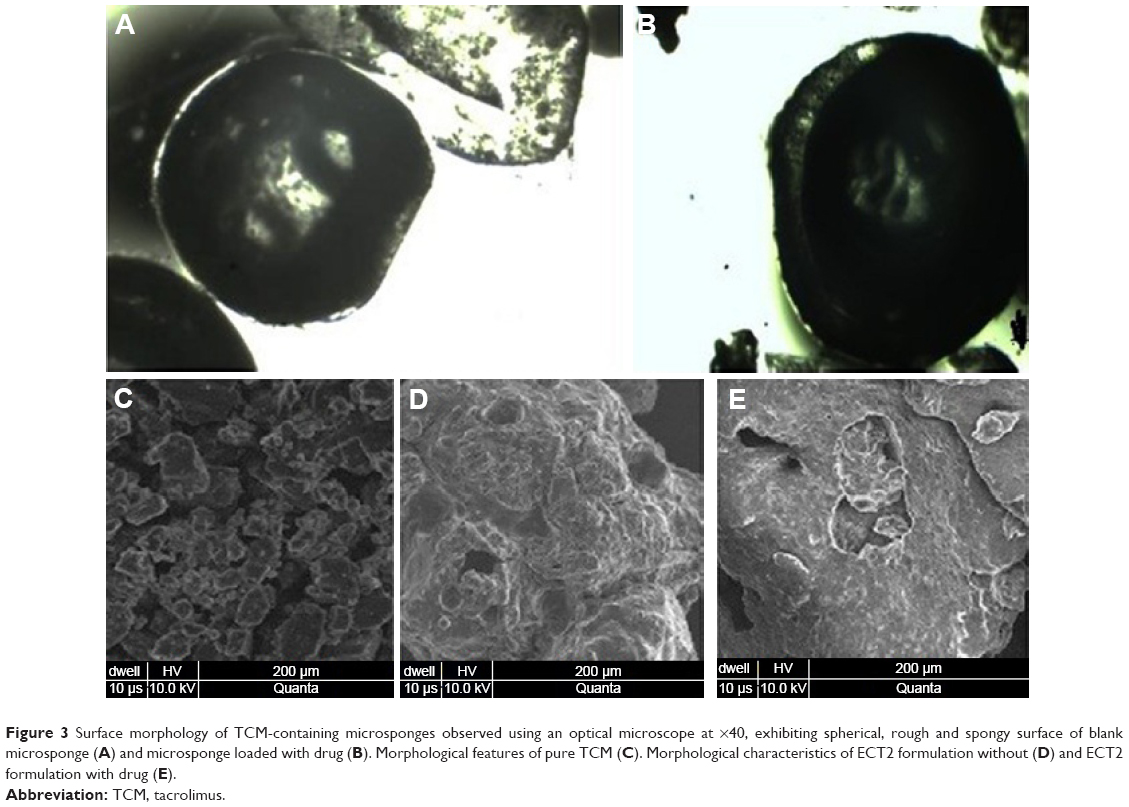 | Figure 3 Surface morphology of TCM-containing microsponges observed using an optical microscope at ×40, exhibiting spherical, rough and spongy surface of blank microsponge (A) and microsponge loaded with drug (B). Morphological features of pure TCM (C). Morphological characteristics of ECT2 formulation without (D) and ECT2 formulation with drug (E). |
In vitro drug release studies
Figure 4 illustrates the in vitro release of TCM from the prepared microsponges. The amount of drug released from EC-based formulations was >90% as compared to XG-facilitated EC-based microsponges (Figure 4).
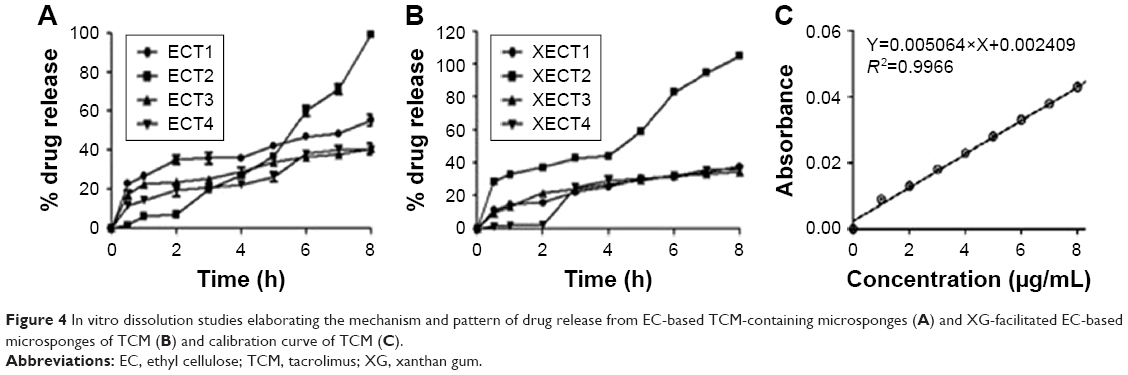 | Figure 4 In vitro dissolution studies elaborating the mechanism and pattern of drug release from EC-based TCM-containing microsponges (A) and XG-facilitated EC-based microsponges of TCM (B) and calibration curve of TCM (C). |
Kinetic modeling
According to the results of the study, ECT3 formulation exhibited a zero-order release, whereas a first-order kinetics was exhibited by XECT1, Higuchi kinetic model by XECT4, Fickian diffusion by ECT1 and XECT3 and Hixson and Crowell kinetic model by ECT4 and XECT2 (Table 3).
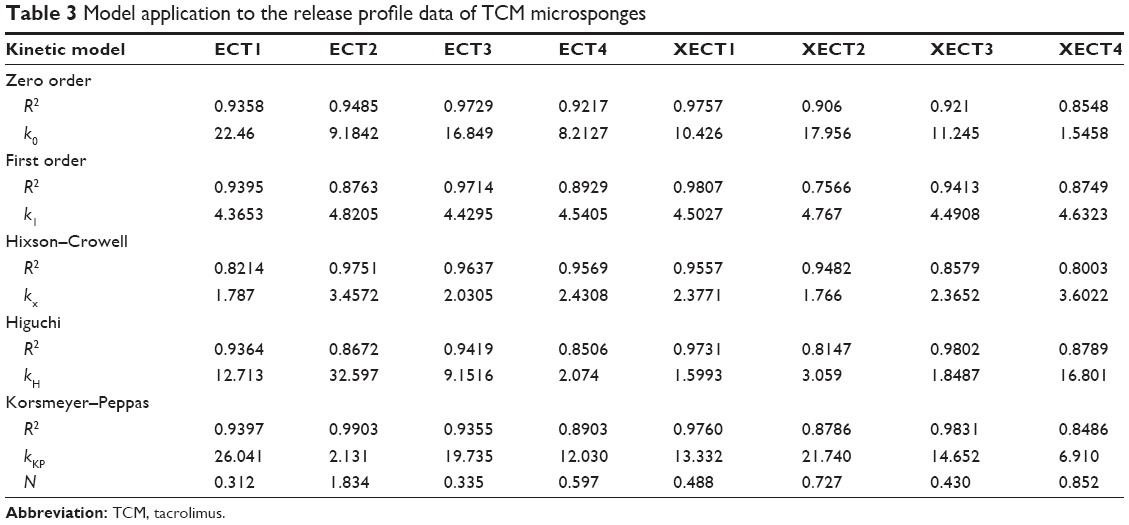 | Table 3 Model application to the release profile data of TCM microsponges |
Compatibility of ingredients
The compatibility of selected ingredients was evaluated, and the results showed that the ingredients were suitable for preparation of microsponges (Figure 5 and Table 4). Figure 5 clearly indicates the presence of functional groups as well as structural rings based on the FTIR spectra for various formulations.
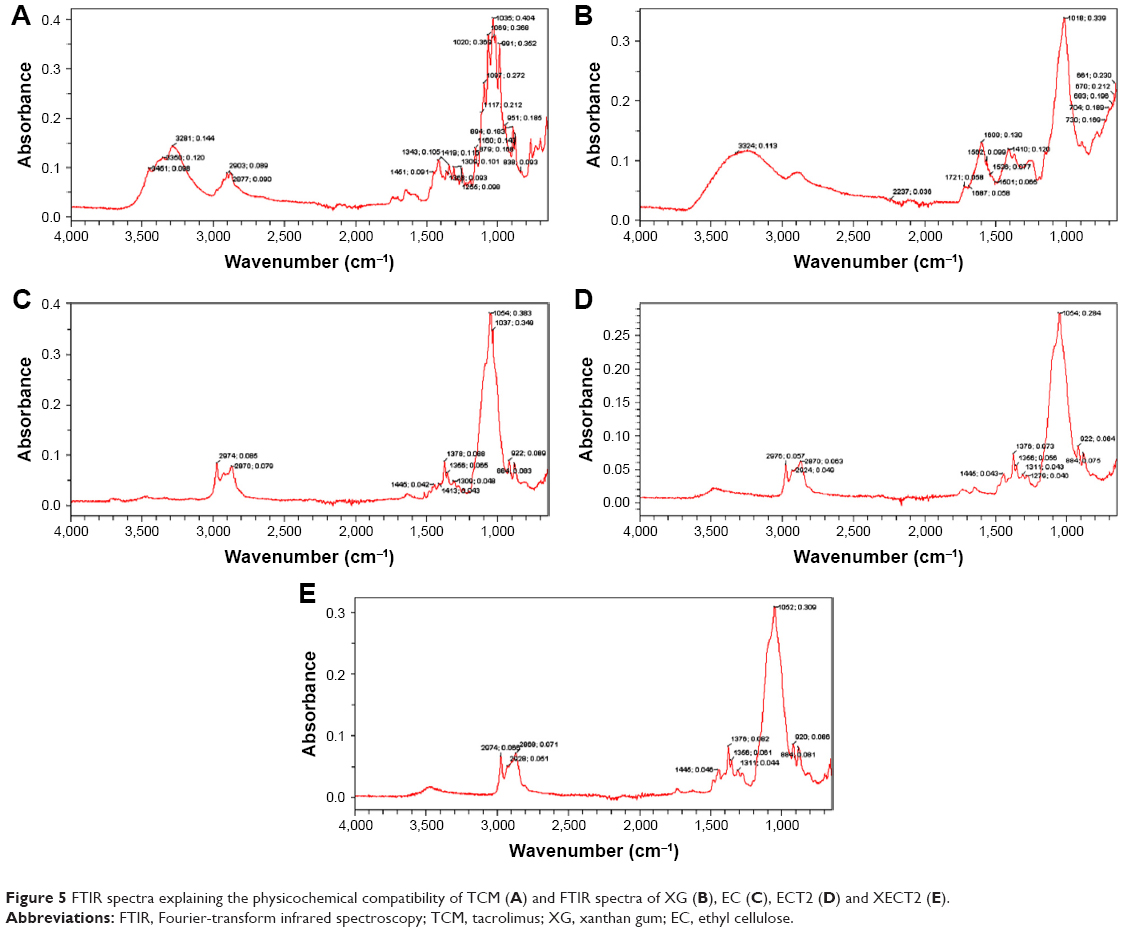 | Figure 5 FTIR spectra explaining the physicochemical compatibility of TCM (A) and FTIR spectra of XG (B), EC (C), ECT2 (D) and XECT2 (E). |
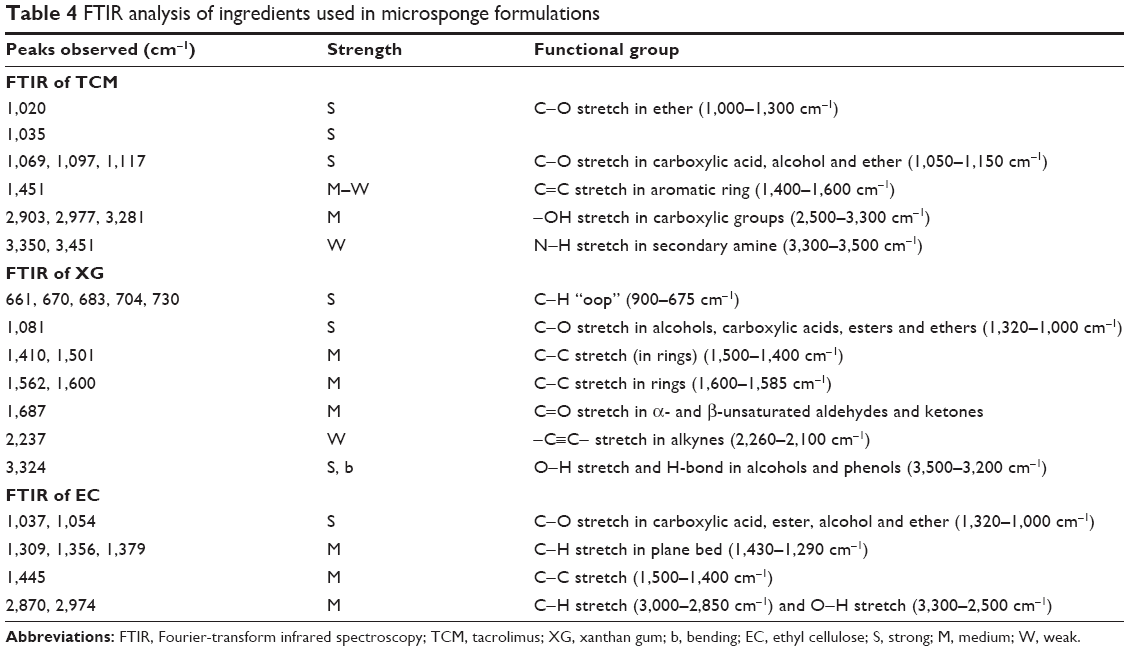 | Table 4 FTIR analysis of ingredients used in microsponge formulations |
XRD studies
A clear difference was observed in the diffractograms of pure drug and the prepared formulation (Figure 6). Crystallinity of the pure drug was masked when it was captured in microsponges, indicating that TCM was present in the form of solid solution of drug in excipients.
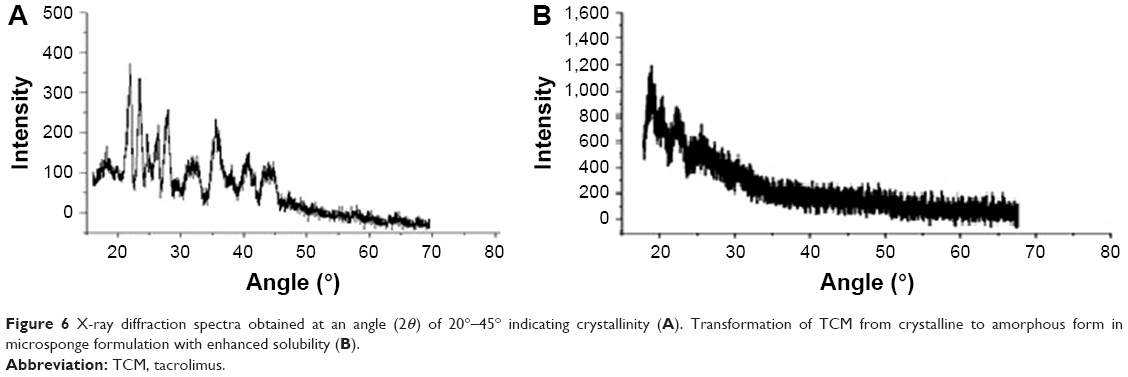 | Figure 6 X-ray diffraction spectra obtained at an angle (2θ) of 20°–45° indicating crystallinity (A). Transformation of TCM from crystalline to amorphous form in microsponge formulation with enhanced solubility (B). |
Zeta potential and zetasizer
The plot showed a peak at −4.105 mV, which meant that most of the microsponge particles in formulation had this charge, showing that the particles had an affinity for each other. The range of distribution for all particles in formulation was from −15.339 to 3.384 mV (Figure 7A). A high intensity of distribution was found toward the negative side showing the acidic nature of ionized particles. Repulsion in particles can be increased by neutralizing the charge on the surface of particles and by decreasing the pH of the system so that the particles remain separated and do not flocculate. Data showed that 40.674% of particles in the formulation had a size of 2.304 μm. All particles in formulation fell in the size range of 1.990–3.090 μm (Figure 7B).
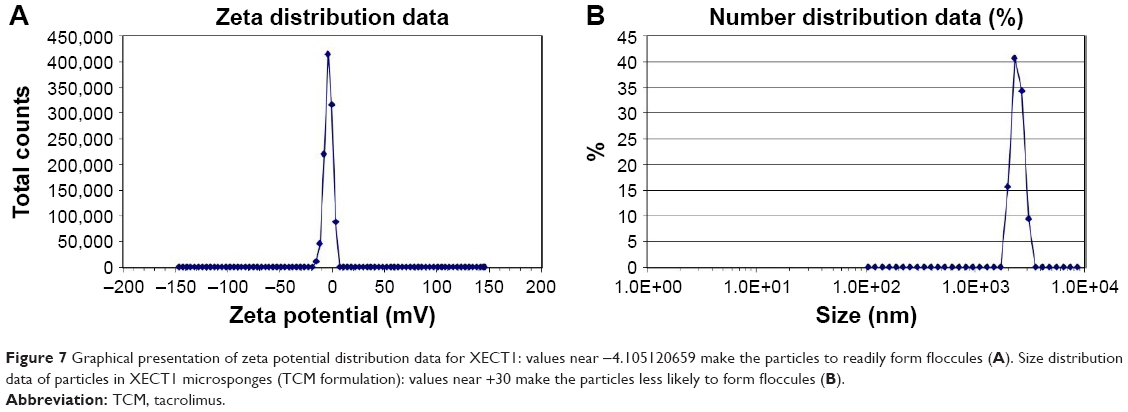 | Figure 7 Graphical presentation of zeta potential distribution data for XECT1: values near −4.105120659 make the particles to readily form floccules (A). Size distribution data of particles in XECT1 microsponges (TCM formulation): values near +30 make the particles less likely to form floccules (B). |
Statistical analysis
Statistical analysis showed a profound effect of polymeric content on the studied parameters. All formulations, having reasonable concentrations, showed significant variations in results, indicating a direct impact of polymer on these parameters (Table 5).
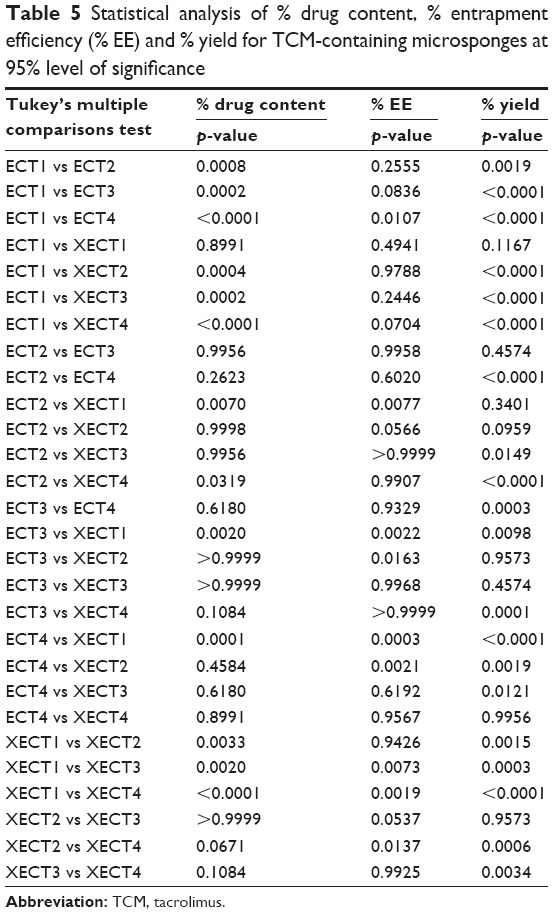 | Table 5 Statistical analysis of % drug content, % entrapment efficiency (% EE) and % yield for TCM-containing microsponges at 95% level of significance |
Discussion
The micromeritics study conducted to evaluate the flow properties of TCM-containing microsponges effectively demonstrated that ECT1, ECT2, ECT4 and XECT4 had free-flowing properties as per Carr’s index. Also, data for angle of repose were significant, showing that all formulations had excellent flow reference. Similarly, when it came to production yield, it became evident that formulations with increased concentration of polymers had comparatively less production yield. The yield ranged from 50.7% to 90%. One reason for this decrease can definitely be the increased viscosity due to the polymers which might have caused hindrance to diffusion of solvent.14,15
The half-life of a drug and its biological effects depend upon the concentration of drug released by the dosage form. Therefore, in this study, such parameters that evaluate the effectiveness of drug delivery at ideal rate and time were included. Percent drug content and encapsulation efficiency in the prepared microsponges were estimated by taking weighed samples of microsponges and dissolving them in a buffer of 0.1 N HCl for TCM, and sonicating them for 4 h at 30°C. As Figure 2 depicts, the entrapment efficiency of TCM microsponges ranged from 55.09%±0.02% to 75.72%±0.02%. Although a high drug-to-polymer ratio may decrease entrapment efficiency, its increase also increased entrapment efficiency. Moreover, various studies do support this fact that greater polymer concentration provides greater space for attachment of drug particles and vice versa.16,17
A morphological study on the effective merging of drugs with polymers provided a deeper understanding in this regard. This study undertook morphological evaluation of TCM-containing microsponges. Comparison of unformulated drug with that of TCM incorporated into polymers’ network clearly demonstrated that in the latter case, drug was fully merged, and no clue of individual drug particles was seen (Figure 3). These drug-incorporated microsponges were further subjected to in vitro dissolution studies using type II dissolution apparatus in order to measure the concentration of drug released with respect to time. The amount of drug released at a specific time was calculated with the help of calibration curve, which is a key method for measuring the concentration of drug in an unknown sample. Different dilutions of drug were prepared in buffer solution, and their absorption spectra were observed. Peak values of absorption were observed on a T80 UV–visible spectrophotometer, and a graph was plotted between the concentration and the area under the curve.18
For the purpose of this study, TCM was dissolved in 0.1 N HCl to make a 1 mg/mL standard solution. Then, 1 mL of this solution was subsequently dissolved in 100 mL of 0.1 N HCl to make up a volume of up to 100 mL forming a 10 μg/mL stock solution. Volumes of 1, 2, 3 and so on up to 9 mL were taken from this stock solution to dilute up to 10 mL to prepare dilutions of 1, 2, 3 and so on up to 10 μg/mL concentration. Spectrum analysis for different absorbance values at 228 nm wavelength was carried out. Coefficient of correlation (R2) for TCM was observed to be 0.9966 (Figure 4).
Conclusively, the mechanism of release of TCM from microsponges (Figure 4) highlighted that the initial burst release was due to the presence of drug at the surface; however, the release pattern became sustained as time lapsed. This can be attributed to the hydration of polymer, which increased the viscosity of hydrated layer around the drug particles. In the case of ECT2, an exceptional behavior was noted because very low amount of drug was released during initial 2 h. However, a prompt release pattern was detected subsequently, and >90% of drug was released after 8 h. ECT1, ECT3 and ECT4 released TCM comparatively in a smooth manner. It was found that ECT4 released the least amount of drug. On the other hand, XG-facilitated EC-based TCM microsponges showed their ability to provide stronger resistive barrier to release of drug.19–21 What remains interesting is the fact that release of drug has a strong dependency on the concentration of drug-retarding polymer. That is why an increase in the concentration of polymer causes a decrease in the release of drug from reservoir and vice versa.22,23
Dissolution kinetics hold great potential in depicting how drug delivery systems show their viability by making drug available at biological sites for required actions. Globally, kinetic models are used in forecasting the release pattern of drug and the underlying mechanisms.24,25 This research study thus tried such objective assessment methods to establish the behavioral pattern of TCM-incorporated microsponges. Data (Table 3) showed that ECT3 exhibited zero-order release, meaning that release of drug from a formulation remained independent of the initial concentration of drug. This model gives an ideal release for pharmacological action over a prolonged period.26 The first-order kinetics exhibited by XECT1 microsponges showed the dependency of drug release over initial concentration of drug and the amount of drug released. XECT4 followed the Higuchi kinetic model for drug dissolution, which showed that drug release took place through Fick’s second law of diffusion. Drug gets released into the media to form concentrated solution around the dosage form and subsequently diffuses out to the surrounding media.26,27 The best-fit model for drug release kinetic studies of ECT1, ECT2 and XECT3 was the Korsemeyer–Peppas model which is also known as power law model. The release characteristics showed by the value of “n” indicated that ECT1 and XECT3 followed Fickian diffusion, whereas ECT2 showed super case II transport mechanism for drug release. ECT4 and XECT2 followed the Hixson–Crowell kinetic model, indicating that release of drug from microsponges is independent of diffusion. This model perceives the condition that drug release occurs through microsponges keeping geometry of the dosage form intact.26
FTIR is an effective technique to study the material properties and related compatibility traits. FTIR of TCM, XG, EC, their physical mixture and stabilized formulation was done at a resolution of 4 cm−1 for identification of material properties and interactions with each other in the range of 4,000–5,000 cm−1. FTIR of materials provided evidence for physicochemical compatibility of materials.
The FTIR spectra of TCM showed different peaks owing to its extensive structure as shown in Figure 5A. The functional groups relative to various absorption peaks observed in the spectra are given in Table 4. The presence of aromatic ring, amines and carboxyl group was indicated. Table 4 shows the values for peaks observed in the FTIR spectra of XG shown in Figure 5B. The functional groups observed from the IR absorption chart which absorbed radiations in different ranges showed the presence of ringed structures, C=O group and O−H group. The peak for TCM was observed at 1,035 cm−1, while the peak for ECT2 was observed at 1,054 cm−1. It showed the presence of C−O stretch for alcohols and esters, ethers and carboxylic acids, while the presence of peaks at 2,870 and 2,976 cm−1 confirmed C−H stretching. Spectra obtained showed the compatibility of materials in formulation. The FTIR results shown in Figure 5E had the same peaks as observed for materials separately, so this indicated compatibility between formulation ingredients that they did not react during the process of mixing and remained stable in formulation.
Studying the atomic and molecular structure is an effective approach to employ structural dimensions of drug delivery systems and incorporated drugs. This study also carried out XRD of pure drug and selected formulation of TCM-containing microsponges using an X-ray diffractometer. The results obtained are given in Figure 6A and B. XRD results of TCM depicted diffraction at an angle (2θ) of 20°–45°, which indicates crystallinity of pure drug. The results showed an intensity of about 375 (au), starting from a 21° angle. Various peaks of different intensities were obtained. XRD results of ECT2 formulation showed that the formulation of TCM microsponges changed the crystalline structure of TCM to amorphous form, rendering it more soluble. The dense pattern obtained showed the interaction of different materials that brought them together into one formulation, indicating that the drug is present in the form of solid solution with polymeric content.
Zeta potential is the measure of stability of a system based on the charge on the particles and their tendency to form aggregates. This study thus undertook zeta potential analysis for formulations. Its value up to ±30 mV or above describes that particles have enough repulsion to remain separate. The higher the zeta potential values, the more stable the drug delivery system, and vice versa. Moreover, if values decrease, ready coagulation or flocculation of particles will occur. Figure 7 shows the zeta potential distribution data for formulation XECT1 calculated using Malvern UK Nano ZS. The plot shows a peak at −4.105 mV, which means that most of the particles in formulation had this charge on microsponges, showing that the particles had affinity for each other. The range of distribution for all particles in formulation was from −15.339 to 3.384 mV. A high intensity of distribution was found toward negative side showing the acidic nature of ionized particles. Repulsion of particles can be increased by neutralizing the charge on their surface, which can be done by adjusting the pH of the system, so that the particles may not adhere to flocculate. Similarly, zeta size analysis of formulation was done to estimate the size range of particles in formulation using Malvern instrument. The sample was fed into Malvern UK Nano ZS instrument. A software system attached to this instrument gave the plot for data, showing the size range of different particles present in formulation. Size distribution data (Figure 7) showed that 40.67% of particles with a size of 2.30 μm (2,304.71 nm) were present. All particles in formulation fell in the size range of 1.99 μm (1,990.12 nm) to 3.09 μm (3,090.96 nm).
The post-observation period was followed by statistical summarization as an objective method. ANOVA followed by Tukey’s multiple comparisons test revealed that there was a significant difference between the drug content of ECT1 and the rest of EC-based TCM-containing formulations (p<0.05), while only XECT1 showed an exception with insignificant difference in TCM content (p>0.05). ECT2 showed only a significant difference in drug content compared to XECT1 and XECT4 with p-values of 0.007 and 0.0319, respectively. ECT3 and ECT4 were significantly different in terms of drug content compared to XECT1 (p=0.002 and 0.0001, respectively). Content of TCM present in XECT1 was significantly different from XECT2, XECT3 and XECT4 (p<0.05), whereas results of XECT2, XECT3 and XECT4 revealed statistically insignificant variation of drug content between them (Table 5). Results of entrapment efficiency indicated that ECT1 and ECT4, ECT2 and XECT1, ECT3 and XECT1, ECT3 and XECT2, ECT4 and XECT1, ECT4 and XECT2, XECT1 and XECT3, XECT1 and XECT4 and XECT2 and XECT4 were significantly different from each other with p>0.05, while the rest of the formulations were carrying a comparable amount of TCM. The percent yield of the prepared formulations was also statistically analyzed where its values for ECT1 were pointedly varying from the rest of EC and XG-facilitated EC-based formulations with only exception of XECT1.
Similarly, ECT2 showed a significant variation from ECT4, XECT3 and XECT4. There was also a significant difference in percent yield of ECT3 and ECT4, and XECT1 and XECT4. The value of p, which was obtained after analysis between ECT4 and XG-facilitated EC-based microsponges, indicated that the percent yield of ECT4 was significantly varying from all formulations except XECT4. On the other hand, among the XG-based formulations, only XECT2 and XECT3 showed an invariable production yield (p=0.957). Conclusively, formulations with a greater difference in their polymeric content showed a significant variability in stated parameters, confirming a strong association between the amount of polymer and characteristics of microsponges. Formulations with a greater amount of polymer at a constant concentration of TCM showed lesser drug content as well as entrapment efficiency and vice versa.16,17 Physiochemical evaluations, including micromeritics, compatibility of drug and excipients, production yield, drug content and entrapment efficiency, zeta potential, size distribution and drug release, all effectively underlined the potential of TCM-incorporated microsponges as a safe and effective drug delivery system in diverse aspects.
Acknowledgment
The authors are grateful to Almond Pharmaceuticals Pvt. Ltd., Lahore, Pakistan, for providing tacrolimus to accomplish the current work.
Disclosure
The authors report no conflicts of interest in this work.
References
Omura S. Macrolide Antibiotics: Chemistry, Biology, and Practice. San Diego, CA: Academic Press; 2002. | ||
Venkataramanan R, Swaminathan A, Prasad T, et al. Clinical pharmacokinetics of tacrolimus. Clin Pharmacokinet. 1995;29(6):404–430. | ||
Osmani RAM, Aloorkar NH, Ingale DJ, et al. Microsponges based novel drug delivery system for augmented arthritis therapy. Saudi Pharm J. 2015;23(5):562–572. | ||
Patel S, Patel H, Seth A. Microsponge drug delivery system: an overview. JGPT. 2010;2(8):1–9. | ||
Aloorkar N, Kulkarni A, Ingale D, Patil R. Microsponges as innovative drug delivery systems. Int J Pharm Sci Nanotechnol. 2012;5(1):1597–1606. | ||
Kappor D, Patel M, Vyas R, Lad C, Tyagi B. A review on microsponge drug delivery system. JDDT. 2014;4(5):29–35. | ||
Date A, Naik B, Nagarsenker M. Novel drug delivery systems: potential in improving topical delivery of antiacne agents. Skin Pharmacol Physiol. 2006;19(1):2–16. | ||
Srivastava R, Pathak K. Microsponges: a futuristic approach for oral drug delivery. Expert Opin Drug Deliv. 2012;9(7):863–878. | ||
Khan MA, Bolton S, Kislalioglu M. Optimization of process variables for the preparation of ibuprofen coprecipitates with Eudragit S100. Int J Pharm. 1994;102(1–3):185–192. | ||
Villamizar L, Barrera G, Cotes AM, Martínez F. Eudragit S100 microparticles containing Spodoptera frugiperda nucleopolyehedrovirus: physicochemical characterization, photostability and in vitro virus release. J Microencapsul. 2010;27(4):314–324. | ||
D’souza JI, More HN. Topical anti-inflammatory gels of fluocinolone acetonide entrapped in eudragit based microsponge delivery system. Res J Pharm Technol. 2008;1(4):502–506. | ||
Malvern Instruments. Zeta potential: an introduction in 30 minutes. Zetasizer nano series technical note (mrk654-01). 2012. | ||
Sohail MF, Shah PA, Tariq I, et al. Development and in vitro evaluation of flurbiprofen microcapsules prepared by modified solvent evaporation technique. Trop J Pharm Res. 2014;13(7):1031–1038. | ||
Jelvehgari M, Hassanzadeh D, Kiafar F, Loveym BD, Amiri S. Preparation and determination of drug-polymer interaction and in-vitro release of mefenamic acid microspheres made of celluloseacetate phthalate and/or ethylcellulose polymers. Iran J Pharm Res. 2011;10(3):457. | ||
Jelvehgari M, Nokhodchi A, Rezapour M, Valizadeh H. Effect of formulation and processing variables on the characteristics of tolmetin microspheres prepared by double emulsion solvent diffusion method. Indian J Pharm Sci. 2010;72(1):72. | ||
Dhakar RC, Maurya S, Sagar B, Bhagat S, Prajapati S, Jain CP. Variables influencing the drug entrapment efficiency of microspheres: a pharmaceutical review. Pharm Lett. 2010;2(5):102–116. | ||
Dhakar RC. From formulation variables to drug entrapment efficiency of microspheres: a technical review. JDDT. 2012;2(6):128–133. | ||
Keevil B, McCann S, Cooper D, Morris M. Evaluation of a rapid micro-scale assay for tacrolimus by liquid chromatography-tandem mass spectrometry. Ann Clin Biochem. 2002;39(5):487–492. | ||
Orlu M, Cevher E, Araman A. Design and evaluation of colon specific drug delivery system containing flurbiprofen microsponges. Int J Pharm. 2006;318(1–2):103–117. | ||
Jain V, Singh R. Dicyclomine-loaded Eudragit®-based microsponge with potential for colonic delivery: preparation and characterization. Trop J Pharm Res. 2010;9(1):67–72. | ||
Jain V, Singh R. Development and characterization of eudragit RS 100 loaded microsponges and its colonic delivery using natural polysaccharides. Acta Pol Pharm. 2010;67(4):407–415. | ||
Zaman M, Adnan S, Saeed MA, et al. Formulation and in-vitro evaluation of sustained release matrix tablets of cellulose based hydrophilic and hydrophobic polymers loaded with loxoprofen sodium. IAJPR. 2013;3:7389–7398. | ||
Hanif M, Zaman M. Thiolation of arabinoxylan and its application in the fabrication of controlled release mucoadhesive oral films. DARU J Pharm Sci. 2017;25(1):6. | ||
Zaman M, Hanif M, Khan MA. Arabinoxylan based mucoadhesive oral films of tizanidine HCL designed and optimized by using central composite rotatable design. Polym Plast Technol Eng. 2018;57(5):471–483. | ||
Zaman M, Hanif M, Qaiser AA. Effect of polymer and plasticizer on thin polymeric buccal films of meloxicam designed by using central composite rotatable design. Acta Pol Pharm. 2016;73(5):1351–1360. | ||
Costa P, Lobo JMS. Modeling and comparison of dissolution profiles. Eur J Pharm Sci. 2001;13(2):123–133. | ||
Paul D. Elaborations on the Higuchi model for drug delivery. Int J Pharm. 2011;418(1):13–17. |
 © 2018 The Author(s). This work is published and licensed by Dove Medical Press Limited. The
full terms of this license are available at https://www.dovepress.com/terms
and incorporate the Creative Commons Attribution
- Non Commercial (unported, 3.0) License.
By accessing the work you hereby accept the Terms. Non-commercial uses of the work are permitted
without any further permission from Dove Medical Press Limited, provided the work is properly
attributed. For permission for commercial use of this work, please see paragraphs 4.2 and 5 of our Terms.
© 2018 The Author(s). This work is published and licensed by Dove Medical Press Limited. The
full terms of this license are available at https://www.dovepress.com/terms
and incorporate the Creative Commons Attribution
- Non Commercial (unported, 3.0) License.
By accessing the work you hereby accept the Terms. Non-commercial uses of the work are permitted
without any further permission from Dove Medical Press Limited, provided the work is properly
attributed. For permission for commercial use of this work, please see paragraphs 4.2 and 5 of our Terms.