Back to Journals » International Journal of General Medicine » Volume 10
Application of Bayesian decision-making to laboratory testing for Lyme disease and comparison with testing for HIV
Received 8 January 2017
Accepted for publication 7 March 2017
Published 10 April 2017 Volume 2017:10 Pages 113—123
DOI https://doi.org/10.2147/IJGM.S131909
Checked for plagiarism Yes
Review by Single anonymous peer review
Peer reviewer comments 3
Editor who approved publication: Dr Scott Fraser
Michael J Cook,1 Basant K Puri2
1Independent Researcher, Highcliffe, 2Department of Medicine, Hammersmith Hospital, Imperial College London, London, UK
Abstract: In this study, Bayes’ theorem was used to determine the probability of a patient having Lyme disease (LD), given a positive test result obtained using commercial test kits in clinically diagnosed patients. In addition, an algorithm was developed to extend the theorem to the two-tier test methodology. Using a disease prevalence of 5%–75% in samples sent for testing by clinicians, evaluated with a C6 peptide enzyme-linked immunosorbent assay (ELISA), the probability of infection given a positive test ranged from 26.4% when the disease was present in 5% of referrals to 95.3% when disease was present in 75%. When applied in the case of a C6 ELISA followed by a Western blot, the algorithm developed for the two-tier test demonstrated an improvement with the probability of disease given a positive test ranging between 67.2% and 96.6%. Using an algorithm to determine false-positive results, the C6 ELISA generated 73.6% false positives with 5% prevalence and 4.7% false positives with 75% prevalence. Corresponding data for a group of test kits used to diagnose HIV generated false-positive rates from 5.4% down to 0.1% indicating that the LD tests produce up to 46 times more false positives. False-negative test results can also influence patient treatment and outcomes. The probability of a false-negative test for LD with a single test for early-stage disease was high at 66.8%, increasing to 74.9% for two-tier testing. With the least sensitive HIV test used in the two-stage test, the false-negative rate was 1.3%, indicating that the LD test generates ~60 times as many false-negative results. For late-stage LD, the two-tier test generated 16.7% false negatives compared with 0.095% false negatives generated by a two-step HIV test, which is over a 170-fold difference. Using clinically representative LD test sensitivities, the two-tier test generated over 500 times more false-negative results than two-stage HIV testing.
Keywords: false-positive test, false-negative tests, probability of disease, serology testing methodology, Lyme borreliosis, Bayes’ theorem, two-tier test, test sensitivity, ELISA test, Western blot test, HIV testing
Lyme disease
Lyme disease (LD) (or Lyme borreliosis, LB) is a tick-borne disease and the fastest growing zoonosis in many parts of the world. It is caused by a spirochaetal pathogen resident in various animal hosts and can be transmitted by tick vectors of the genus Ixodes. In Europe, the most frequent vector is Ixodes ricinus, while in the US it is Ixodes scapularis. The ticks take a blood meal at each stage of their life cycle and can be infected with LB when they feed on an infected host. Typical hosts for Borrelia spirochaetes are small- to medium-sized mammals, including many species of rodents, foxes, sheep, and deer. Humans can be infected when working in, or visiting, endemic areas, when human habitation encroaches on tick habitat and when companion animals bring infected ticks into contact with humans. The disease can manifest with a wide range of symptoms including fatigue and headaches, and sometimes with a characteristic rash (erythema migrans), and when disseminated to other organs of the body, the disease can cause arthritis-like pain, carditis, peripheral neuropathy, and neurocognitive symptomatology.
The two-tier LD test
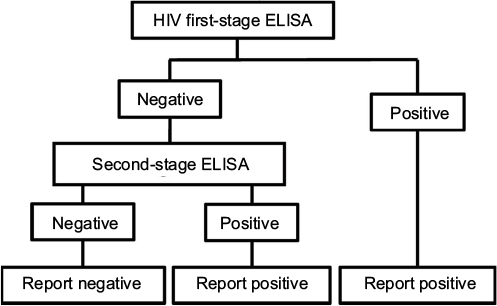
A number of tests can be used to detect LD, the most common being the enzyme-linked immunosorbent assay (ELISA) and the electrophoresis-based Western blot (WB) (also known as an immunoblot). Both depend on technologies that detect antibodies generated as a response to infection. Each can be, and is frequently, used independent of the other. However, a methodology using both tests was discussed at the Second National Conference on Serologic Diagnosis of Lyme Disease in 1994 and associated workshops and recommended for disease surveillance by the US Centers for Disease Control and Prevention (CDC), and for clinical diagnosis by a review panel at that time.1 The procedure uses the two tests in a sequential fashion with the ELISA test being the first step (or, less commonly, an immunofluorescence assay). Positive or equivocal samples are then subjected to a confirmatory WB test (Figure 1); this can be carried out on the same sample as used for the first step. If the first step is negative, the second step is not carried out. Furthermore, the CDC recommends that one should not jump straight to the second step without carrying out the first step.
 | Figure 1 Flow diagram of logical AND two-tier test methodology for Lyme disease. Abbreviation: ELISA, enzyme-linked immunosorbent assay. |
The CDC algorithm has been widely adopted in guidelines published by a number of organizations, including those by the Infectious Disease Society of America,2 the British Infection Association,3 and the European Society of Clinical Microbiology and Infectious Diseases.4 The aim of this test methodology was to reduce the rate of occurrence of false-positive results based on the hypothesis that while the first test was highly sensitive to LD, it could also give a positive result if a non-LD patient were suffering from a tick-borne relapsing fever, infection with Treponema denticola, Treponema pallidum, Epstein–Barr virus, Anaplasma spp., Leptospira spp., or Helicobacter pylori, or other disorders.
The two-stage HIV infection test
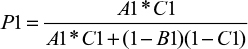
The primary serology tests for HIV are also ELISAs. The present analysis is based on an independent study of six test kits designed for rapid testing of samples. The performance characteristics are shown in Table 1. A two-stage test methodology is sometimes used in order to maximize the test accuracy. In this strategy, a first test is used, and a sample testing positive is defined as positive for infection. All negative tests are submitted to a second test, and positive results are defined as positive for infection (Figure 2).
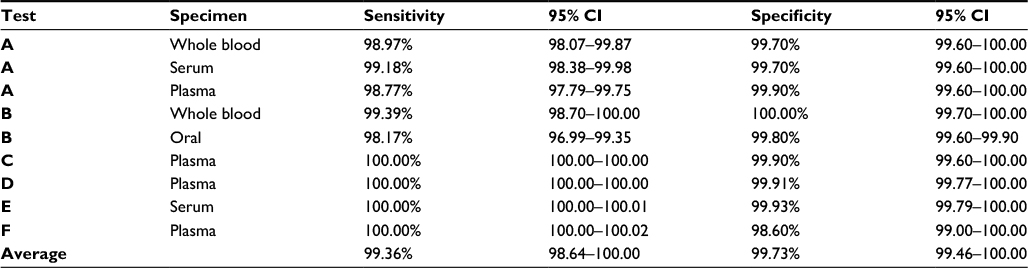 | Table 1 HIV “rapid” serology test performance Abbreviation: CI, confidence interval. |
 | Figure 2 Flow diagram of logical OR test methodology for HIV. Abbreviation: ELISA, enzyme-linked immunosorbent assay. |
Bayes’ theorem and its application in medical diagnosis
Thomas Bayes developed a method to predict the point conditional probability of an outcome by using limited data to make an estimate and improve the result based on future information. His work was presented posthumously to the Royal Society in 1763 by Richard Price.5 Later, and independently, Laplace developed the concept and published his work in 1820.6 An early use of Bayesian analysis in medicine was in 1951, when Cornfield published the results of his analysis to demonstrate an association between smoking and lung cancer.7 A statistical methodology developed from the original theory, which applied to point probabilities, is known as Bayes’ theorem and relates the probability for event A given a condition B as
|
|

This has been applied to medical testing with the following definitions:
p(A|B): the probability of having a disease (A) given a positive test result (B)
p(B|A): probability of a positive test result (B) given disease A, that is, the test sensitivity
p(B|not A): probability of a positive test result given disease A is not present, that is, 1 – test specificity
p(A): probability of having the disease = prevalence in the test group = C
p(not A): probability of not having the disease = 1 – prevalence = 1 – C
The equation has been used to characterize the probability of disease given a positive diagnostic test for a number of conditions, including screening for breast cancer,8,9 and to evaluate the performance of ELISA and culture testing in Johne’s disease (bovine paratuberculosis).10
The expression for Bayes’ theorem in Equation 1 is modified by substituting sensitivity (A), specificity (B), and prevalence (C) and can be written as:
|
|

and
|
|

Application of Bayes’ theorem to the two-tier Boolean logical AND algorithm for LD testing 
The two-tier test for LD diagnosis is a logical “AND” methodology requiring a positive (or equivocal) result from the ELISA preliminary screening test, and a positive result from the second WB test (Figure 1). For the two-tier Lyme algorithm, the single-step equation has been extended by defining the probability of the disease identified in the second test as the probability of a positive result from the first-tier test.
For any two events A and B, the multiplication law (or product rule) of probability is
|
|

which, if A and B are independent, simplifies to
|
|

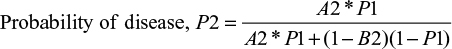
If the probability of disease in the first test is P1, then the first-tier equation is
|
|
When the positive test samples are subjected to the second test, the prevalence of disease will be C2 and equal to the prevalence in the sample submitted to the second test, which is P1.
The Bayesian equation for a two-tier AND test becomes
|
|
and
|
|

Probability of false negatives with the two-tier Boolean logical AND algorithm used for LD testing
Algorithms have been developed to define false negatives for single- and two-tier tests.
For a single-step test, the equation is trivial. The first-stage test sensitivity is equal to S1.
|
|

All positive samples are submitted to the second test with sensitivity equal to S2 and a false-negative probability of (1 – S2). The probability of a false negative at the second test is the product of the sensitivity from the first test and the false-negative probability of the second test:
|
|
The probability of false negatives from both tests is
|
|

Probability of false-negative results for the two-stage Boolean logical “OR” test algorithm used for HIV testing 
The two-step test frequently used for the diagnosis of HIV is a logical “OR” test.
Positive results from a first test are defined as a positive result, and all negative tests are submitted to a second, different test. A sample is considered to be positive if results are positive with either the first-stage test or the second-stage test (Figure 2). As before, we have
|
|

In this methodology, the negatives from the first test are submitted to the second test, and the overall probability of a false negative, by the multiplication law, is
|
|
Independence of tests used for LD and HIV testing
Both the ELISA and WB tests used for LD depend on detection of antibodies produced as a response to infection and so have a degree of dependence. This has been quantified based on published data and has been used to modify the sensitivity of the second-stage test. The dependence of the first-stage and second-stage tests has been determined by comparing the published sensitivities of the first- and second-stage tests and the sensitivity recorded for two-tier tests. The models in Equations 6 and 7 were modified by adding a dependence factor to the sensitivity of the second-stage test. The method is shown in the “Test dependence” section in the Supplementary materials.
In the case of HIV testing, although the two tests are based on the same technology (detection of antibodies), the sensitivity and specificity of each test are typically >99%. In this case, the second test is designed to eliminate analytical and post-analysis errors, including determinate and random errors encountered in medical laboratory practice such as intra-analysis errors, for example, process variability, reagent age/concentration, processing errors, and post-analysis errors including data entry and transcriptions errors.11 These are discussed by Parry et al in relationship to HIV testing.12
Model parameter inputs
In many fields of medicine, screening tests are carried out to identify disease at an early stage. Usually, the selection of samples is based on known risk factors, for example, screening for breast cancer based on gender and age, bowel cancer based on age, and prostate cancer based on gender and age. Use of Bayes’ theorem has demonstrated that this can lead to significant numbers of false positives.
In the case of LD, testing is generally carried out on samples where there is a clinically defined risk based on symptoms and risk assessment, and used as part of the diagnosis. The present analysis defines the performance of single- and two-tier testing for clinically suspected LD; the probability of disease in samples sent by clinicians has been varied from 5% in stages up to 75% as inputs to the model. The level of 5% also represents historical LD prevalence recorded in the general populations of many countries in Europe, although some regions and subpopulations have much higher prevalence rates.
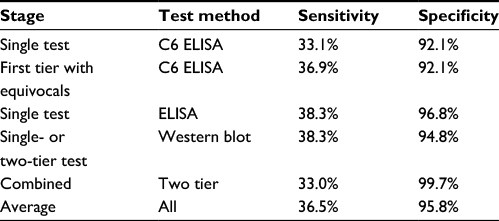
The sensitivity and specificity of commercial LD tests were derived from analyses of data published in 20 independent studies carried out over a 20-year period up to 2016.13–32 This was detailed in the meta-analysis study carried out by Cook and Puri published recently.33 The data from these studies are based on two types of serum samples. One group consisted of samples from patients fulfilling the CDC criteria for LD in which the patients manifested the characteristic erythema migrans rash and were also positive as identified using antibody detection tests. The second group of samples were from patients defined as being positive for LD based on definitive symptomology. The first-group samples exhibited consistently higher sensitivities. In theory, they should all have been 100% positive by subsequent testing, although this was never achieved. The actual sensitivities for the first group with an expected sensitivity of 100% are shown in Table 2.
 | Table 2 Lyme disease serology test performance Notes: When C6 ELISA is used as a single test, only positives are reported. When used as the first stage of a two-tier test, both positives and equivocal samples are submitted to the confirmatory Western blot. Abbreviation: ELISA, enzyme-linked immunosorbent assay. |
These gave the best-case data and were used to generate the data presented in the main section of this paper. Statistical analysis with data from the second group of samples where the test kits demonstrated lower sensitivities and more accurately reflected test performance with clinical samples are shown in the “Statistical analysis” section in the Supplementary materials.
The data for HIV were derived from a study of six “rapid” HIV test kits shown in Table 1.34
Probability of disease given positive results for single- and two-tier tests
Based on the model inputs, the performance characteristics of the three LD test technologies and the mean of six ELISA tests for HIV are summarized in Table 3.
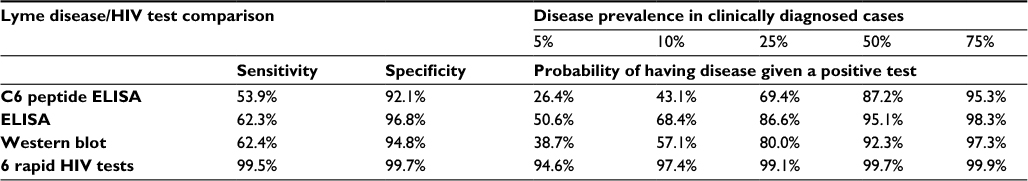 | Table 3 Probability of having Lyme disease given a positive test Abbreviation: ELISA, enzyme-linked immunosorbent assay. |
For LD, the probability of having the disease given a positive test was 26.4% using the C6 ELISA with a disease prevalence of 5%, and the highest probability was 97.3% using WB in which the disease prevalence in the samples was 75%. The higher the prevalence of disease in the samples, the higher was the probability of disease with a positive test. However, when the prevalence was <50%, the tests performed poorly. These results were compared with HIV testing in which the probability of having disease with a positive test varied from a low of 94.6% to a high of 99.9% over the total range of input prevalence.
Using the same input data and test parameters, Equation 6 was used to determine the probability of not having the disease given a positive test result (i.e., false positive) for the C6 ELISA and compared with the mean sensitivity of HIV testing. The results are summarized in Table 4.
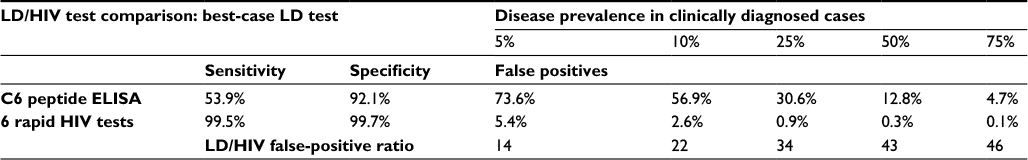 | Table 4 False-positive results from C6 ELISA and HIV tests with the probability of not having Lyme disease given a positive test Abbreviations: ELISA, enzyme-linked immunosorbent assay; LD, Lyme disease. |
When the prevalence of disease in the samples was low at 5%, the false-positive rate for LD testing was 73.6%, and when the prevalence was 50%, the false-positive rate was 12.8%. HIV testing generated a false-positive rate at 5% prevalence of 5.4%, and a false-positive rate of 0.3% when 50% of the samples were positive. The number of false-positive results for LD testing was up to 46 times greater than that for HIV testing.
Moving from the single-step test to the two-tier testing recommended as giving the most accurate test results, Equation 7 was used, and the results are shown in Table 5. This compares a single C6 ELISA test to the two-tier test, and both positive and equivocal samples from a first-stage C6 ELISA were sent to the second-tier WB test. The probability of equivocal test results was quantified from the published data and incorporated in the computation of the sensitivity of the C6 ELISA test when used for first stage.
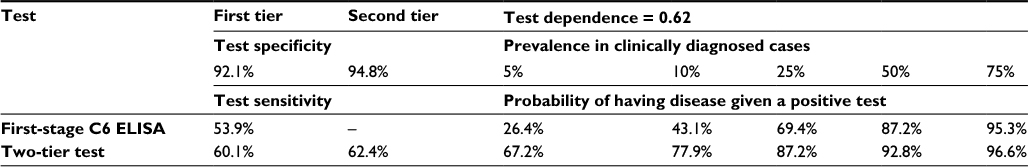 | Table 5 Probability of disease with a single-test and the two-tier test method Abbreviation: ELISA, enzyme-linked immunosorbent assay. |
When using the two-tier test, the probability of having the disease given positive tests improved from 26.4% to 67.2% when the prevalence in the samples was 5%, and from 87.2% to 92.8% when the prevalence was 50%, but this was still lower than the performance of a single-step HIV test.
The corresponding data for false-positive results are shown in Table 6.
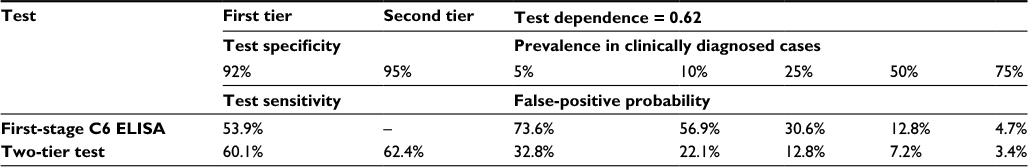 | Table 6 False-positive probability for single-stage and two-tier testing Abbreviation: ELISA, enzyme-linked immunosorbent assay. |
Use of the two-tier test reduced false-positive results from 73.6% to 32.8% with a prevalence of 5% in the samples, and from 12.8% to 7.2% with a prevalence of 50% in the clinical samples. Again, this represented a poor performance compared with the false-positive rate of 0.3% for a single-step HIV test with a prevalence of 50% in the samples.
False negatives and a comparison between LD and HIV testing
While false-positive test results are important and contribute to the cost and risk of unnecessary treatment, there is an impact on health outcomes from false-negative test results. The probability of false negatives was quantified by Equations 10 and 12. The sensitivity of LD tests is known to vary during the time of infection and has been quantified in the studies referenced. In the early stage of disease, the sensitivity can be low, and the antibody response of patients increases over time when the disease disseminates to joints and the central nervous system, with an associated increase in test sensitivity. The sensitivities of the ELISA and WB tests for the different stages of disease have been used to generate weighed sensitivities for each test method for each stage of the disease as defined in the referenced sources, these being early, convalescent, and neurological/arthritis. In addition, two intermediate sensitivities have been used for charting purposes. ELISAs for HIV are capable of reliable detection of infection ~21 days after transmission, and so the chart has been created starting with the lowest sensitivity recorded by the six test kits, 98.3%, rising to 99.9%.35 The published data did record sensitivities of 100% for test kits, and if those were maintained in medical laboratories, the false-negative results would have been zero. For the two-stage HIV test, the same test kits have been used for both stages. This generates test sensitivities from worst to best case. When different kits are used for the two stages, intermediate results are generated. The results for both LD and HIV are shown in Table 7.
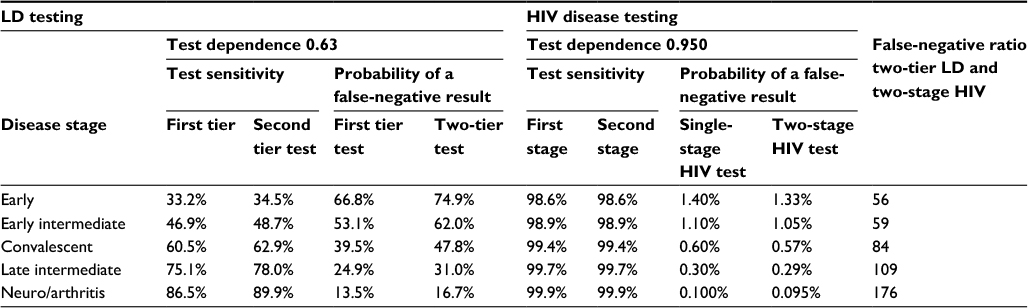 | Table 7 Comparison of false-negative results for LD and HIV testing methodologies Abbreviation: LD, Lyme disease; Neuro, neurological. |
For early-stage LD, the rate of false-negative results was 66.8% for a single ELISA test, and this increased to 74.9% for the two-tier test. The least sensitive HIV test when used for the two-stage test generated a false-negative test result of 1.3%. The two-tier LD test generated ~60 times more false-negative results than the two-step HIV test when using the test kits with the lowest sensitivity. For LD samples where there were neurological and/or arthralgia symptoms, the probability of false negatives for a single test was 13.5%, which increased to 16.7% for the two-tier test. This compares to a false-negative rate for a single HIV test varying from 1.4% down to 0.1%, and with a two-stage HIV test with false negatives declining from 1.33% down to 0.095%. These findings indicate that LD testing for disseminated disease generates over 180 times as many false-negative results as generated by the most sensitive HIV tests used in two stages (Figure 3).
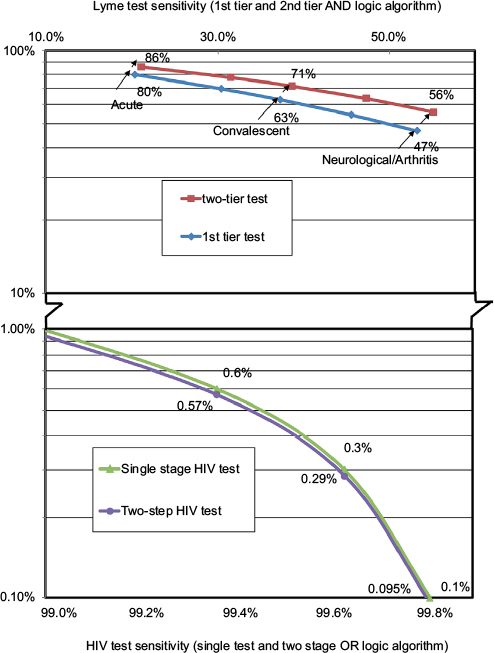 | Figure 3 False-negative percentage based on sensitivities with positive samples. |
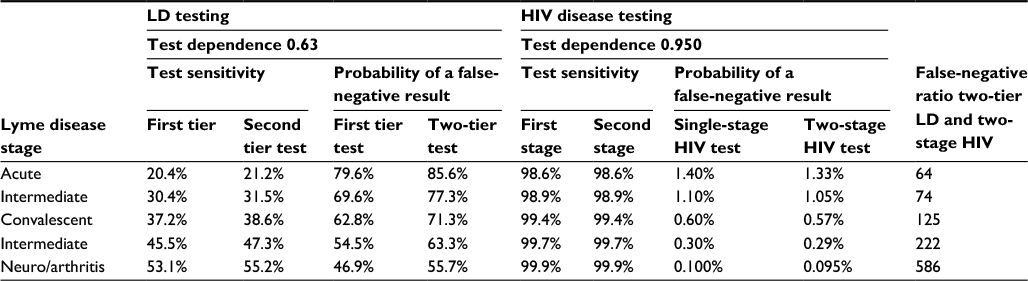
The results presented are best-case results where the test kit sensitivities were characterized by samples proven positive using the CDC criteria. Some studies cited in this paper used well-characterized clinically defined LD samples, and these data have been used in the models and are shown in Tables 8–10. Based on these data for early-stage LD and a single test, the false-negative probability was 79.6% for a single test and increased to 85.6% when the two-tier test was used. The two-tier LD test generated 64 times more false negatives than a two-stage HIV test. For late-stage disease, when neurological and/or arthralgia symptomatology was present, the false-negative rate for the two-tier LD test was 55.7%, generating over 500 times more false negatives than the two-stage HIV test.
Discussion
The accuracy of serological testing for infectious diseases is paramount for optimum diagnosis and successful treatment. Bayes’ theorem and an algorithm developed to extend Bayesian methodology to the two-tier methodology recommended for testing for LD and other algorithms were used to characterize test performance for two diseases, LD and HIV. Input data to the models were based on independent evaluation of commercial test kits and a range of disease prevalence rates in samples sent for analysis by clinicians based on symptoms and risk. With a 5% prevalence of disease in the samples, the probability of LD given a positive LD diagnosis was 26.4% using a C6 ELISA test, and 94.6% with a single-step HIV test. The corresponding false-positive test results were 73.6% for LD testing, and 5.4% for HIV; the LD test generated 14 times more-false positive results than the HIV test. When the test samples were 50% positive for disease, LD testing generated 43 times more false positives than HIV testing. For the two-tier LD test, the probability of false positives improved to 32.8% with a 5% prevalence and 7.2% with a 50% prevalence of disease in the samples.
Because of the highly variable symptoms, it is possible that some cases may be misdiagnosed. For example, evidence exists that some patients with Alzheimer’s disease have Borrelia within their brains,36,37and underdiagnosis and underreporting have been discussed.38,39 Also, reporting levels for notifiable diseases as low as 7% of cases have been described, which results in low official numbers.40 In 2012, the CDC raised their estimate of Lyme cases in the US by a factor of 10 to >300,000 cases a year. The causes of these problems are diverse and include the restriction of the definition to a single species (Borrelia burgdorferi) carried by a specific vector (I. scapularis) by some authorities, low priority and enforcement for reporting, restricting reports to only positive serology results defined by a single laboratory,41 and the high levels of false-negative test results with serology testing as demonstrated in the present study.
False-negative results can impact diagnosis and treatment of LD, and this study indicates that for early-stage disease false-negative results are 66.8% for a single-stage test increasing to 74.9% for the two-tier test. By comparison, HIV testing results in 1.4% false negatives for the worst-case single test and 0.095% false positives with sensitive tests used with a two-step methodology. LD testing in early-/acute-stage disease generated 56 times more false-negative test results than HIV testing, and when neurological/arthralgia symptoms were present, LD testing generated ~180 times more false-negative test results than the two-step HIV tests. When test sensitivities determined with well-characterized clinical samples were used, the models generated false-negative rates as high as 85.6% for the two-tier test and early-stage disease, with 64 times more false negatives than the two-stage HIV test. In late-stage LD, the two-tier test generated >500 times more false negatives than two-step HIV testing. It is of paramount importance that improved sensitivities are achieved for test kits used to guide clinicians and especially so when two tests are used sequentially in the two-tier methodology.
Disclosure
The authors report no conflicts of interest in this work.
References
Proceedings of the Second National Conference on Serologic Diagnosis of Lyme Disease: Association of State and Territorial Public Health Laboratory Directors. October 27–29, 1994: Dearborn, MI. | ||
Wormser GP, Dattwyler RJ, Shapiro ED, et al. The clinical assessment, treatment, and prevention of lyme disease, human granulocytic anaplasmosis, and babesiosis: clinical practice guidelines by the Infectious Diseases Society of America. Clin Infect Dis. 2006;43(9):1089–1134. | ||
British Infection Association. The epidemiology, prevention, investigation and treatment of Lyme borreliosis in United Kingdom patients: a position statement by the British Infection Association. J Infect. 2011;62(5):329–338. | ||
Brouqui P, Bacellar F, Baranton G, et al. Guidelines for the diagnosis of tick-borne bacterial diseases in Europe. Clin Microbiol Infect. 2004;10(12):1108–1132. | ||
Bayes T. An essay toward solving a problem in the doctrine of chances. Philos Trans R Soc London. 1763;53(1763):370–418. | ||
Laplace P-S. Théorie analytique des probabilités 1820. In: de l’Académie des Sciences, ed. Oeuvres Complètes de Laplace. Tome 7. Paris: Gauthier-Villars; 1878. | ||
Cornfield J. A method of estimating comparative rates from clinical data. Appications to cancer of the lung, breast, and cervix. In: Katz S, Johnson NL, editors. Breakthroughs in Statistics: Volume III. New York: Springer; 1997:115–122. | ||
Rosenberg K. Ten-year risk of false positive screening mammograms and clinical breast examinations. J Nurse Midwifery. 1998;43(5):394–395. | ||
McGrayne SB. Applying Bayes’ rule to mammograms and breast cancer. In: The Theory That Would Not Die. New Haven and London: Yale University Press; 2011:255-257. | ||
Wang C, Turnbull BW, Nielsen SS, Gröhn YT. Bayesian analysis of longitudinal Johne’s disease diagnostic data without a gold standard test. J Dairy Sci. 2011;94(5):2320–2328. | ||
Bonini P, Plebani M, Ceriotti F, Rubboli F. Errors in laboratory medicine. Clin Chem. 2002;48(5):691–698. | ||
Parry JV, Mortimer PP, Perry KR, Pillay D, Zuckerman M. Towards error-free HIV diagnosis: guidelines on laboratory practice. Commun Dis Public Health. 2003;6(4):334–350. | ||
Ang CW, Notermans DW, Hommes M, Simoons-Smit AM, Herremans T. Large differences between test strategies for the detection of anti-Borrelia antibodies are revealed by comparing eight ELISAs and five immunoblots. Eur J Clin Microbiol Infect Dis. 2011;30(8):1027–1032. | ||
Bacon RM, Biggerstaff BJ, Schriefer ME, et al. Serodiagnosis of Lyme disease by kinetic enzyme-linked immunosorbent assay using recombinant VlsE1 or peptide antigens of Borrelia burgdorferi compared with 2-tiered testing using whole-cell lysates. J Infect Dis. 2003;187(8):1187–1199. | ||
Binnicker MJ, Jespersen DJ, Harring JA, Rollins LO, Bryant SC, Beito EM. Evaluation of two commercial systems for automated processing, reading, and interpretation of Lyme borreliosis Western blots. J Clin Microbiol. 2008;46(7):2216–2221. | ||
Branda JA, Aguero-Rosenfeld ME, Ferraro MJ, Johnson BJB, Wormser GP, Steere AC. 2-Tiered antibody testing for early and late Lyme disease using only an immunoglobulin G blot with the addition of a VlsE band as the second-tier test. Clin Infect Dis. 2010;50(1):20–26. | ||
Branda JA, Strle F, Strle K, Sikand N, Ferraro MJ, Steere AC. Performance of United States serologic assays in the diagnosis of Lyme borreliosis acquired in Europe. Clin Infect Dis. 2013;57:333–340. | ||
Dessau RB. Diagnostic accuracy and comparison of two assays for Borrelia-specific IgG and IgM antibodies: proposals for statistical evaluation methods, cut-off values and standardization. J Med Microbiol. 2013;62(Pt 12):1835–1844. | ||
Gomes-Solecki MJ, Wormser GP, Persing DH, et al. A first-tier rapid assay for the serodiagnosis of Borrelia burgdorferi infection. Arch Intern Med. 2001;161(16):2015–2020. | ||
Goossens HA, van den Bogaard AE, Nohlmans MK. Evaluation of fifteen commercially available serological tests for diagnosis of Lyme borreliosis. Eur J Clin Microbiol Infect Dis. 1999;18(8):551–560. | ||
Johnson BJB, Robbins KE, Bailey RE, et al. Serodiagnosis of Lyme disease: accuracy of a two-step approach using a flagella-based ELISA and immunoblotting. J Infect Dis. 1996;174:346–353. | ||
Klempner MS, Schmid CH, Hu L, et al. Intralaboratory reliability of serologic and urine testing. Am J Med. 2001;110(3):217–219. | ||
Marangoni A, Sparacino M, Cavrini F, et al. Comparative evaluation of three different ELISA methods for the diagnosis of early culture-confirmed Lyme disease in Italy. J Med Microbiol. 2005;54(Pt 4):361–367. | ||
Marangoni A, Moroni A, Accardo S, Cevenini R. Borrelia burgdorferi VlsE antigen for the serological diagnosis of Lyme borreliosis. Eur J Clin Microbiol Infect Dis. 2008;27(5):349–354. | ||
Mogilyansky E, Loa CC, Adelson ME, Mordechai E, Tilton RC. Comparison of Western immunoblotting and the C6 Lyme antibody test for laboratory detection of Lyme disease. Clin Diagnositic Lab Immunol. 2004;11(5):924–929. | ||
Porwancher RB, Hagerty CG, Fan J, et al. Multiplex immunoassay for Lyme disease using VlsE1-IgG and pepC10-IgM antibodies: improving test performance through bioinformatics. Clin Vaccine Immunol. 2011;18(5):851–859. | ||
Smit PW, Kurkela S, Kuusi M, Vapalahti O. Evaluation of two commercially available rapid diagnostic tests for Lyme borreliosis. Eur J Clin Microbiol Infect Dis. 2015;34(1):109–113. | ||
Tilton RC, Sand MN, Manak M. The western immunoblot for Lyme disease: determination of sensitivity, specificity, and interpretive criteria with use of commercially available performance panels. Clin Infect Dis. 1997;25(Suppl 1):S31–S34. | ||
Tjernberg I, Krüger G, Eliasson I. C6 peptide ELISA test in the serodiagnosis of Lyme borreliosis in Sweden. Eur J Clin Microbiol Infect Dis. 2007;26(1):37–42. | ||
Trevejo RT, Krause PJ, Sikand VK, et al. Evaluation of two-test serodiagnostic method for early Lyme disease in clinical practice. J Infect Dis. 1999;179(4):931–938. | ||
Vermeersch P, Resseler S, Nackers E, Lagrou K. The C6 Lyme antibody test has low sensitivity for antibody detection in cerebrospinal fluid. Diagn Microbiol Infect Dis. 2009;64(3):347–349. | ||
Wormser G, Schriefier M, Aguero-Rosenfeld ME, et al. Single-tier testing withh the C6 peptide ELISA kit compared with two-tier testing for Lyme disease. Diagn Microbiol Infect Dis. 2012;75(1):9–15. | ||
Cook MJ, Puri BK. Commercial test kits for the detection of Lyme borreliosis: a meta-analysis of test accuracy. Int J Gen Med. 2016;9:427–440. | ||
Delaney KP, Branson BM, Uniyal A, et al. Evaluation of the performance characteristics of 6 rapid HIV antibody tests. Clin Infect Dis. 2011;52(2):257–263. | ||
Chu C, Selwyn PA. Diagnosis and initial management of acute HIV infection. Am Fam Physician. 2010;81(10):1239–1244. | ||
Macdonald AB, Miranda JM. Concurrent neocortical borreliosis and Alzheimer’s disease. Hum Pathol. 1987;18(7):759–761. | ||
Miklossy J. Alzheimer’s disease – a neurospirochetosis. Analysis of the evidence following Koch’s and Hill’s criteria. J Neuroinflammation. 2011;8(1):90. | ||
Fallon BA, Kochevar JM, Gaito A, Nields JA. The underdiagnosis of neuropsychiatric Lyme disease in children and adults. Psychiatr Clin North Am. 1998;21(3):693–703. | ||
McKeown P, Garvey P. Lyme disease often under diagnosed says HPSC. Epi-Insight Disease Survellance Report of HPSC Ireland. Available from: http://www.lenus.ie/hse/handle/10147/106714. Published 2009. Accessed March 24, 2015. | ||
Young JD. Underreporting of Lyme disease. N Engl J Med. 1998;338(22):1629–1629. | ||
O’Connell S. Lyme borreliosis and other ixodid tick-borne diseases – a European perspective. In: Institute of Medicine Committee Meeting on Lyme Disease and Other Tick Borne Diseases: The State of the Science. October 11–12, 2010. |
Supplementary materials
Test dependence
The probability of false negatives when using a two-tier test assuming test independence is
|
|

where S1 and S2 are the respective test sensitivities for the first- and second-tier tests.
If the tests are dependent, then the false-negative probability can be represented by
|
|

where D is a measure of (co-)dependence.
With a boundary condition of D = 1, when the tests are independent of each other, the false-negative probability reduces to Equation 1. At the other extreme, when the tests are fully dependent, then D = 0 and the false-negative probability is defined by (1 – S1).
The results from Equation 2 with D varying from 0.55 to 0.85 are shown in Figure S1, and using the sensitivity of 53.7% for the two-tier test as demonstrated in the main text of this paper, the dependence of the enzyme-linked immunosorbent assay (ELISA) and Western blot tests is 0.632.
Model output with test sensitivities achieved in clinical samples
The results shown in the main section were based on best-case sensitivities where the tests were used with samples that had been confirmed as Lyme disease (LD) positive based on the CDC criteria including a history of an erythema migrans rash and positive serology.
Some independent studies used samples where a high probability of disease was present based on clinical symptoms, history, and risk factors. These are shown in Table S1.
This provides data for weighting the sensitivity by disease stage, which is shown in Table S2.
These sensitivities may more accurately reflect test performance when variables include patients using antibiotics and steroid hormones, which can abrogate an antibody response, as well as immunocompromised patients. The probabilities of false-negative tests when using these sensitivities are shown in Table S3.
For early-stage/acute LD samples, the probability of a false-negative result is 80.3% for a single ELISA test and increases to 85.9% with the two-tier test. This indicates that in early-stage LD, false negatives are 65 times greater than for HIV testing. In late-stage/disseminated LD, a single ELISA test results in 48.7% false-negative results which increase to 56.4% with the two-tier test. This indicates that the two-tier test generates ~600 times more false negatives than a two-stage HIV test and is shown graphically in Figure S2.
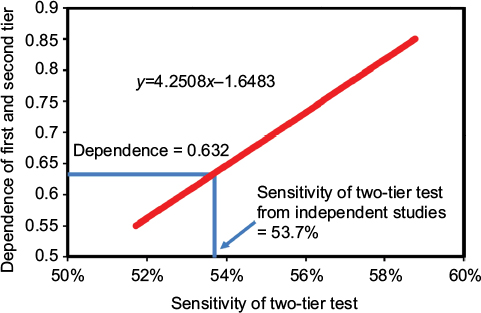 | Figure S1 Dependence of enzyme-linked immunosorbent assay and Western blot test. |
 | Table S1 Lyme disease serology test performance based on clinical samples Notes: When C6 ELISA is used as a single test, only positives are reported. When used as the first stage of a two-tier test, both positives and equivocals are included for the confirmatory Western blot. Abbreviation: ELISA, enzyme-linked immunosorbent assay. |
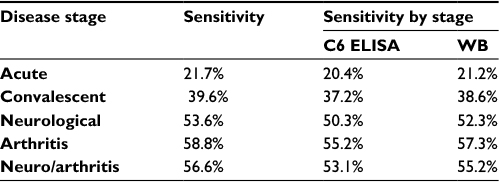 | Table S2 Lyme disease test kit sensitivity for various disease stages based on clinical samples Abbreviations: ELISA, enzyme-linked immunosorbent assay; WB, Western blot. |
 | Table S3 Comparison of false-negative probabilities for LD and HIV testing based on clinical samples Abbreviation: LD, Lyme disease; Neuro, neurological. |
 | Figure S2 False-negative percentage based on test sensitivities with “clinical” samples. |
 © 2017 The Author(s). This work is published and licensed by Dove Medical Press Limited. The
full terms of this license are available at https://www.dovepress.com/terms
and incorporate the Creative Commons Attribution
- Non Commercial (unported, 3.0) License.
By accessing the work you hereby accept the Terms. Non-commercial uses of the work are permitted
without any further permission from Dove Medical Press Limited, provided the work is properly
attributed. For permission for commercial use of this work, please see paragraphs 4.2 and 5 of our Terms.
© 2017 The Author(s). This work is published and licensed by Dove Medical Press Limited. The
full terms of this license are available at https://www.dovepress.com/terms
and incorporate the Creative Commons Attribution
- Non Commercial (unported, 3.0) License.
By accessing the work you hereby accept the Terms. Non-commercial uses of the work are permitted
without any further permission from Dove Medical Press Limited, provided the work is properly
attributed. For permission for commercial use of this work, please see paragraphs 4.2 and 5 of our Terms.