Back to Journals » Clinical Ophthalmology » Volume 11
Applicability of automatic spectral domain optical coherence tomography for glaucoma mass screening
Authors Nakano T, Hayashi T, Nakagawa T, Honda T, Owada S, Endo H, Tatemichi M
Received 22 June 2016
Accepted for publication 7 October 2016
Published 29 December 2016 Volume 2017:11 Pages 97—103
DOI https://doi.org/10.2147/OPTH.S115547
Checked for plagiarism Yes
Review by Single anonymous peer review
Peer reviewer comments 3
Editor who approved publication: Dr Scott Fraser
Tadashi Nakano,1 Takeshi Hayashi,2 Toru Nakagawa,2 Toru Honda,2 Satoshi Owada,3 Hitoshi Endo,3 Masayuki Tatemichi3
1Department of Ophthalmology, The Jikei University School of Medicine, Tokyo, 2Hitachi Health Care Center, Ibaraki, 3Department of Preventive Medicine, Tokai University, School of Medicine, Kanagawa, Japan
Purpose: To perform a preliminary evaluation of the applicability of automatic spectral domain optical coherence tomography (ASD-OCT) for glaucoma mass screening in a population-based setting.
Methods: Information using ASD-OCT (thicknesses of the macular retinal nerve fiber layer [mRNFL], disc retinal nerve fiber layer [dRNFL], ganglion cell layer [GCL] + inner plexiform layer [IPL]; GCL+, and ganglion cell complex [GCL + IPL + RNFL; GCL++]) was obtained from 245 eyes of 123 glaucomatous subjects and 1,454 eyes of 727 normal subjects. For all four measurements, each grid was scored as follows: 2= within 95% of the normal database; 1= within 5%; and 0= within 1%. The sums of each grid (mRNFLs, dRNFLs, GCL+s, and GCL++s) were used as indicators. The effectiveness was estimated by the area under the receiver operating characteristic curve (AUC-ROC). The appropriate algorithm was then applied to 10,145 eyes of 5,088 subjects from the general population (mean age: 50.1±10.3 years).
Results: AUC-ROC of mRNFLs, dRNFLs, GCL+s, and GCL++s was 0.927 (95% confidence interval [CI] =0.903–0.950), 0.919 (95% CI =0.899–0.940), 0.972 (95% CI =0.958–0.986), and 0.972 (95% CI =0.957–0.986), respectively. The discriminant analysis demonstrated that the canonical correlation coefficients of mRNFLs, dRNFLs, GCL+s, and dGCL++s were 0.07, 0.255, 0.661, and 0.207, respectively. AUC-ROC of the discriminant value was 0.971 (95% CI =0.956–0.986). The sensitivity/specificity using GCL+s (cutoff =160) was 81.6%/99.9%. This algorithm was applied to the general population, and 1,658 eyes (16.3%) were found to be positive for glaucoma.
Conclusion: In the case–control setting, ASD-OCT showed a relatively high performance, and the thickness of the GCL + IPL was the best predictor. However, further prospective studies are needed, in which the results of this study are compared to the general population, because the false-positive rate of glaucoma seems to be high.
Keywords: automatic spectral domain optical coherence tomography, glaucoma mass screening, population based, applicability
Introduction
Glaucoma is a leading cause of blindness and its prevalence increases with aging.1 The prevention of glaucoma-induced visual-field loss is an important public health issue to maintain the quality of life in aging populations.2 However, several problems need to be addressed for the primary and secondary prevention of glaucoma. Glaucoma is asymptomatic until its end stage,1 resulting in >75% patients not receiving medical treatment in Japan.3 Thus, the development of an ideal mass screening program is a very important challenge for the maintenance of public health.
We have established a glaucoma mass screening program using frequency-doubling technology (FDT) perimetry. FDT perimetry is particularly applicable for screening in the Japanese population.4,5 However, Iwase et al6 reported that FDT perimetry is not sufficiently sensitive for early-stage glaucoma, despite it being highly specific. As the most important concern for a technique in a population-based setting is a high positive predictive value combined with high sensitivity, we believe that accurate fundus examination in addition to FDT perimetry is ideal.
Optical coherence tomography (OCT) has recently been shown to effectively detect glaucomatous optic nerve neuropathy.7 More recently, automatic spectral domain (ASD)-OCT has been developed. ASD-OCT scans of an eye can be completed within a minute without the requirement of specialist technicians. The present study is a preliminary evaluation of the applicability of ASD-OCT for glaucoma mass screening in a large population-based setting.
Methods
The study protocol was approved by the ethics review boards of Hitachi Hospital and Tokai University School of Medicine. Informed consent was obtained from participants by means of an electronic form.
Subjects were participating in annual health checkups performed in the Hitachi Health Center. This health checkup included mass screening for glaucoma using FDT perimetry (screening mode C-20-1; Carl Zeiss AG, Oberkochen, Germany) and digital fundus photography (Maestro, Topcon Corp., Tokyo, Japan). Glaucomatous subjects were screened when their visual-field abnormality (VFA) was detected by FDT or glaucomatous disc findings (ie, cup-to-disc ratio of >0.7, disc hemorrhage, disc notching, and nerve fiber bundle defects) were detected by a fundus examination. Final diagnosis was performed by ophthalmologists on the basis of a complete ophthalmic examination.
FDT test
VFA was determined by our FDT-VFA protocol.4 Briefly, reliable criteria for FDT perimetry were a maximum false positive of 1/3 and maximum fixation errors of 1/3. Reproducibility was ensured by repeating the evaluation and confirming findings when VFAs were detected by the initial FDT perimetry. A positive result was defined when the spots of the VFA in the retest were the same or were in contact with the abnormal ones detected in the first test. The decision algorithm defined FDT results as positive when the FDT perimetry showed one or more spot of VFA with “mild relative loss” located within the four spots in the center on the nasal side, two or more spots of VFA with “mild relative loss” in any location, or one or more spot of VFA with “moderate relative loss” or “severe loss” in any spots.
OCT measurement
Automatic OCT was performed in all participants, using a 3D OCT-1 Maestro machine (Topcon Corp., Tokyo, Japan). The spectral domain OCT datasets were obtained using the 3D wide scan protocol in which data were obtained in 12×9 mm2 areas (128 scan lines, each comprising 512 A-scans) 8° from the central fixation point within approximately 1.3 seconds’ duration. Registration of the photographs of the fundus and the OCT images was automatically confirmed using an OCT projection image and the localization of major retinal vessels. The disc center was determined as the barycenter of the closed spline curve fitted to seven manually determined points on the disc edge in color fundus photographs obtained simultaneously using the non-mydriatic fundus camera function of the instrument; it was then extrapolated in all OCT images thereafter.
The 3D wide scan demonstrated the retinal thickness map. The thicknesses of the retinal nerve fiber layer (RNFL), ganglion cell layer (GCL), inner plexiform layer (IPL), GCL + IPL (“GCL+”) and GCL + IPL + RNFL (“GCL++”) in 10×10 grids in the macular layer were obtained (Figure 1). The measurement of disk RNFL:dRNFL was obtained in twelve segments in the disc layer (Figure 1). The measurements were expressed in three grades, namely, the thickness within the 95th, 5th, and 1st percentiles of the database among normal subjects.
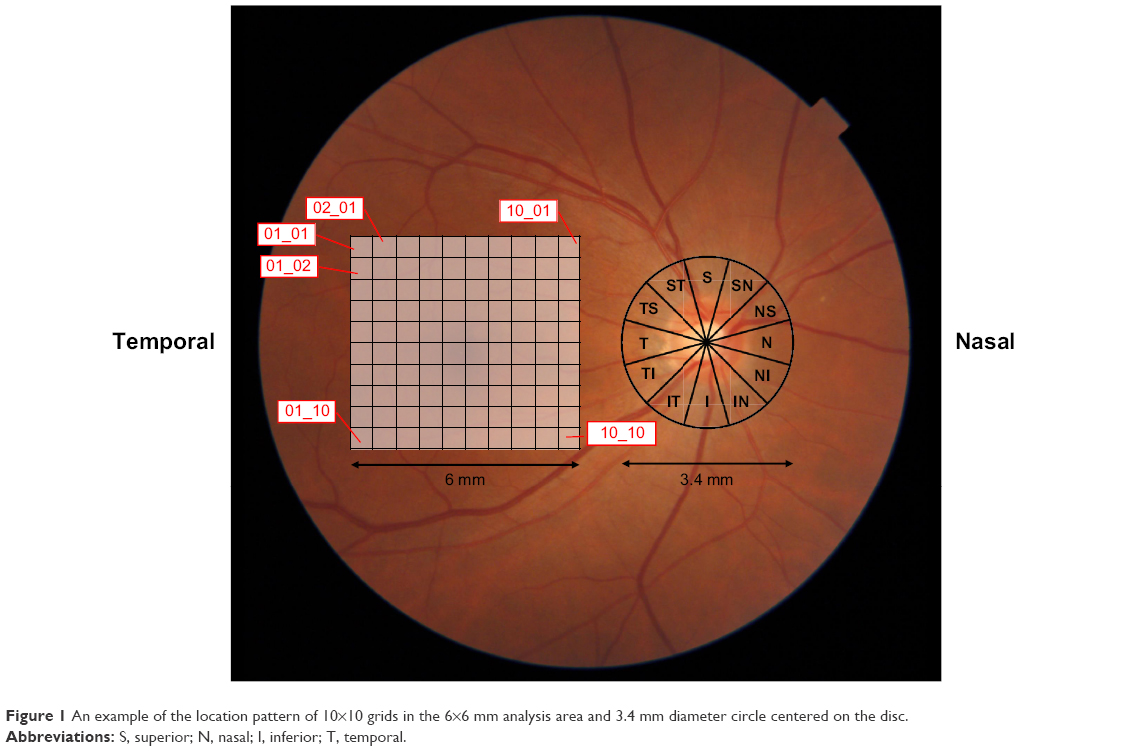 | Figure 1 An example of the location pattern of 10×10 grids in the 6×6 mm analysis area and 3.4 mm diameter circle centered on the disc. |
Study subjects
On initial screening, 123 glaucomatous subjects were identified. These included those subjects with a present history of glaucoma. All subjects were diagnosed with glaucoma by ophthalmologists on the basis of a complete ophthalmological examination. The mean ± standard deviation (SD) age of the subjects was 55.7±8.5 years with a male:female ratio of 114:9. From a total of 2,922 subjects who underwent screening on the basis of a company code, 727 were arbitrarily selected as normal for enrollment in the study because they did not show: 1) any grade of abnormalities in the FDT test; 2) matched findings with Mayama’s protocol8 in the OCT test; 3) any abnormalities on fundus examination; and 4) poor quality of OCT images. Their mean age was 48.5±9.4 years with a male:female ratio of 648:79.
Applicability for general population
We also investigated whether the study protocol was applicable in the general population. We evaluated 10,145 eyes of 5,088 subjects (mean age: 50.1±10.3 years; male:female ratio: 4,531:557) using ASD-OCT, FDT perimetry, and fundus examination.
Statistical analysis
The grade of thickness in each grid was scored as follows: 2= within 95% of the normal eye, 1= within 5% of the normal eye, and 0= within 1% of the normal eye. The score in each 100 grid (10×10) of the mRNFL, GCL+, and GCL++ were added to mRNFLs, GCL+s, and GCL++s. The score in each twelve grid of dRNFL was added to dRNFLs. The effectiveness of the analysis was estimated by calculating the area under the receiver operating characteristic curve (AUC-ROC). Then, a discriminant formula was created using discriminant analysis. Statistical significance for comparisons between two groups was determined using the Mann–Whitney U-test. A P-value of <0.05 was considered significant. All statistical analyses were performed using IBM SPSS version 22 (IBM Corporation, Armonk, NY, USA).
Results
The distribution of the mRNFLs, dRNFLs, GCL+s, and GCL++s values between the normal and glaucomatous eyes are shown in Figure 2. The median [interquartile range] of mRNFLs, dRNFLs, GCL+s, and GCL++s was significantly (P<0.001) higher in the normal subjects (197 [6] vs 130 [45.6], 24.0 [2.0] vs 13.0 [9], 199.0 [4.0] vs 107.0 [80], and 200.0 [2] vs 107.0 [92], respectively). In addition, the distribution of mRNFLs, dRNFLs, GCL+s, and GCL++s stratified by FDT results are shown in Figure S1.
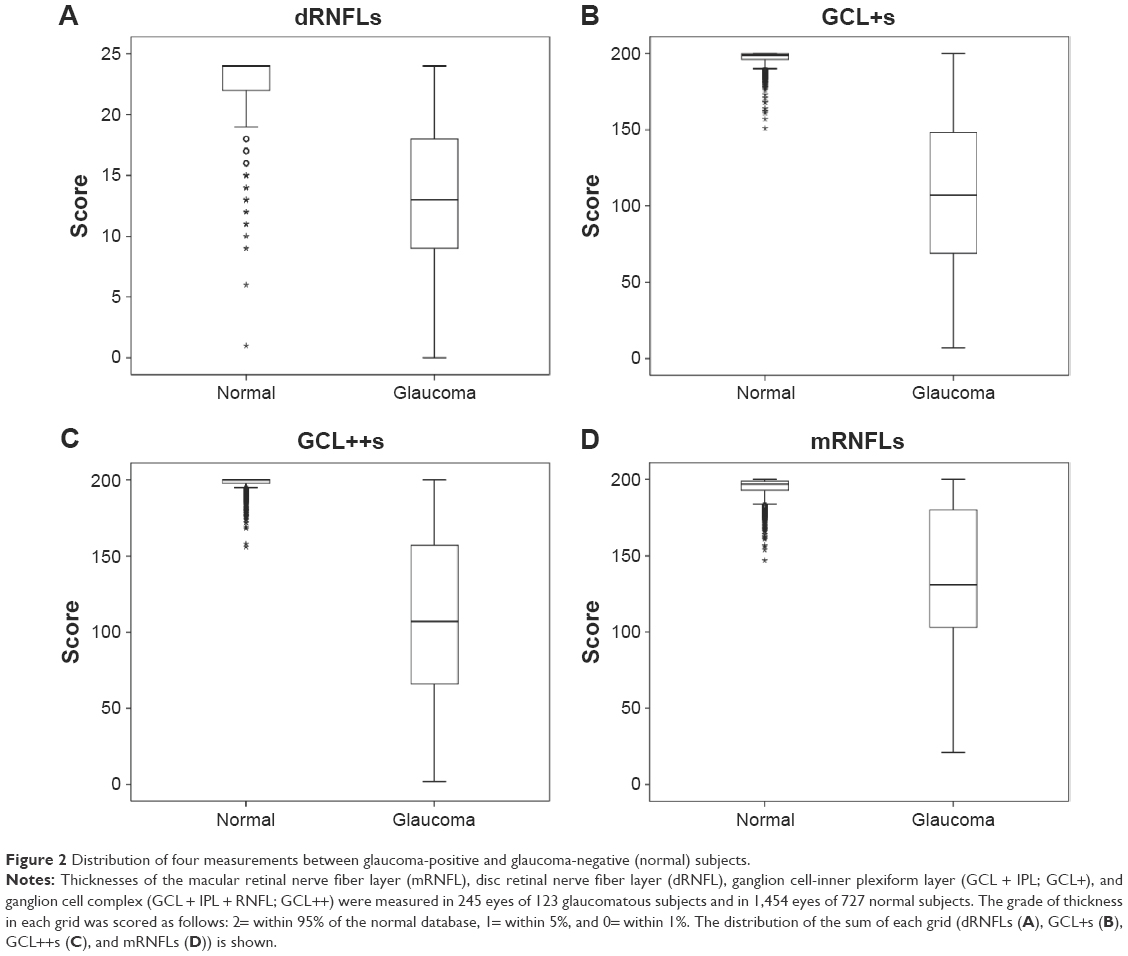 | Figure 2 Distribution of four measurements between glaucoma-positive and glaucoma-negative (normal) subjects. |
Comparisons of ROC curves of mRNFLs, dRNFLs, GCL+s, and GCL++s between the normal and glaucomatous eyes are shown in Figure 3. AUC-ROC values are summarized in Table 1. AUC-ROC of GCL+s was similar to that of GCL++s.
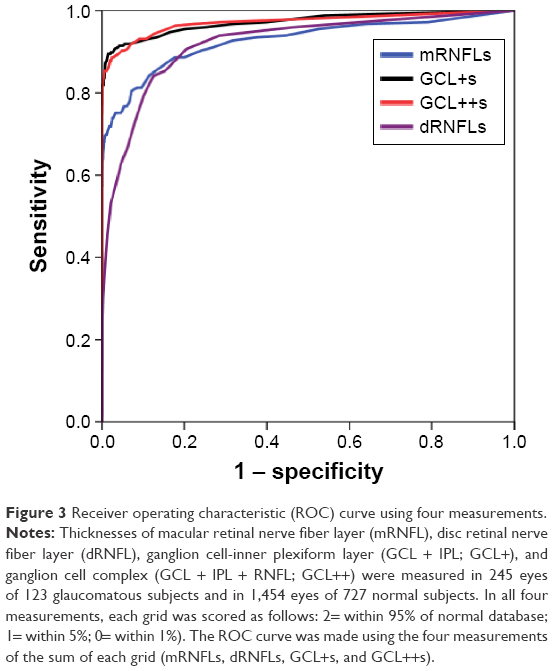 | Figure 3 Receiver operating characteristic (ROC) curve using four measurements. |
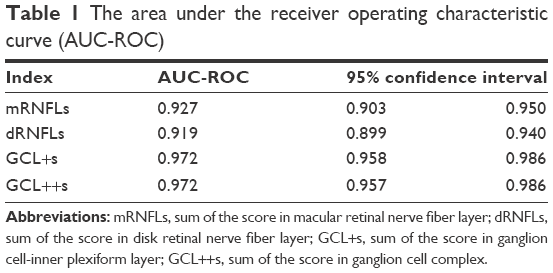 | Table 1 The area under the receiver operating characteristic curve (AUC-ROC) |
In the discriminant analysis, the canonical correlation coefficients of mRNFLs, dRNFLs, GCL+s, and dGCL++s were 0.07, 0.255, 0.661, and 0.207, respectively. AUC-ROC of the discriminant value was 0.971 (95% confidence interval [CI] =0.956–0.986), which was similar to that of GCL+s.
According to these analyses, GCL+s was the best candidate for predictor, and the appropriate cutoff value was 160 according to the ROC curve. The results are shown in Table 2. The sensitivity and specificity values of GCL+s were 81.6% (200/245) and 99.9% (1,452/1,454), respectively; the positive predictive value was 99% (200/202).
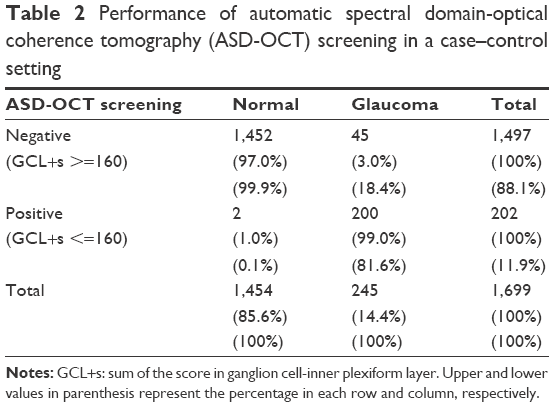 | Table 2 Performance of automatic spectral domain-optical coherence tomography (ASD-OCT) screening in a case–control setting |
Applicability for general population
We applied the protocol for a general population of subjects. Of the 10,145 eyes tested using the ASD-OCT test, 1,658 (16.3%) were found to be positive. The cross tables of FDT perimetry and fundus examination are shown in Table 3. Of the 544 eyes tested with FDT-VFA, 406 (74.6%) were found to be positive according to the ASD-OCT test. The kappa value was 0.313. Of the 210 eyes with fundus test abnormalities, 187 (89%) were positive according to ASD-OCT, and the kappa value was 0.170.
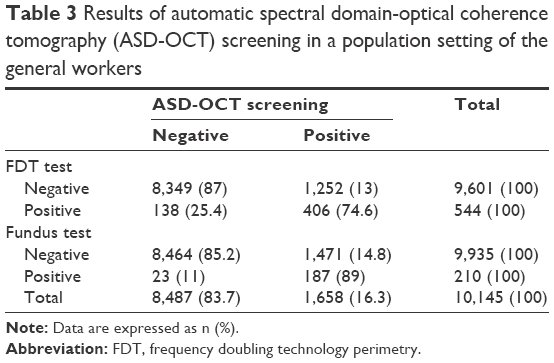 | Table 3 Results of automatic spectral domain-optical coherence tomography (ASD-OCT) screening in a population setting of the general workers |
Discussion
This is, according to our knowledge, the first study to apply ASD-OCT for glaucoma mass screening in a large general population. In the case–control setting, the performance of ASD-OCT for glaucoma mass screening was relatively high. The sensitivity and specificity was 81.6 % and 99.9%, respectively, whereas the positive predictive value was 99%. Thus, we confirmed the applicability of the ASD-OCT test for glaucoma mass screening.
Several studies have reported algorithms for identifying glaucoma using SD-OCT. Yoshida et al9 showed that AUC-ROC was 0.983 using the Random Forest Classifier method. In the current study, although the simply summed values of measurements were used, AUC-ROC was 0.972, which was comparable to that reported by Yoshida et al.9 However, these studies8,9 were conducted in hospital-based case–control settings. In contrast, we created a reasonable study algorithm in a population-based case–control setting and then applied that to a population-based setting; in the latter setting, the glaucoma positive rate was 16.3%, which seemed remarkably high. In addition, we applied the protocol used by Mayama et al8 to our study population (5,208 subjects; mean age, 48 years). In the Mayama et al study,8 the glaucoma positive rate was 13.3% (694 subjects; Nakano, unpublished data, 2016). This rate was also high because the subjects were enrolled from the general population and had a mean age of 50 years. According to the Tajimi Study,3 the prevalence of glaucoma in the Japanese general population is estimated to be <5%. Thus, it seems possible that the previous studies and our current study may have included subjects falsely diagnosed with glaucoma. OCT has a superior ability to detect other ophthalmic diseases, including cataract, myopia, superior segmental optic hypoplasia, and optic nerve hypoplasia, and other neurological diseases, such as Alzheimer’s disease and pituitary tumor.10–13 This may also account for the higher rates of false positives for glaucoma. Therefore, further follow-up studies are needed to determine whether the subjects with a positive ASD-OCT test actually have glaucoma, or other diseases.
In this study, the GCL+ thickness was found to be the most important predictor of glaucoma. With regard to detection ability, there is currently a debate on glaucoma prediction based on evaluations of the papilla or macula, because the initially injured portion varies with each case. GCL+ of the macula was better able to detect parafoveal scotoma within 10° from the center, and RNFL of the papilla was able to detect scotomas of the peripheral nasal step exceeding 10° from the center.14 However, a recent systematic review reported that the range of sensitivity was 65%–75% when the specificity was 90%–95%. The sensitivity of analysis on the papilla was slightly superior to that of the macula.7
This study had several limitations. First, the severity grade of the glaucomatous eye was unknown because we did not obtain information from the standard perimetric test. This was because the study subjects were enrolled from the general population and not from a hospital-based population. As they were from the general population, the severity of the glaucoma detected may show a bias toward being mild. Second, glaucomatous subjects could have been present among those subjects who were screened as normal. To minimize this problem, we screened and analyzed a large number of eyes. Third, our data were biased toward those obtained from men. This institute belongs to a large electronic company. Thus, participants in the health checkup (study population) were industrial employees. In this company, employees were predominantly men. Fourth, the case–control setting is ideally matched for major confounding factors, such as age and sex. In the OCT equipment, OCT results were adjusted for age based on normal data in the database. Because sex was not previously reported to be a confounding factor in the case of glaucoma in Japanese patients,3 we simply compared between subjects diagnosed with glaucoma and normal subjects. Despite these limitations, our data suggest that further prospective studies are needed to assess the usefulness of ASD-OCT for glaucoma mass screening in the general population.
Acknowledgments
This study was supported by Foundation for Total Health and supported by Topcon Corp. (Tokyo, Japan); Maestro was supplied by Topcon Corp.
Disclosure
TN received consulting fees from Topcon Corp.; MT received research funding from Topcon Corp. The other authors report no conflicts of interest in this work.
References
Quigley HA. Glaucoma. Lancet. 2011;377(9774):1367–1377. | ||
Quaranta L, Riva I, Gerardi C, Oddone F, Floriano I, Konstas AG. Quality of Life in Glaucoma: a review of the literature. Adv Ther. Epub 2016 April 30. | ||
Iwase A, Suzuki Y, Araie M, et al; Tajimi Study Group, Japan Glaucoma Society. The prevalence of primary open-angle glaucoma in Japanese: the Tajimi Study. Ophthalmology. 2004;111(9):1641–1648. | ||
Tatemichi M, Nakano T, Tanaka K; Glaucoma Screening Project (GSP) Study Group. Performance of glaucoma mass screening with only a visual field test using frequency-doubling technology perimetry. Am J Ophthalmol. 2002;134(4):529–537. | ||
Tatemichi M, Nakano T, Tanaka K, et al. Laterality of the performance of glaucoma mass screening using frequency-doubling technology. J Glaucoma. 2003;12(3):221–225. | ||
Iwase A, Tomidokoro A, Araie M, Shirato S, Shimizu H, Kitazawa Y; Tajimi Study Group Performance of frequency-doubling technology perimetry in a population-based prevalence survey of glaucoma: the Tajimi study. Ophthalmology. 2007;114(1):27–32. | ||
Oddone F, Lucenteforte E, Michelessi M, et al. Macular versus retinal nerve fiber layer parameters for diagnosing manifest glaucoma: a systematic review of diagnostic accuracy studies. Ophthalmology. 2016;123(5):939–949. | ||
Mayama C, Saito H, Hirasawa H, et al. Diagnosis of early-stage glaucoma by grid-wise macular inner retinal layer thickness measurement and effect of compensation of disc-fovea inclination. Invest Ophthalmol Vis Sci. 2015;6(9):5681–5690. | ||
Yoshida T, Iwase A, Hirasawa H, et al. Discriminating between glaucoma and normal eyes using optical coherence tomography and the ‘Random Forests’ classifier. PLoS One. 2014;9(8):e106117. | ||
Kim KE, Jeoung JW, Park KH, Kim DM, Kim SH. Diagnostic classification of macular ganglion cell and retinal nerve fiber layer analysis: differentiation of false-positives from glaucoma. Ophthalmology. 2015;122(3):502–510. | ||
Leal-Fonseca M, Rebolleda G, Oblanca N, Moreno-Montañes J, Muñoz-Negrete FJ. A comparison of false positives in retinal nerve fiber layer, optic nerve head and macular ganglion cell-inner plexiform layer from two spectral-domain optical coherence tomography devices. Graefes Arch Clin Exp Ophthalmol. 2014;252(2):321–330. | ||
Marziani E, Pomati S, Ramolfo P, et al. Evaluation of retinal nerve fiber layer and ganglion cell layer thickness in Alzheimer’s disease using spectral-domain optical coherence tomography. Invest Ophthalmol Vis Sci. 2013;54(9):5953–5958. | ||
Akashi A, Kanamori A, Ueda K, Matsumoto Y, Yamada Y, Nakamura M. The detection of macular analysis by SD-OCT for optic chiasmal compression neuropathy and nasotemporal overlap. Invest Ophthalmol Vis Sci. 2014;55(7):4667–4672. | ||
Shin HY, Park HY, Jung KI, Choi JA, Park CK. Glaucoma diagnostic ability of ganglion cell-inner plexiform layer thickness differs according to the location of visual field loss. Ophthalmology. 2014;121(1):93–99. |
Supplementary material
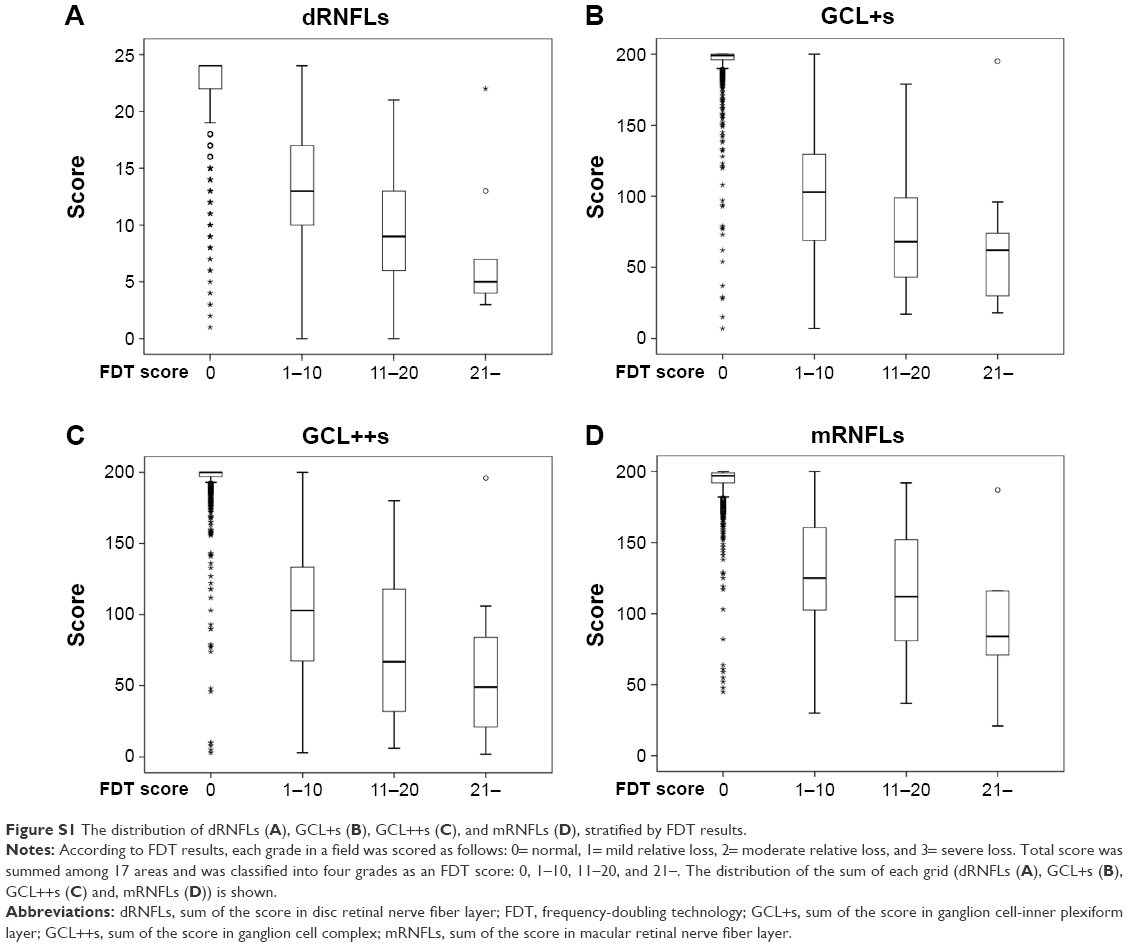 | Figure S1 The distribution of dRNFLs (A), GCL+s (B), GCL++s (C), and mRNFLs (D), stratified by FDT results. |
 © 2016 The Author(s). This work is published and licensed by Dove Medical Press Limited. The
full terms of this license are available at https://www.dovepress.com/terms
and incorporate the Creative Commons Attribution
- Non Commercial (unported, 3.0) License.
By accessing the work you hereby accept the Terms. Non-commercial uses of the work are permitted
without any further permission from Dove Medical Press Limited, provided the work is properly
attributed. For permission for commercial use of this work, please see paragraphs 4.2 and 5 of our Terms.
© 2016 The Author(s). This work is published and licensed by Dove Medical Press Limited. The
full terms of this license are available at https://www.dovepress.com/terms
and incorporate the Creative Commons Attribution
- Non Commercial (unported, 3.0) License.
By accessing the work you hereby accept the Terms. Non-commercial uses of the work are permitted
without any further permission from Dove Medical Press Limited, provided the work is properly
attributed. For permission for commercial use of this work, please see paragraphs 4.2 and 5 of our Terms.