Back to Journals » Cancer Management and Research » Volume 11
Apparent diffusion coefficient in extraprostatic extension of prostate cancer: a systematic review and diagnostic meta-analysis
Authors Bai K, Sun Y, Li W ![]() , Zhang L
, Zhang L
Received 22 October 2018
Accepted for publication 7 March 2019
Published 11 April 2019 Volume 2019:11 Pages 3125—3137
DOI https://doi.org/10.2147/CMAR.S191738
Checked for plagiarism Yes
Review by Single anonymous peer review
Peer reviewer comments 2
Editor who approved publication: Dr Rituraj Purohit
Koudi Bai,1 Yuan Sun,2 Wei Li,3 Lanlan Zhang4
1Department of Radiology, Yancheng First Peoples’ Hospital, Yancheng City, People’s Republic of China; 2Department of Orthopedics, No.97 Hospital of People’s Liberation Army of China, Xuzhou City, People’s Republic of China; 3Department of Medical Imaging, Jiangsu Vocational College of Medicine, Yancheng City, People’s Republic of China; 4Department of Pediatrics, Yancheng Maternal and Child Health Hospital, Yancheng City, People’s Republic of China
Objective: To evaluate the diagnostic performance of apparent diffusion coefficient (ADC) for local staging of prostate cancer.
Methods: Databases of Web of Science, MEDLINE (Ovid and PubMed), Cochrane Library, EMBASE, and Google Scholar were searched up to May 31, 2018, with language restricted to English. All studies concerning multiparametric magnet resonance imaging (mpMRI) with ADC for detection of extracapsular extension (ECE, T3a) and/or extraprostatic extension (EPE, overall stage of T3) were identified by two reviewers independently, and quality of included studies was evaluated using Quality Assessment of Diagnostic Accuracy Studies-2 tool. True positive, false positive, false negative and true negative of each study were extracted to reconstruct the 2×2 tables for evaluating diagnostic accuracy. Summary estimates of sensitivity, specificity, and corresponding 95% CIs were calculated with bivariate model and hierarchical summary receiver operating characteristic model, then presented in forest plots. Multiple subgroup analyses and meta-regression were performed, and publication bias was evaluated with Deeks funnel.
Results: A total of 18 studies were included, with 6 involved ECE and 12 for EPE. Pooled sensitivity was 80.5% (95% CI 76.5–83.9%) with specificity of 69.1% (95% CI 62.3–75.2%). Multiple subgroup analyses showed that if ADC and length of capsular contact are regarded as independent predictors, pooled sensitivity was 85% (95% CI 77–90%) and 81.1% (95% CI 76.0–85.3%), with specificity of 70.8% (95% CI 56.3–82.0%) and 66.6% (95% CI 57.6–74.5%), respectively. Meta-regression demonstrated that there was no substantially significant difference in types of coil, magnet field strength (1.5T versus 3.0T), and analysis method (per-lesion versus per-patient).
Conclusion: By introducing ADC to MRI, we could obtain favorable sensitivity for diagnostic performance of EPE, but with a little decreased specificity.
Keywords: apparent diffusion coefficient, prostatic cancer, magnetic resonance imaging, extraprostatic extension, length of capsular contact
Introduction
Prostate cancer (PCa) is the second leading cause of cancer-related mortality, accounting for the most new cases of cancer among Western countries.1 Despite the fact that most types of PCa grow slowly and may need no intervention, the others are so aggressive that spread quickly. Therefore, early detection and location of PCa is instrumental in proper treatment and then has a better chance of successful treatment. Generally, the detection and local staging of PCa rely on the combination of several different diagnostic outcomes including serum prostate-specific antigen (PSA), tumor volume, Gleason score (GS), and digital rectal examination (DRE), and patients who are suspected of PCa would undergo transrectal ultrasound-guided (TRUS) biopsy.2 Accurate preoperative knowledge is crucial in the determination of optimal therapy such as radical prostatectomy (RP), radiotherapy, and noncurative systemic therapies. However, it is estimated that pretreatment staging modalities that utilize clinical stage, PSA, and TRUS-guided random prostate biopsy inaccurately stratified more than one-third of total patients.3,4 In recent years, multiparametric magnetic resonance imaging (mpMRI) has demonstrated its unique advantages for diagnosis, localizing, and staging of PCa and showed high accuracy. To standardize the evaluation and reporting for PCa with mpMRI, the European Society of Urogenital Radiology published the guidelines of Prostate Imaging Reporting and Data System (PI-RADS v1) in 2012,5 then released an updated edition (PI-RADS v2) in 2015,6 and demonstrated high sensitivity and specificity.7,8 Nevertheless, local staging PCa of extracapsular extension (ECE) (T3a), seminal vesicle invasion (SVI, T3b), and extraprostatic extension (EPE) have worse prognosis while compared to organ-confined disease owing to higher risk of biochemical recurrence and metastatic disease after RP, radiotherapy, and noncurative systemic therapies.9 Thus, the clinical diagnosis of EPE remains challenging, and published literature suggested that the sensitivity for local staging of PCa ranged from 13% to 95%, with the specificity ranging from 49% to 97%.10 A prior meta-analysis revealed that on the whole, MRI has a poor sensitivity of 61% for detecting locally advanced PCa of EPE, with specificity of 88%.11
In the past few years, researchers have developed various approaches to improve the diagnostic performance of EPE, and one of the most frequently reported approaches is by introducing ADC to MRI. However, it has not been assessed systematically, and we, therefore, aimed to evaluate the diagnostic performance of mpMRI for EPE, with RP specimens as the reference standard.
Methods
This systematic review and meta-analysis was performed and the reports comply with the Preferred Reporting Items for Systematic Reviews and Meta-analyses (PRISMA) guidelines.12 Primary outcome of this study was the diagnostic performance (sensitivity and specificity) for EPE when ADC was introduced, and the secondary outcomes were the diagnostic accuracy of ADC and length of capsular contact (LCC) as independent predictors.
Search strategy and selection criteria
We performed a systematic search up to May 31, 2018, and covered databases as follows: Web of Science, MEDLINE (Ovid and PubMed), Cochrane Library, EMBASE, and Google Scholar. Search query combined synonyms for prostate cancer, mpMRI, EPE and ECE as follows: ([prostate] or [prostatic] and [cancer] or [carcinoma] or [tumor] or [PCa]) and ([functional] or [multi-parametric] or [mp] and [magnetic resonance imaging] or [MRI]) and ([ADC] or [apparent diffusion coefficient]) and ([extraprostatic] and [extension]) or ([extracapsular] and [extension]). References listed in qualified studies and review articles have also been screened to avoid omitting any eligible study, and publications were restricted to English. For studies in which data were not completely reported in the article, we contacted the authors for details to reconstruct the 2×2 contingency tables.
Including and excluding criteria
Studies were considered as eligible if they meet all of the following criteria: 1) using mpMRI as index test for local staging of ECE (T3a) or overall stage of EPE, 2) ADC was used to improve diagnosis accuracy, regardless of detailed values were reported or not, 3) reported the detailed data that could reconstruct the 2×2 tables, 4) standard reference was RP, and 5) studies must be original research. Studies were excluded if any of the following criteria were met: 1) using other diagnostic approaches such as ultrasound or positron emission tomography-computed tomography (PET-CT) rather than mpMRI, or just conventional MRI, 2) only involved SVI (T3b) or lymph node, 3) reference standard was not RP but TRUS biopsy or MRI-guided biopsy, 4) case report or sample size <10, and 5) letters, editorials, reviews, conference abstract, guidelines, or meta-analyses. Two reviewers (Bai and Sun) identified the eligible articles independently, and discrepancies were reconciled with discussion and if necessary, with the third reviewer (Li).
Data extraction and quality assessment
Following data were extracted by 2 reviewers independently and recorded in a predefined standardized form: 1) demographic and clinical characteristics, including patient age, prostate volume, PSA level, GS, and prevalence of ECE or EPE; 2) study characteristics which include authors, publication year, country and institution, study design and sample size, number of readers and experience, blinding to histopathological information or not, reference standard, interval between MRI and RP, scoring system, nomogram, or assessment along with corresponding cutoff values; 3) technical characteristics of mpMRI such as MRI manufacturer and model, magnetic field strength, sequences of T1-weighted imaging (T1WI), T2-weighted imaging (T2WI), DWI, and dynamic contrast-enhanced MRI (DCE-MRI), ADC cutoff value. For studies with overlapping patients, the most recently published would be included; however, if techniques and scoring systems were different, all of them would be incorporated. Methodological quality was evaluated using the tailored questionnaires and criteria based on Quality Assessment of Diagnostic Accuracy Studies-2 (QUADAS-2),13 in which four domains are scored: 1) patient selection domain describes the method for patient selection and the patients included, 2) index test domain describes the test being studied, along with how it was performed and interpreted, 3) reference standard domain describes the reference standard test used and how it was performed and interpreted, and 4) finally, flow and timing describe the flow of patient inclusion and exclusion and the interval between the index test and the reference standard. Each domain was assessed as “Yes”, “No” or “Unclear”, 2 reviewers (Bai and Sun) evaluated the quality of each study included independently, and the third reviewer (Li) was in charge of resolving the disagreements, through discussion and adjudication.
2×2 tables of true positive, false positive, true negative, and false negative values were reconstructed for each study to calculate the sensitivity and specificity. For studies that reported more than 1 result, the following strategies were adopted to extract related data: 1) for studies that reported different cutoff thresholds, the most clinically appropriate one was selected, 2) if accuracy was reported by 2 more different readers, we used the more experienced one, 3) in case of more than 2 scoring systems used, we chose the best or the quantitative one, and 4) If different techniques were used in a single study, we selected the most accurate. For studies that did not report sufficient data to reconstruct the 2×2 tables, we contacted the authors to obtain additional information.
Data synthesis and statistical analysis
Summary estimates of sensitivity and specificity along with corresponding 95% CIs were calculated utilizing the bivariate model and hierarchical summary receiver operating characteristic (HSROC) model.14,15 Forest plots were presented to graphically show the variation of sensitivity and specificity to investigate the heterogeneity; in addition, a HSROC curve with a 95% confidence region and prediction region was plotted to depict graphic presentation of the results.15 The Deeks funnel plot was used to evaluate the publication bias, and the Deeks asymmetry test was applied to determine the statistical significance, and a P-value <0.1 for the slope coefficient was regarded as significant asymmetry.16
Multiple subgroup analyses were performed to evaluate various clinical settings as follows: 1) ADC value as independent predictor, 2) LCC as independent predictor, 3) assessment based on PI-RADS, 4) analysis only for ECE. We also performed meta-regression by adding predetermined covariates to the bivariate model: 1) use of any coil (any coil versus none), 2) magnet field strength of MRI (1.5 versus 3.0T), 3) analysis method (per-patient versus per-lesion). All of the analyses were performed with STATA 15.1 (Stata Corporation, College Station, TX, USA), with the modules of “midas” and “metandi”, and P-values <0.05 were considered as statistically significant.
Results
Literature search
Figure 1 demonstrates the concise overview of literature search and identification. The initial search yielded 853 results, of which 281 were excluded for duplication and 443 records were excluded for other reasons, then 129 studies were regarded as potential eligibility. Of them, 6 were excluded for overlapping patient with other studies, 18 were excluded for there was no sufficient data to obtain the 2×2 contingency tables, and 13 studies were ruled out for too small sample size. No additional study was identified through screening the reference list of eligible articles. Finally, a total of 18 original studies were included in this systematic review and meta-analysis.2,4,10,17–31
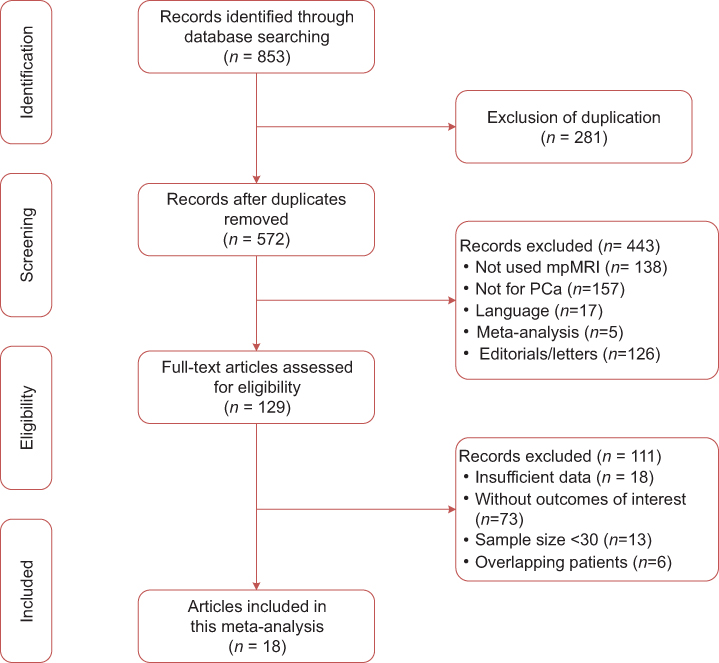 | Figure 1 Study selection process for this systematic review and meta-analysis. |
Characteristics of included studies
There were 6 studies that investigated the diagnosis performance on ECE,21,23–25,27,28 and the remaining 12 studies reported the diagnostic accuracy on EPE.4,10,17–20,22,26,29–31 Sample size of these studies ranged from 43 to 379 patients, and nearly all of them had a mean age ≥60 years. In most of studies, GS ≥5 except the study by Jäderling et al,20 in which there were 9 patients had GS <6.20 PSA level among these studies ranged from 0.02 to 123, with a mean value from 5.9 to 12.24 ng/mL. Only 4 studies reported the data of prostate volume, in spite of the fact that some studies suggested it is possible to play a part in the diagnosis.17,18,21,32 Five studies performed the MRI with 1.5T scanners17,18,21,23,28 and the remaining 13 studies used 3.0T scanners.2,4,10,19,20,22,24,25,27,29–32 Except 5 studies,2,23,24,27,29,31 all of the others were used at least one type of endorectal, pelvic phased array (PPA), or body coil; moreover, 2 studies used two types of them (endorectal coil and PPA).28,30 Besides T2WI, the most used functional imaging protocol was DWI; in fact, it was applied by all of the included studies. DCE-MRI also performed broadly, performed by 14 studies (2 studies not used it for analysis). Several studies performed T1WI protocol, but only for excluding hemorrhage. ADC values obtained from DWI protocol were 0/50/100/400/500/800/1,000/1,500 and 2,000 s/mm2, but most studies only used 2–3 values of them. Sixteen studies reported the specific ADC values, whereas the remaining 2 study did not give further details.23,32
For scoring system or assessment, there were several types existed across these studies. There were 3 studies that used PI-RADSv1 and 2 that used PI-RADSv2, and most of them adopted scored 3 or 4 as the cutoff value.4,20,30,31 Four studies used the ADC values alone for assessment, with cutoff threshold ranging from 0.72 to 0.89.17–19,27 Only 1 study used the prostate volume for evaluation.10 Finally, the most used independent quantitative predictor was LCC, adopted by 8 studies, and the best threshold reported according to them varied from 6 to 20 mm.2,21,22,24–26,28,29 Therefore, as a whole, nearly three-quarters of included studies used quantitative assessments, leading to better reproducibility. Demographic characteristics of included studies are summarized in Table 1, and clinical and technical characteristics are demonstrated in Table 2. Several studies used more than 2 analysis methods or techniques, and performed comparison; however, we only reported the best or quantitative one.
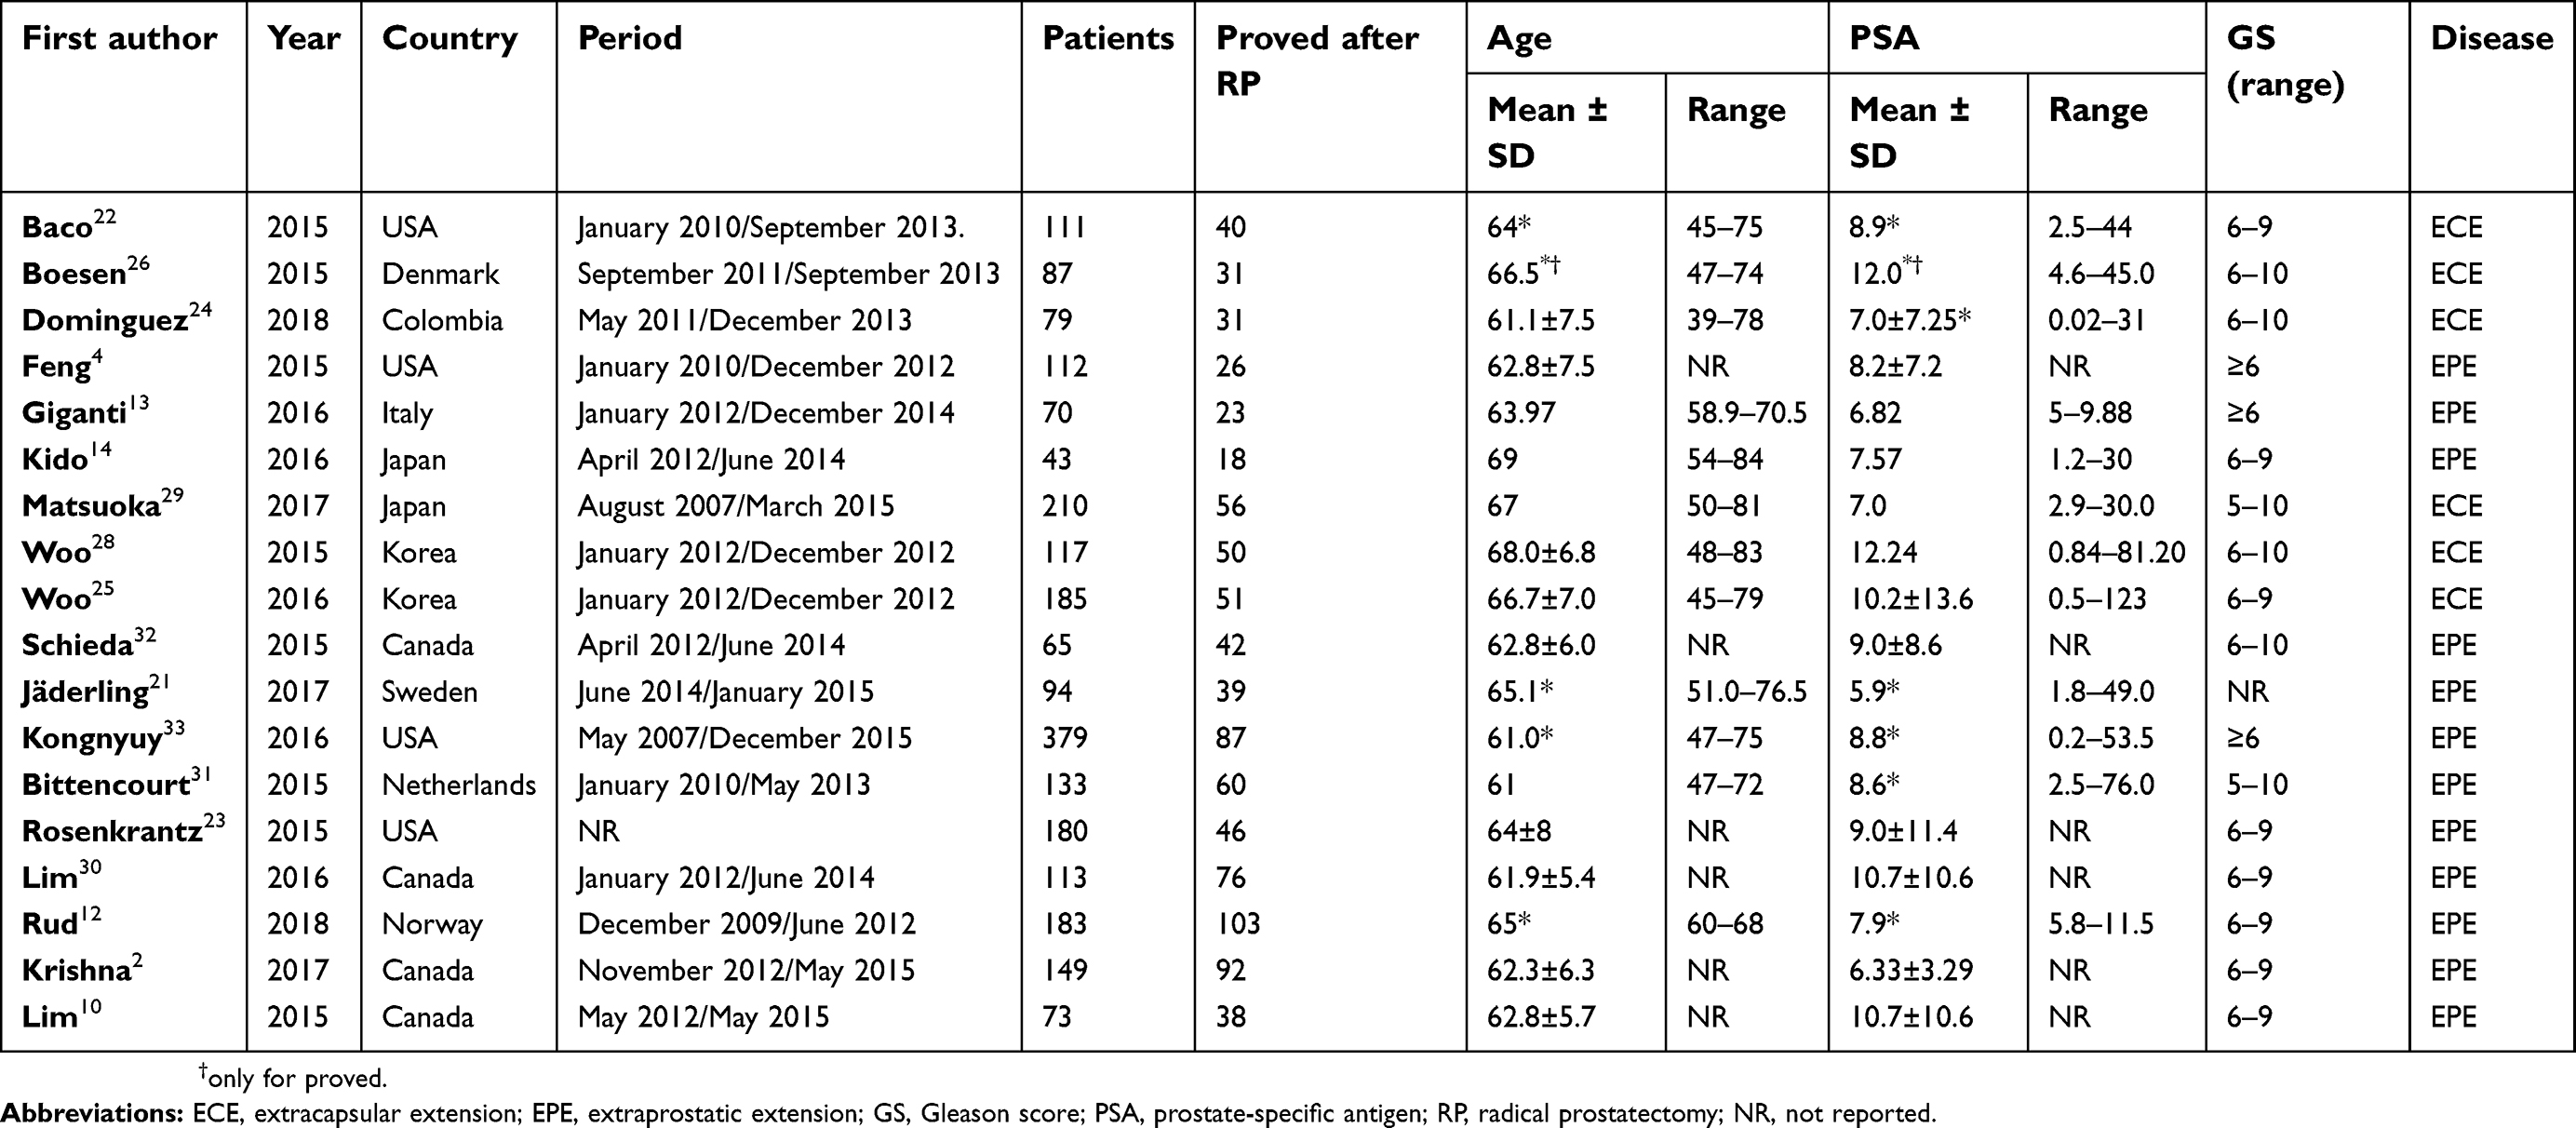 | Table 1 Demographic characteristics of included studies |
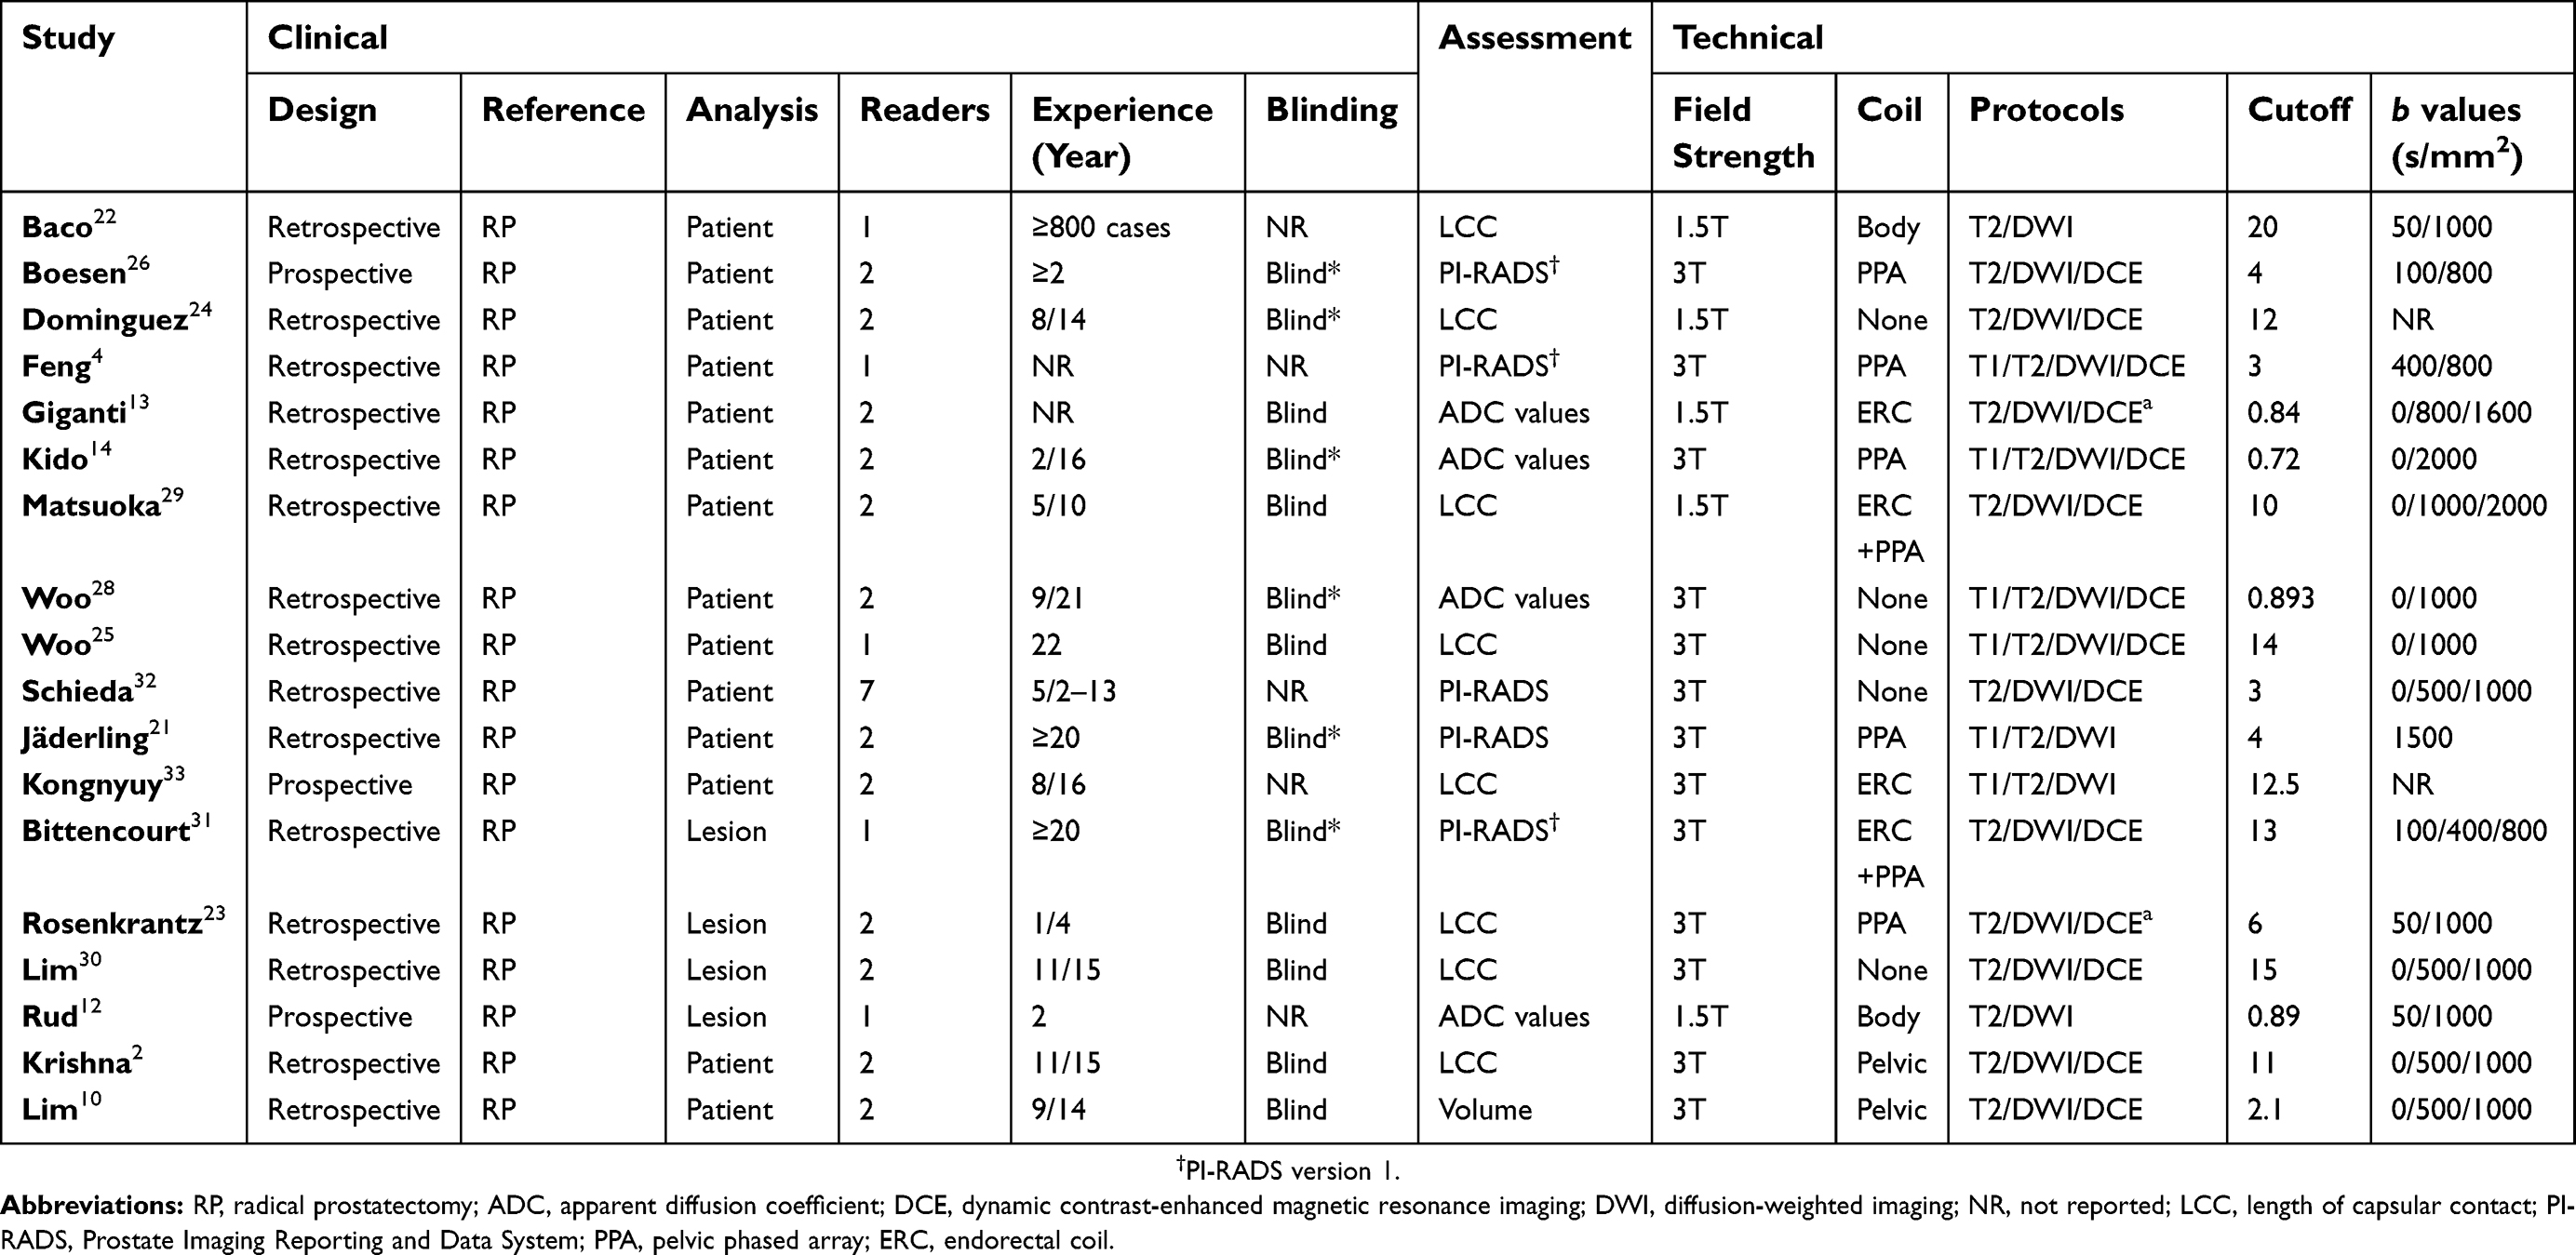 | Table 2 Clinical and technical characteristics of included studies |
Quality assessment
On the whole, evaluation for the 18 included studies was moderate (Figure 2). With regard to the patient selection domain, there was a high risk of bias, for almost all of the included studies were retrospective except 3 that were prospective in nature. Five studies were assigned high concern for applicability, for in these studies partly or even all patients had pathological diagnosis of PCa prior to MRI. There was a high risk of bias in 9 studies regarding index test domain. Five of 9 studies did not report whether the readers were blinded to the reference test results.4,17,21,31,32 Regarding the other 4 studies, readers were aware of the PSA level or/and GS of patients, though they were blinded to the histopathological findings.20,23,25,30 As for reference domain, there were no concerns because all studies used the RP specimens as the reference standard. Regarding the flow and timing domain, it was considered as low risk of bias for all of the included studies.
 | Figure 2 Risk of bias and applicability concerns: review of author judgments about each domain presented as percentages for the studies included using QUADAS-2. |
Synthesis of included studies
Sensitivity for individual studies ranged from 60% to 92%, with pooled estimates of 80.5% (95% CI 76.5–83.9%), and Higgins I2 statistics demonstrated moderate heterogeneity (I2=56%). As for specificity, it ranged from 46% to 96%, with pooled estimates of 69.1% (95% CI 62.3–75.2%), and I2=83% suggested the heterogeneity was more substantial compared to sensitivity. Coupled forest plots of the detailed sensitivity and specificity are presented in Figure 3, and HSROC curve plot with summary point along with 95% CI area is presented in Figure 4.
 | Figure 3 Coupled forest plots of pooled sensitivity and specificity. Numbers are pooled estimates with 95% CI in parentheses. Corresponding heterogeneity statistics are provided at bottom right corners. Horizontal lines indicate 95% CIs. |
 | Figure 4 Hierarchic summary ROC plots with summary point and 95% CI areas for the overall stage of T3 detection. Abbreviation: ROC, receiver operating characteristic. |
Subgroup analysis
As there were several different techniques or methods that were exploited throughout included studies, we performed multiple subgroup analyses to evaluate various clinical settings. Regarding 8 studies that used LCC alone as objective criteria,2,21,22,24–26,28,29 pooled sensitivity for them was 81.1% (95% CI 76.0–85.3%), with specificity of 66.6% (95% CI 57.6–74.5%). For another quantitative assessment of ADC value,17–19,27 pooled sensitivity was 85% (95% CI 77–90%) with specificity of 72% (95% CI 50–87%), higher than LCC both for sensitivity and for specificity. Summary estimates of sensitivity and specificity for ECE were 83.3% (95% CI 77.0–88.2%) and 70.6% (95% CI 60.2–79.2%), respectively. 1.5T scanners were used in 5 studies, and pooled sensitivity for them was 82.6% (95% CI 76.2–87.6%), with specificity of 68.0% (95% CI 56.4–77.8%). It is interesting that the 3.0T scanners performed slightly inferior to 1.5T scanners for sensitivity (79.8%, 95% CI 74.8–84.0%), but as for specificity, these two magnetic field strength performed comparable (69.6%, 95% CI 61.1–77.0%). Five studies did not use any coil, with the pooled sensitivity of 77.0% (95% CI 64.6–86.0%), and the corresponding specificity was 63.9% (95% CI 53.7–72.9%).23,24,27,29,31 While for studies that used at least one type of coil (endorectal, PPA or body), the diagnostic accuracy was higher, with 81.8% (95% CI 78.4–84.8%) for sensitivity and 71.2% (95% CI 62.6–78.5%) for specificity. Meta-regression manifested that there was no substantially significant difference regarding coil types, magnet field strength, and analysis method (Table S1). Deeks’ funnel plot with the P-value of 0.37 for the slope coefficient suggested that the likelihood of publication bias was low (Figure 5).
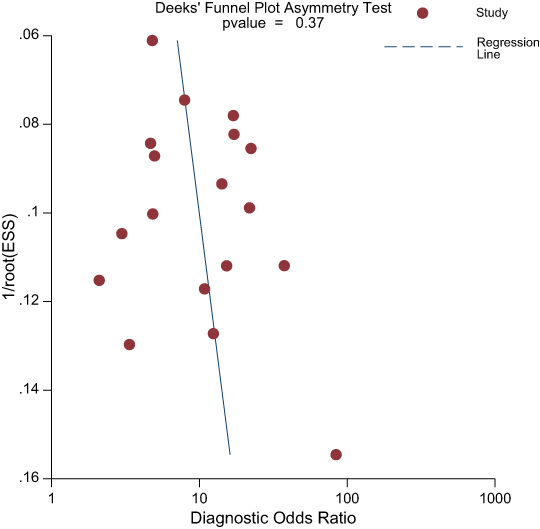 | Figure 5 Deeks’ funnel plot, a P-value of 0.37 suggests that the likelihood of publication bias is low. |
Discussion
In this meta-analysis, we evaluated the diagnostic performance of mpMRI for local PCa staging as introduced ADC. Compared to an earlier meta-analysis for local staging PCa, results from our showed higher sensitivity but lower specificity.11 One possible explanation was that in the current meta-analysis, all of the data extracted from included studies were quantitative assessments, and it has established the fact that compared to subjective analysis, objective assessment was prone to acquire higher sensitivity but at the cost of decreased specificity.2,22 At present, the diagnosis of EPE primarily depended on the experience and expertise of radiologists, and several studies have demonstrated that more experienced readers would obtain more accurate results. The PI-RADS scoring systems5,6 are still considered as limited and have not been widely validated in clinical application for diagnosis of local advanced PCa.33 In overall accuracy, it seemed that there was no difference between subjective analyses and quantitative assessment by introducing ADC. However, considering that quantitative evaluation is not depend on readers' expertise and experience, then lead to better reproducibility and inter-reader agreement, it therefore could be regarded as a promising approach for diagnosis of PCa.
The most used additional functional protocol in this meta-analysis was DWI; in fact, it was performed by all of the included studies, and the second most used protocol of DCE-MRI was reported by 12 studies. By comparison, in an earlier meta-analysis performed by de Rooij et al, only less than half of total included studies used additional functional protocols.11 Specifically, there were 21 studies that used DCE-MRI and 16 studies that used DWI (some used both of them). In the PI-RADSv2 release in 2015, DCE-MRI was regarded as secondary to DWI for the peripheral zone and T2WI for transition zone. Although there still exists controversy over the role of DCE-MRI in PCa, it seems that DCE-MRI is not as important as before. It is considered that compared to 1.5T, 3.0T MRI scanners could obtain higher sensitivity. However, findings from our studies suggested a different situation, that studies performed on 1.5T scanners had higher sensitivity. Partly because 4 in 5 studies with 1.5T MRI used at least one type of coil, and according to reports, it is suggested that 1.5T MRI with ERC has comparable performance to 3.0T.11 However, higher field strength using ERC will decrease the diagnostic accuracy, and our findings are in line with the earlier reports. It should be noted that some studies reported that endorectal coil likely outperforms pelvic phased array coil in detection of ECE, moreover, endorectal coil was considered significantly superior to body coil.21 As the evidence increasing that ADC may play an important role in improving the sensitivity for detection of local PCa, more and more studies regarded it as routine. It is considered that tumor ADC value is considered to correlate inversely with GS and could combine with other nomograms to predict EPE; moreover, ADC was proven to be an effective independent predictor of ECE, and have equivalent capacity compared to T2WI. For 4 studies that adopted ADC value as independent predictor, summary estimates showed that the diagnostic accuracy (85% for sensitivity and 72% for specificity) was higher than average level.17-19,27 One study that was not included in this meta-analysis (for language problem) obtained a sensitivity of 83% with specificity of 61%, at the cutoff value of 0.87×10⁻³ mm2/s.34 Different cutoff values were obtained probably on account of MRI manufacture, model, and selection of b-values, and for included studies, the b-values ranged from 0 to 2,000 s/mm2, but the values are discrete, and the most used were 0, 50, 100, 400, 500, 800, and 1,000 s/mm2. There were 2 studies that used high b-value up to 2,000 s/mm2; however, it seemed that the accuracy was not substantially superior to others.19,28 Besides the ADC value, Giganti et al looked into the ADC ratio (was obtained by dividing pathological ADC by that of a symmetrical normal area in the same prostate zone), and then obtained a sensitivity of 83%, with a specificity of 72%, slightly better than ADC value (79% and 70%, respectively).18
For another most used quantitative assessment of LCC, it showed a promising prospect of sensitivity as well. Originated from ultrasound, LCC is defined as “the maximum length of the index lesion contact with the prostatic capsule among all axial section”, and most studies used T2WI sequence to measure this parameter, because of better spatial resolution.24 For 8 studies that adopted LCC as the criteria for PCa, pooled sensitivity appeared inferior to ADC values. However, either Baco et al or Kongnyuy et al reported that with respect to microscopic (focal) ECE, LCC behaved better than subjective analysis and Partin tables, which is an improvement compared to de Rooij et al.11,21,26 In spite of PI-RADSv2 suggesting that tumor contact length >10 mm is a significant independent predictor of EPE, studies reported that the the optimal threshold varied widely, ranging from 6 to 20 mm, with potential factors including magnet field strength, methodology of the studies regarding measurement of LCC (straight line versus curvilinear length), and separate analysis for focal and non-focal EPE. As there was only one study that regarded a <10 mm value (6 mm) as the best threshold, the other 7 studies regarded a >10 mm value as the best threshold. At present, lacking an appropriate cutoff value for determining EPE is the main obstacle for the wide application of LCC in clinical practice. For two studies investigated use the tumor volume as a predictor of EPE, Lim et al obtained the favorable result with sensitivity of 78.4% and specificity of 73.5% at the cutoff value of 2.1 mm3, by contrast, Rud et al gained the sensitivity of 81% in PZ and 86% in TZ when tumor volume at 0.9 mm3, corresponding specificity were 60% and 50%, respectively.10,17
Excepting PI-RADS, there were several other nomograms or scoring systems that were developed to improve accuracy in detection of local advanced PCa. One of them is the Partin tables, which based on the combination of PSA level, biopsy GS, and clinical stage to diagnosis of PCa. By comparison another prostate cancer nomogram, the Memorial Sloan-Kettering (MSK) includes additional informations from the result of prostate biopsy. However, both of Partin table and MSK nomogram are under debate in clinical practice,35 and several studies proved that mpMRI performed better than Partin tables.4,36,37 Our analyses showed that for 5 studies using the PI-RADS guidelines to diagnosis of PCa, the diagnostic accuracy was lower than quantitative assessment. Moreover, sensitivity and specificity varied widely as whether PI-RADS score 3 lesions were regarded as positive or not, and many studies demonstrated that counted score 3 lesions as positive would result in higher sensitivity but lower specificity, and vice versa.2,25,38 Another widely used scoring system was Likert scale, and a study conducted by Costa et al showed that it perhaps outperforms PI-RADS but the difference was not substantial; moreover, the absence of objective criteria raises the concerns about the reproducibility of it, and then a strategy to standardize the Likert scoring system would be desirable.33 In our meta-analysis, per-lesion analysis and per-patient interpretation had comparable sensitivity; however, per-patient interpretation showed higher specificity. In view of this, there were only 4 per-lesion analysis studies included, which is not enough to draw a conclusion that which interpretation is superior.
There have been 3 meta-analyses published concerning MRI for local staging of PCa. Engelbrecht et al39 included the studies up to 2,000 and Silva et al40 restricted to 1.5T scanners. As for de Rooij et al,11 the current meta-analysis has several aspects different from them. First, all studies included in this meta-analysis were mpMRI, whereas it accounted for less than half in their study. Second, almost all studies in the present meta-analysis used quantitative assessment, which obtained a high sensitivity and moderate specificity. This was opposite to the study of de Rooij et al,11 because they acquired moderate sensitivity and high specificity. One possible explanation was that the main analytical approaches in their study were subjective, while all studies including ours adopted quantitative evaluation. Findings from this study revealed that as an independent predictor, ADC and LCC showed a favorable sensitivity even though accompanied with decreased specificity. At present, mpMRI is considered as the best means available for local staging PCa, and is significantly superior to PSA, DRE, and TRUS, or a combination of them. In addition, it has comparable overall accuracy with Likert scale, Partin tables, and MSK nomogram or even better.
Limitations
There were several limitations in our meta-analysis. First, most of the included studies were retrospective regarding study design, leading to a high risk of bias for patient selection, then possible inflation of the diagnostic sensitivity. Second, several studies did not report the details of blinding to clinical information or were not aware of the PSA levels and GS, which decreased the strength of evidence. Third, our study did not perform the analysis of SVI (T3b), due in part to insufficient data or because the sample size was. Finally, we did not make a comparison between PI-RADSv1 and PI-RADSv2 on diagnostic performance, and studies suggested that there was no substantial difference between them.
Conclusion
Compared to subjective analysis, quantitative assessment could obtain higher sensitivity, but at the cost of decreased specificity. Therefore, on the whole, accuracy was comparable to subjective analysis. However, ADC and LCC still should be viewed as promising prediction tools for PCa, especially considering that quantitative assessments have better reproducibility and inter-reader agreement, and they do not depend on radiologists’ experience and expertise.
Disclosure
The authors report no conflicts of interest in this work.
References
1. Smith RA, Andrews KS, Brooks D, et al. Cancer screening in the United States, 2018: a review of current American Cancer Society guidelines and current issues in cancer screening. CA Cancer J Clin. 2018;68(4):297–316. doi:10.3322/caac.21446
2. Krishna S, Lim CS, Mcinnes MDF, et al. Evaluation of MRI for diagnosis of extraprostatic extension in prostate cancer. J Magn Reson Imaging Jmri. 2017;47(1). Available from:
3. Partin AW, Mangold LA, Lamm DM, Walsh PC, Epstein JI, Pearson JD. Contemporary update of prostate cancer staging nomograms (Partin Tables) for the new millennium. Urology. 2001;58(6):843–848.
4. Feng TS, Sharif-Afshar AR, Wu J, et al. Multiparametric MRI improves accuracy of clinical nomograms for predicting extracapsular extension of prostate cancer. Urology. 2015;86(2):332–337. doi:10.1016/j.urology.2015.06.003
5. Barentsz JO, Richenberg J, Clements R, et al. ESUR prostate MR guidelines 2012. Eur Radiol. 2012;22(4):746–757. doi:10.1007/s00330-011-2377-y
6. Weinreb JC, Barentsz JO, Choyke PL, et al. PI-RADS prostate imaging – reporting and data system: 2015, version 2. Eur Urol. 2016;69(1):16–40. doi:10.1016/j.eururo.2015.08.052
7. Woo S, Suh CH, Kim SY, Cho JY, Kim SH. Diagnostic performance of prostate imaging reporting and data system version 2 for detection of prostate cancer: a systematic review and diagnostic meta-analysis. Eur Urol. 2017;72(2):177–188. doi:10.1016/j.eururo.2017.01.042
8. Hamoen EHJ, de Rooij M, Witjes JA, Barentsz JO, Rovers MM. Use of the Prostate Imaging Reporting and Data System (PI-RADS) for prostate cancer detection with multiparametric magnetic resonance imaging: a diagnostic meta-analysis. Eur Urol. 2015;67(6):1112–1121. doi:10.1016/j.eururo.2014.10.033
9. Godoy G, Tareen BU, Lepor H. Site of positive surgical margins influences biochemical recurrence after radical prostatectomy. BJU Int. 2009;104(11):1610–1614. doi:10.1111/j.1464-410X.2009.08688.x
10. Lim C, Flood TA, Hakim SW, et al. Evaluation of apparent diffusion coefficient and MR volumetry as independent associative factors for extra-prostatic extension (EPE) in prostatic carcinoma. J Magn Reson Imaging. 2016;43(3):726–736. doi:10.1002/jmri.25033
11. de Rooij M, Hamoen EHJ, Witjes JA, Barentsz JO, Rovers MM. Accuracy of magnetic resonance imaging for local staging of prostate cancer: a diagnostic meta-analysis. Eur Urol. 2016;70(2):233–245. doi:10.1016/j.eururo.2015.07.029
12. Liberati A, Altman DG, Tetzlaff J, et al. The PRISMA statement for reporting systematic reviews and meta-analyses of studies that evaluate healthcare interventions: explanation and elaboration. Epidemiol Biostat Public Health. 2009;6(4):e1–e34.
13. Whiting PF. QUADAS-2: a revised tool for the quality assessment of diagnostic accuracy studies. Ann Intern Med. 2011;155(8):529. doi:10.7326/0003-4819-155-8-201110180-00009
14. Reitsma JB, Glas AS, Rutjes AWS, Scholten RJPM, Bossuyt PM, Zwinderman AH. Bivariate analysis of sensitivity and specificity produces informative summary measures in diagnostic reviews. J Clin Epidemiol. 2005;58(10):982–990. doi:10.1016/j.jclinepi.2005.02.022
15. Rutter CM, Gatsonis CA. A hierarchical regression approach to meta-analysis of diagnostic test accuracy evaluations. Stat Med. 2001;20(19):2865–2884.
16. Deeks JJ, Macaskill P, Irwig L. The performance of tests of publication bias and other sample size effects in systematic reviews of diagnostic test accuracy was assessed. J Clin Epidemiol. 2005;58(9):882–893. doi:10.1016/j.jclinepi.2005.01.016
17. Rud E, Diep L, Baco E. A prospective study evaluating indirect MRI-signs for the prediction of extraprostatic disease in patients with prostate cancer: tumor volume, tumor contact length and tumor apparent diffusion coefficient. World J Urol. 2018;36(4):629–637. doi:10.1007/s00345-018-2171-4
18. Giganti F, Coppola A, Ambrosi A, et al. Apparent diffusion coefficient in the evaluation of side-specific extracapsular extension in prostate cancer: development and external validation of a nomogram of clinical use. Urol Oncol. 2016;34(7):e9–291.e17. doi:10.1016/j.urolonc.2016.02.015
19. Kido A, Tamada T, Sone T, et al. Incremental value of high b value diffusion-weighted magnetic resonance imaging at 3-T for prediction of extracapsular extension in patients with prostate cancer: preliminary experience. Radiol Med (Torino). 2017;122(3):228–238. doi:10.1007/s11547-016-0712-8
20. Jäderling F, Nyberg T, Öberg M, Carlsson S, Skorpil M, Blomqvist L. Accuracy in local staging of prostate cancer by adding a three-dimensional T2-weighted sequence with radial reconstructions in magnetic resonance imaging. Acta Radiol Open. 2018;7(2):2058460118754607. doi:10.1177/2058460118754607
21. Baco E, Rud E, Vlatkovic L, et al. Predictive value of magnetic resonance imaging determined tumor contact length for extracapsular extension of prostate cancer. J Urol. 2015;193(2):466–472. doi:10.1016/j.juro.2014.08.084
22. Rosenkrantz AB, Shanbhogue AK, Wang A, Kong MX, Babb JS, Taneja SS. Length of capsular contact for diagnosing extraprostatic extension on prostate MRI: assessment at an optimal threshold. J Magn Reson Imaging. 2016;43(4):990–997. doi:10.1002/jmri.25040
23. Dominguez C, Plata M, Cataño J, et al. Diagnostic accuracy of multiparametric magnetic resonance imaging in detecting extracapsular extension in intermediate and high - risk prostate cancer. Int Braz J Urol Off J Braz Soc Urol. 2018;44. doi:10.1590/S1677-5538.IBJU.2016.0485
24. Woo S, Kim SY, Cho JY, Kim SH. Length of capsular contact on prostate MRI as a predictor of extracapsular extension: which is the most optimal sequence? Acta Radiol. 2017;58(4):489–497. doi:10.1177/0284185116658684
25. Boesen L, Chabanova E, Løgager V, Balslev I, Mikines K, Thomsen HS. Prostate cancer staging with extracapsular extension risk scoring using multiparametric MRI: a correlation with histopathology. Eur Radiol. 2015;25(6):1776–1785. doi:10.1007/s00330-014-3543-9
26. Kongnyuy M, Sidana A, George AK, et al. Tumor contact with prostate capsule on magnetic resonance imaging: a potential biomarker for staging and prognosis. Urol Oncol Semin Orig Invest. 2016;35(1). doi:10.1016/j.urolonc.2016.07.013
27. Woo S, Cho JY, Kim SY, Kim SH. Extracapsular extension in prostate cancer: added value of diffusion-weighted MRI in patients with equivocal findings on T2-weighted imaging. AJR Am J Roentgenol. 2015;204(2):W168–175. doi:10.2214/AJR.14.12939
28. Matsuoka Y, Ishioka J, Tanaka H, et al. Impact of the prostate imaging reporting and data system, version 2, on MRI diagnosis for extracapsular extension of prostate cancer. Am J Roentgenol. 2017;209(2):W76–W84. doi:10.2214/AJR.16.17163
29. Lim CS, McInnes MDF, Lim RS, et al. Prognostic value of Prostate Imaging and Data Reporting System (PI-RADS) v. 2 assessment categories 4 and 5 compared to histopathological outcomes after radical prostatectomy. J Magn Reson Imaging. 2016;46(1):257–266. doi:10.1002/jmri.25539
30. Kayat Bittencourt L, Litjens G, Hulsbergen-van de Kaa CA, Turkbey B, Gasparetto EL, Barentsz JO. Prostate cancer: the european society of urogenital radiology prostate imaging reporting and data system criteria for predicting extraprostatic extension by using 3-T multiparametric MR imaging. Radiology. 2015;276(2):479–489. doi:10.1148/radiol.15141412
31. Schieda N, Quon JS, Lim C, et al. Evaluation of the European Society of Urogenital Radiology (ESUR) PI-RADS scoring system for assessment of extra-prostatic extension in prostatic carcinoma. Eur J Radiol. 2015;84(10):1843–1848. doi:10.1016/j.ejrad.2015.06.016
32. Kongnyuy M, Halpern DM, Liu CC, et al. 3-T multiparametric MRI characteristics of prostate cancer patients suspicious for biochemical recurrence after primary focal cryosurgery (hemiablation). Int Urol Nephrol. 2017;49(11):1947–1954. doi:10.1007/s11255-017-1670-3
33. Costa DN, Passoni NM, Leyendecker JR, et al. Diagnostic utility of a likert scale versus qualitative descriptors and length of capsular contact for determining extraprostatic tumor extension at multiparametric prostate MRI. Am J Roentgenol. 2018;210(5):1066–1072. doi:10.2214/AJR.17.18849
34. Granja MF, Pedraza CM, Flórez DC, Romero JA, Palau MA, Aguirre DA. Predicting extracapsular involvement in prostate cancer through the tumor contact length and the apparent diffusion coefficient. Radiologia. 2017;59(4):313–320. doi:10.1016/j.rx.2017.03.003
35. Eifler JB, Feng Z, Lin BM, et al. An updated prostate cancer staging nomogram (Partin tables) based on cases from 2006 to 2011. BJU Int. 2013;111(1):22–29. doi:10.1111/j.1464-410X.2012.11324.x
36. Augustin H, Fritz GA, Ehammer T, Auprich M, Pummer K. Accuracy of 3-Tesla magnetic resonance imaging for the staging of prostate cancer in comparison to the partin tables. Acta Radiol. 2009;50(5):562–569. doi:10.1080/02841850902889846
37. Gupta RT, Faridi KF, Singh AA, et al. Comparing 3-T multiparametric MRI and the Partin tables to predict organ-confined prostate cancer after radical prostatectomy. Urol Oncol Semin Orig Invest. 2014;32(8):1292–1299. doi:10.1016/j.urolonc.2014.04.017
38. Radtke JP, Hadaschik BA, Wolf MB, et al. The impact of magnetic resonance imaging on prediction of extraprostatic extension and prostatectomy outcome in patients with low-, intermediate- and high-risk prostate cancer: try to find a standard. J Endourol. 2015;29(12):1396–1405. doi:10.1089/end.2015.0358
39. Engelbrecht MR, Jager GJ, Laheij RJ, Verbeek AL, van Lier H, Barentsz JO. Local staging of prostate cancer using magnetic resonance imaging: a meta-analysis. Eur Radiol. 2002;12(9):2294–2302. doi:10.1007/s00330-002-1389-z
40. Da Silva RC, Sasse AD, Matheus WE, et al. Magnetic Resonance Image in the diagnosis and evaluation of extra-prostatic extension and involvement of seminal vesicles of prostate cancer: a systematic review of literature and meta-analysis. Int Braz J Urol. 2013;39(2):155–166. doi:10.1590/S1677-5538.IBJU.2013.02.02
Supplementary material
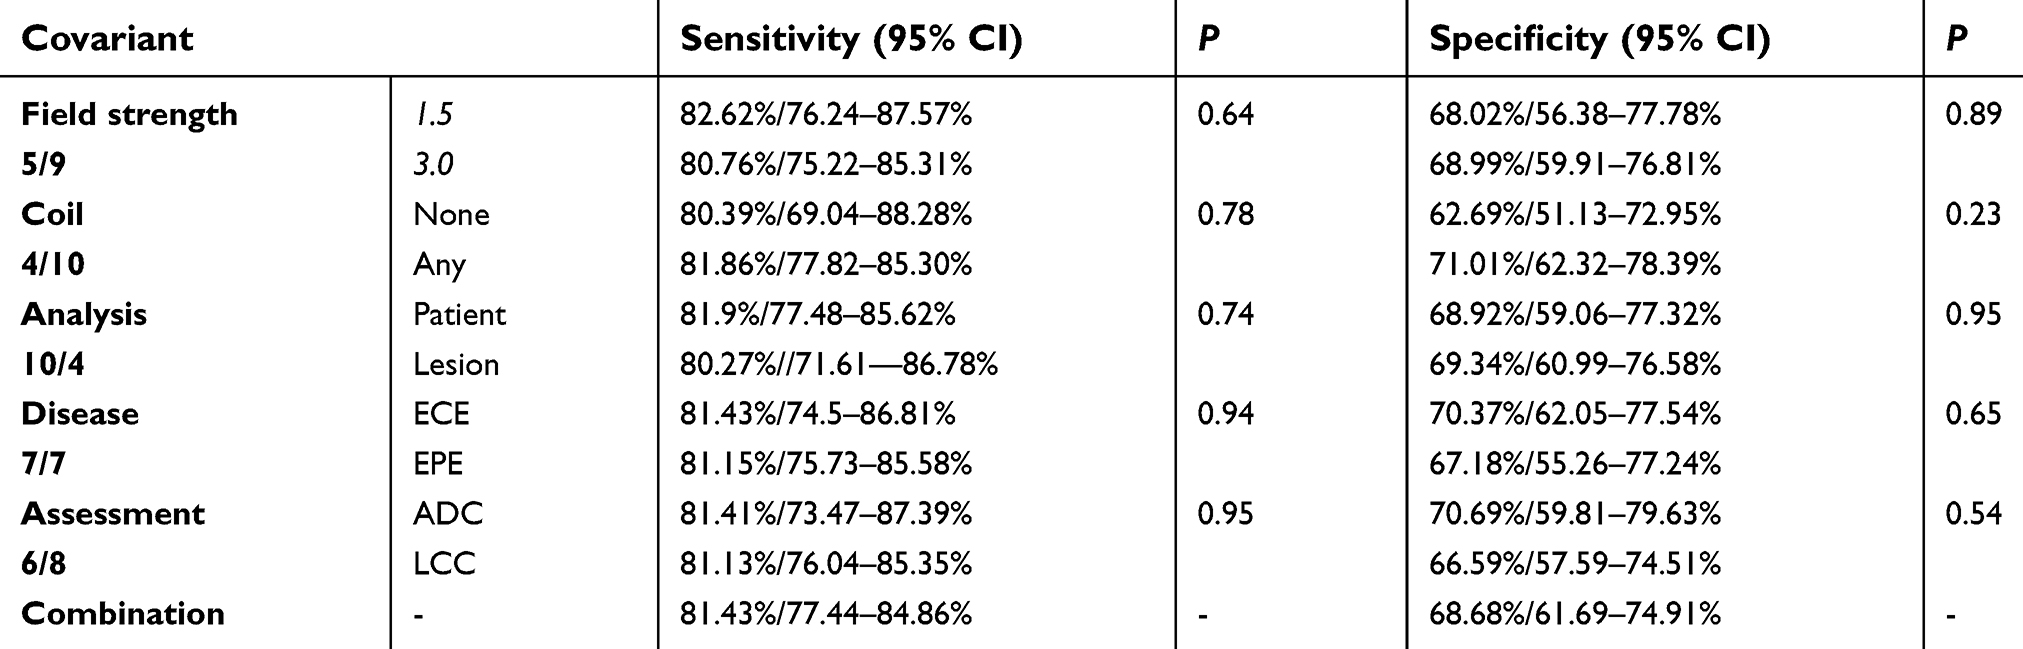 | Table S1 Subgroup analysis and meta-regression |
 © 2019 The Author(s). This work is published and licensed by Dove Medical Press Limited. The
full terms of this license are available at https://www.dovepress.com/terms
and incorporate the Creative Commons Attribution
- Non Commercial (unported, 3.0) License.
By accessing the work you hereby accept the Terms. Non-commercial uses of the work are permitted
without any further permission from Dove Medical Press Limited, provided the work is properly
attributed. For permission for commercial use of this work, please see paragraphs 4.2 and 5 of our Terms.
© 2019 The Author(s). This work is published and licensed by Dove Medical Press Limited. The
full terms of this license are available at https://www.dovepress.com/terms
and incorporate the Creative Commons Attribution
- Non Commercial (unported, 3.0) License.
By accessing the work you hereby accept the Terms. Non-commercial uses of the work are permitted
without any further permission from Dove Medical Press Limited, provided the work is properly
attributed. For permission for commercial use of this work, please see paragraphs 4.2 and 5 of our Terms.