Back to Journals » Risk Management and Healthcare Policy » Volume 15
Antimicrobial Resistance Profile of Enterobacteriaceae and Drinking Water Quality Among Households in Bule Hora Town, South Ethiopia
Authors Dhengesu D ![]() , Lemma H
, Lemma H ![]() , Asefa L
, Asefa L ![]() , Tilahun D
, Tilahun D ![]()
Received 10 April 2022
Accepted for publication 15 August 2022
Published 25 August 2022 Volume 2022:15 Pages 1569—1580
DOI https://doi.org/10.2147/RMHP.S370149
Checked for plagiarism Yes
Review by Single anonymous peer review
Peer reviewer comments 2
Editor who approved publication: Professor Mecit Can Emre Simsekler
Video abstract presented by Degefa Dhengesu.
Views: 259
Degefa Dhengesu,1 Hailu Lemma,1 Lechisa Asefa,1 Dagnamyelew Tilahun2
1Department of Environmental Health, Institute of Health, Bule Hora University, Bule Hora Town, Oromia, Ethiopia; 2Department of Medical Laboratory, Institute of Health, Bule Hora University, Bule Hora Town, Oromia, Ethiopia
Correspondence: Degefa Dhengesu, Department of Environmental Health, Institute of Health, Bule Hora University, P.O. Box 144, Bule Hora Town, Oromia, Ethiopia, Tel +251-912-090-879, Email [email protected]
Background: Antimicrobial resistance bacteria and unsafe water are contributing to the growing burden of diseases. Hence, isolation and antimicrobial susceptibility tests for drinking water samples are currently becoming vital to address the human health risks from drinking unsafe water.
Objective: This study aimed to assess the antimicrobial resistance profile of Enterobacteriaceae and quality of drinking water among households in Bule Hora Town, South Ethiopia.
Methods and Materials: A community-based cross-sectional study was used from June to August 2021. A total of 75 water samples were collected and analyzed at the Microbiological Laboratory of Bule Hora University within 6 hours. A membrane filtration method and biochemical tests were used for the isolation and identification of bacteria. An antimicrobial susceptibility test was performed using Kirby–Bauer disc-diffusion method on Mueller–Hinton Agar. Systematic and simple random probability sampling techniques were used to draw representative samples. The data were entered into Epi Data 3.1 and then exported to SPSS version 25 where univariate and bivariate analyses of the data were conducted.
Results: This study indicated that 59 (78.6%), 30 (40%), and 20 (26.6%) of water samples from the storage of households were contaminated with total coliforms, thermo-tolerant coliforms, and Escherichia coli, respectively. Similarly, Salmonella accounted for 18 (24%), Shigella 12 (16%), and other members of the Enterobacteriaceae such as Proteus, Citrobacter, Klebsiella, Escherichia coli, and Enterobacter species were also isolated. All isolates of Enterobacteriaceae showed resistance to amoxicillin plus clavulanic acid and ampicillin. Besides, Shigella showed 10 (83.3%), 2 (16.6%) and 10 (83.3%) and Salmonella showed 16 (88.9%), 5 (27.8%) and 15 (83.3%) resistant to cotrimoxazole, chloramphenicol and tetracycline, respectively. All the tested drinking water samples had no free chlorine at all at point of use.
Conclusion: There was contamination of drinking water with coliform and antibiotic-resistant Enterobacteriaceae in most surveyed households.
Keywords: antimicrobial agents, resistant bacteria, coliform, drinking water
Introduction
Water is considered safe for drinking if it is free of pathogens. The need for risk-informed planning to ensure the safety of drinking water is more essential than ever. Regular monitoring is recommended to ensure that drinking water is safe.1 Urban households rely on different sources of drinking water. In Ethiopia, the three most common sources of drinking water in urban households are water piped into the household’s dwelling yard plot (63%); water piped into a public tap (13%) and water piped to a neighbor (12%).2
It is not only water contaminated at sources that is an issue but water stored within the home which may also become contaminated. A literature review of 11 studies shows that, the mean coliform levels were considerably higher in household water containers than in the original source waters. Globally, 26% of the people drink water that is, at least occasionally, contaminated with fecal indicator bacteria and ranged from 14% in Europe to over 52% in Africa.1,3,4
In Ethiopia, microbial water quality that is used by people has been contaminated with fecal indicator bacteria. For instance, fecal indicator bacteria are detected in Nekemt, 100% total coliform and 37% fecal coliform of tap water,5 in Gondar, 27% household taps and 50% storage containers,3 and in Bahir Dar, 17.1% total coliform and 14.3% faecal coliform of household tap.6
The coliform group has been selected as the primary indicator bacteria for the presence of disease causing organisms in drinking water. It is a primary indicator of the suitability of water for consumption. If large numbers of coliforms are found in water, there is a high probability that other pathogenic bacteria or organisms exist. The WHO and Ethiopian drinking water guidelines require the absence of E. coli, thermo-tolerant and total coliform in public drinking water supplies. Besides, chlorine residual, pH and turbidity are recommended in water quality investigation as they either directly influence the microbial quality of water.7
Currently, isolation and antimicrobial susceptibility tests for the positive fecal indicators of drinking water samples are becoming very important. Infection by opportunistic Escherichia coli species, Shigella species, Salmonella typhi and other Salmonella species are among the potential risks posed by antimicrobial-resistant organisms in drinking water. Unsafe water and antimicrobial resistance (AMR) are contributing to the growing burden of diseases. Globally, 40% of the deaths among children under 5 years of age were caused by diseases affected by AMR in 2016. The total number of under-5 deaths was 5.4 million in 2017 and half of those deaths occurred in sub-Saharan Africa, and another 30% in Southern Asia.8
Resistant bacteria can contaminate drinking water sources used by humans. Isolated Enterobacteriaceae from drinking water demonstrated 98–100% ampicillin resistance. Multiple antibiotic-resistant waterborne Escherichia coli (35%), Salmonella (22.7%), and Shigella (15%) were found in the drinking water.3 Any water that is intended for drinking purposes should meet the national water quality standards. There is a need for identification of the types of antimicrobial-resistant bacteria in the environment to address the human health risks from environmental exposures to antimicrobial-resistant bacteria, especially from water and human excreta–related environmental exposures.8
Therefore, the demand for risk assessment is not responded to and the status of drinking water safety concerning the antimicrobial resistance bacteria was limited to my knowledge. Hence, there is lack of updated information for decision-making and to plan for interventions as deemed necessary. For exposure assessment, there is a need for improved identification of the types of antimicrobial-resistant bacteria. Therefore, this study was intended to determine antimicrobial resistance patterns of drinking water from storage among households of Bule Hora Town, South Ethiopia.
Thus, this study would be important to identify the antimicrobial resistance patterns of bacteria in drinking water in the town. The study results would also provide important information for concerned bodies to make decisions, design and implement water projects and improve safe drinking water supply in the study area.
Methods and Materials
Study Area and Period
A study was conducted in Bule Hora Town, West Goji Zone, South Ethiopia, from June to August 2021. It is an administrative town of West Guji Zone and located on the main road of Addis Ababa to Moyale, about 470 km south of Addis Ababa. The town has a latitude and longitude of 5°35ʹN 38°15ʹE/5.583°N 38.250°E, with an elevation of 1716 meters above sea level. It has an average annual rainfall of 648 mm. According to the city population center, it has a total projected population of 27,820 in the year 2007. The town has 1 health center, 1 hospital, and 3 health posts which give service to the inhabitants of 3 kebeles (local administrative units) and the surrounding catchment area. The main water sources of the town include 8 Motorized Boreholes/deep wells with 30 public taps and 2924 yard taps. The data was collected from June to August 2021.
Study Design
A community-based cross-sectional study design was used to assess antimicrobial resistance patterns and quality of drinking water among households of Bule Hora Town, South Ethiopia.
Population
Source population
The source population was all households in Bule Hora Town from which the findings and conclusion were drawn.
Study Population
The study population was all selected households residing in Bule Hora Town.
Inclusion and Exclusion Criteria
Inclusion Criteria
Inclusion criteria for this study were water storage containers containing drinking water in households during data collection.
Exclusion Criteria
The exclusion criteria for this study were water storage containers that did not contain drinking water in the households during data collection. Institutional reservoirs were also excluded.
Sample Size Determination
Representative samples for the bacteriological drinking water quality tests were determined as follows: using confidence level 95%, margin of error or confidence limit 5%, population size 27,820 (5564 households), the prevalence of coliforms in drinking water in different areas,3,5,6,9,10 and Epi info 7 Statcal the sample size was determined to be 357 households. Adding a 5% of non-response rate, the total sample size was determined to be 375 samples of households.
Because laboratory-based fecal-related bacteriological analysis testing is more costly and time-consuming for households, a subset of households surveyed were tested to include approximately 20% of the drinking water samples.11 Thus, sample size for the bacteriological drinking water quality test from households = 375×0.2=75 drinking water samples. A total of 75 samples were collected and analyzed in triples.
Sampling Techniques and Procedures
Probability sampling techniques were used to take representative water samples from household water containers for the bacteriological quality parameters following WHO water sampling and analysis procedure.7 First, systematic random sampling was used to determine sampling fraction which was N/n =5564HH/375=15 for each kebele (the lowest local administration unit). But, due to the sampling fraction was being too large half of the fraction for every 7th HH was visited. The total sample size was proportionally allocated to the three kebeles of Bule Hora Town, namely 01 Kebele=146/2531HH, 02 Kebele=58/852HH and 03 Kebele=171/2181HH. The 20% of the respective storage drinking water samples from each kebele was also allocated to be 146×0.2=29, 58×0.2=12 and 171×0.2=34 samples for 01, 02 and 03 Kebele, respectively. Then, a lottery method of simple random sampling was used to determine the first observation of a water sample from household water container ranged from 1 to 7 sampling frame number.
Study Variables
The study variables for this study were
- Antimicrobial resistance profile of Enterobacteriaceae such as (Coliforms group, Salmonella species, Shigella species, Proteus species)
- Bacteriological quality of drinking water and
- Physico-chemical (temperature, power of hydrogen, residual free chlorine and turbidity of water)
Data Collection Procedure, and Field and Laboratory Analysis
For bacteriological analysis, a total of 75 water samples were collected from the storage of drinking water of households, according to WHO guidelines.7 A representative water sample was taken from a water household container (storage). Water samples were collected in 300-mL sterile plastic bottles that were fitted with screw caps, labeled and kept in a cold box before being transported to the laboratory for analysis. The samples were transported and arrived at the laboratory within 6 hours of collection. Water samples were collected between 8:30 and 10:30 am. Field and Laboratory analysis was done according to the WHO and ESA guidelines.7,12 Manufacturers’ instructions were also strictly followed.
Free Chlorine Residual
Onsite free chlorine residual was tested using DPD 1 and 3 tablets with the portable colorimeter K200-RC type. The colorimeter was calibrated with distilled water before measuring the residual free chlorine of the sampled water as recommended by the manual of the manufacturer. The absence of a pink colored appearance after tablets mixed with water samples and zero reading of the portable colorimeter were considered as undetectable free chlorine residues in the sampled water.
Temperature and pH
The temperature and pH of the drinking water samples were tested at the point of samples using the portable pH-meter (pH-013) type. The pH meter was calibrated with a buffer solution of 4.0, 7.0 and 10.0 before being used to measure the pH of water samples. The pH electrode probe was kept in 4.0 buffer solution as recommended by a manufacturer. The temperature probe was used to read the temperature of the sampled water, while the pH probe was used to measure the pH of the sampled water.
Turbidity
A digital turbidity meter was used to measure the turbidity of the sample of the drinking water at laboratory level. The turbidity meter was calibrated with distilled water for 0 NTU (nephlometric turbidity unit) reading and 200 NTU standard solution for 200 NTU reading before being used to measure the turbidity of the sampled water as a manufacturer instruction. Then, the reading of the turbidity meter was recorded.
Media Used for Bacterial Isolation and Identification
N,Ndiethyl-p-phenylenediamine, (DPD) 1 and 3, pH buffer solutions (4.0, 7.0, and 9.0), sodium thiosulfate, membrane lauryl sulfate, urea base with 40% solution, Simmon’s citrate agar, motility medium, triple sugar iron agar, Salmonella-Shigella agar, nutrient agar, xylose lysine deoxycholate (XLD), buffered peptone water, Selenite F broth, MacConkey agar, indole Kovac’s reagent, 3% H2O2, tryptone soya broth, mannitol salt agar and coagulase reagent were used.
Biochemical Tests
The indole production test was done by adding 5 drops of indole Kovac’s reagent to the 4mL tryptone soya broth cultures that had been incubated for 24 hours at 37°C. Further tryptone soya broth cultures inoculated to Simmon’s citrate, motility media, triple sugar iron agar, urea with 40% solution slants and mannitol salt agar plates incubated for 24 hours at 37°C for biochemical tests.
Membrane Filtration Methods
The membrane-filtration method was used to determine the bacteriological quality of the drinking water. One hundred milliliters of the samples were introduced aseptically into a sterile or properly disinfected filtration assembly containing a sterile membrane filter paper (nominal pore size of 0.45µm). The retained bacteria were placed on the 47mm pad soaked with membrane lauryl sulfate broth in glass Petridis of 47mm. Finally, the Petridis were rolled and kept in an incubator upside down at 37°C for total coliform, 44°C for thermo-tolerant coliform and 44.5°C for E. coli for 24 hours. After 24 hours, CFU/100mL was counted with the aid of the colony counter. Then, presumptive yellow colonies of coliforms grown were further inoculated into tryptone soya broth and incubated for 24 hours at 37°C for each plate. Then, biochemical tests were further performed to identify a genus of coliforms of gram-negative Enterobacteriaceae.
Results
Red to pink ring formation confirmed positive results for the indole production test. After overnight incubation, blue color formation for Simmon’s citrate carbon utilization test for positive, line and turbid growth for non-motile and motile test, lactose fermenters were confirmed with the formation of yellow slant and butt of triple sugar agar tests as a result of more acid productions lactose positive (A/A), gas production and absence of H2S production for TSI, yellow and pink color for MSA and urease as negative and positive results were recorded and used to identify the genus of the coliforms E. coli, Klebsiella, Citrobacter and Enterobacter species as shown in Table 1.
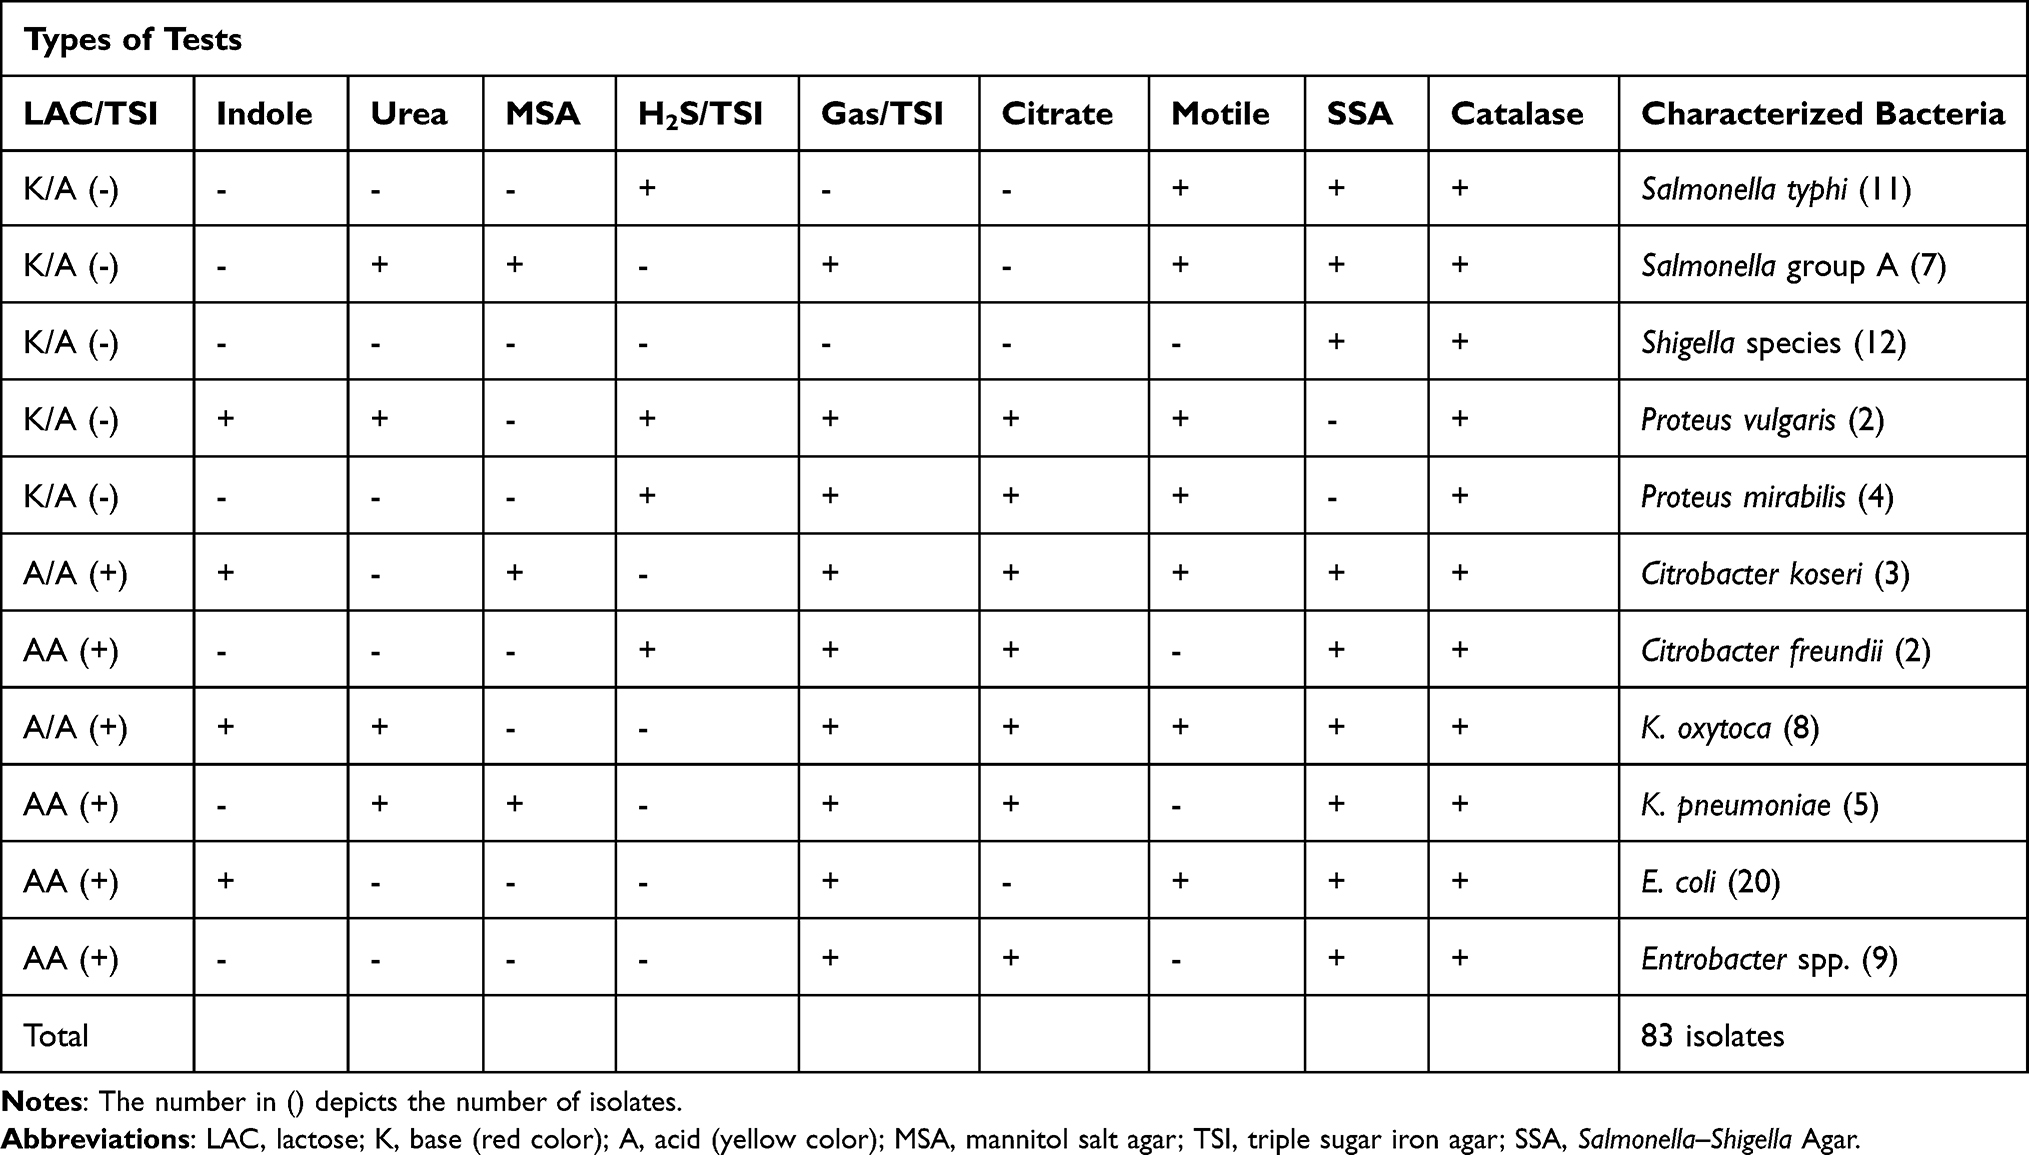 |
Table 1 Biochemical Test Results of Storage Drinking Water, Among Households of Bule Hora Town, South Ethiopia, 2021 |
Salmonella Isolation and Identification
One milliliter of water sample was mixed with 10mL of sterile buffered peptone water and incubated at 37°C for 24 hours to resuscitate them. After 24 hours of incubation, a loop full of the pre-enriched culture was inoculated into 5mL of selenite F broth and incubated at 37°C for 24 hours to enrich them. Further, the culture was inoculated into sterile Salmonella–Shigella agar plates aseptically with wire loop by parallel streaking and incubated at 37°C for 24 hours. Presumptive Salmonella species were colorless colonies with a black center and were further subcultured to tryptone soya broth at 37°C for 24 hours. Confirmed Salmonella species were obtained after the performance of the biochemical tests.
Results
Negative results were confirmed by the absence of red to pink ring formation for indole production tests. After overnight incubation, then original color for Simmon’s citrate carbon utilization test, turbid growth for the motility test, lactose non-fermenters were confirmed with red and yellow color formation of the slant and butt of triple sugar agar tests as a result of less acid production (glucose positive or lactose negative) or K/A, gas and H2S production and or absence of gas and H2S production for TSI, yellow and pink color for MSA and urease as negative and positive results were recorded and used to identify the genus of the Salmonella and Shigella as shown in Table 1.12–15
Shigella Isolation and Identification
One milliliter of water sample was mixed with 5mL of sterile selenite F broth, homogenized and incubated at 37°C for 24 hours. After 24 hours, incubation, each pre-enriched culture was inoculated into sterile MacConkey and xylose lysine deoxycholate (XLD) aseptically with wire loop by streaking and incubated at 37°C for 24 hours. Presumptive Shigella species were colorless and pink colonies and subcultured to nutrient agar and incubated at 37°C for 24 hours and further inoculated into tryptone soya broth and incubated at 37°C for 24 hours. Confirmed Salmonella species were obtained after the performance of the biochemical tests.
Results
A negative results confirmed by the absence of red to pink ring formation for indole production tests. After overnight incubation, the original color (green) for Simmon’s citrate carbon utilization test, line growth for the motility test, lactose non fermenters were confirmed with red and yellow color formation of the slant and butt of Triple sugar agar tests as a result of less acid production (glucose positive or lactose negative) or K/A, absence of gas and H2S production for TSI, yellow and pink color for MSA and Urease as negative and positive results were recorded and used to identify the genus of the Salmonella and Shigella as shown in Table 1.12,15,16
Proteus Isolation and Identification
One milliliter of water sample was mixed with 10mL of sterile-buffered peptone water and incubated at 37°C for 24 hours to resuscitate them. After 24 hours, incubation, 1mL of the pre-enriched cultures was inoculated onto MacConkey agar plates by pour method and incubated at 37°C for 24 hours. Large, circular and smooth colorless or yellow colonies of non-fermenter were presumptive for Proteus species were further subcultured to nutrient agar to purify them (colony isolation on agar obtained through increasing the agar concentration 20 g/liter and the addition of 5 mL glycerol per liter of medium to prevent swarming) and incubated at 37°C for 24 hours and then to tryptone soya broth and incubated at 37°C for 24 hours. Finally, biochemical tests were used to identify Proteus from other Enterobacteriaceae.
Results
A negative result was confirmed by the absence of red to pink ring formation within 1 to 2 minutes. After overnight incubation, blue color formation for Simmon’s citrate carbon utilization test, line and turbid growth for non-motile and motile test, red and yellow color of slant and butt (K/A), gas and H2S production or absence for TSI, pink or yellow color for MSA as negative and positive and yellow or pink color for Urease as negative and positive results were recorded and used to identify the genus of the Proteus species as shown in Table 1.12,14,15
Kirby–Bauer Disc-Diffusion Method
The antimicrobial susceptibility test was performed using the Kirby–Bauer disc-diffusion method on Mueller–Hinton agar. Resistance, dose-dependent susceptibility and susceptibility data were interpreted according to CLSI of 2019.17 Antimicrobial susceptibility testing was done using a modified Kirby–Bauer diffusion method for all the isolated genus and species of bacteria. The isolated bacteria cultures were sub-cultured and purified. The pure colonies were inoculated into Tryptone Soya Broth and incubated at 37°C for 24 hours. After overnight incubation, the turbidity of the culture was adjusted to 0.5 McFarland Standard to bring the cell density to approximately 108 CFU/mL. The 0.5 McFarland turbidity standard was prepared by mixing 0.5 mL barium chloride dehydrate (1.175%) with 99.5mL sulfuric acid (1%). Muller–Hinton Agar (BIOMARK) plates were prepared following manufacturer’s instructions. A sterile cotton swab was dipped into the standardized suspension and the culture was spread evenly over the entire surface of the Muller–Hinton Agar plates by swabbing in three directions at 60° of each spreading. The plates were incubated for 18 hours at 37°C after applying antimicrobial discs.
The following recommended available seven classes of seven antimicrobial agents were used, and they were penicillin: ampicillin of 25 µg, aminoglycoside: gentamicin of 10 µg, beta-lactam combination: amoxicillin plus clavulanic acid of 30 µg, folate pathway antagonists: trimethoprim–sulfamethoxazole of 23.75+1.25 µg, phenicols: chloramphenicol of 30 µg, quinolone: ciprofloxacin of 5 µg, and tetracycline: tetracycline of 30 µg. Interpretation of inhibition zones was performed according to the Clinical and Laboratory Standard Institute (CLSI) criteria of 2019.
Data Quality Assurances
The WHO and Ethiopia drinking water quality guidelines and standard procedure operations were strictly followed during the course of sample collection, transportation, storage, reagent and culture media preparation, incubation, during colony examination and interpretation. Manufacturer’s instructions were strictly followed to prepare all media and quality control for their proper work before being used for tests. Reference strains of E. coli, Salmonella enteritidis, Shigella flexneri, and Proteus mirabilis American Type Culture Collection (ATCC) 25922, ATCC 13076, ATCC 12022, ATCC 12453 and (ATCC) 25923 were used to control quality, respectively.
Data Analysis
Data was entered into Epi Data 3.1 before exporting to SPSS. Collected data were coded, recorded, edited, and cleaned before analysis. Univariate and bivariate analyses of data were conducted using SPSS version 25 in order to determine the frequencies (percentages), correlation and mean difference among sample variables. The results are then presented using statements, tables and figures.
Operational Definitions
Bacteriological safe water: Water which has no detected coliform (TC or EC) bacteria in any 100mL of water sample.
Antimicrobial resistance pattern/profile: Antimicrobial susceptibility test results for particular bacteria against different antimicrobial agents.
Ethical Considerations
Ethical clearance was obtained from Bule Hora University, an ethical review board, via submission of the study protocol before the study commences. Official letters were submitted to Bule Hora Town water and health offices. The purposes and the importance of the study were explained, and informed consent was secured from each participant. Confidentiality was maintained at all levels of the study. Participant‘s involvement in the study was on a voluntary basis; participants who were unwilling to participate in the study and those who wished to quit their participation at any stage was informed to do so without any restrictions.
Result
Physical and Chemical Test Result
As shown in Table 2 out of 75 household water samples, 29 (38.7%) had temperatures in the range of 15–20°C and 46 (61.4%) had temperatures above 20°C. The correlation analyses performed indicate that the thermo-tolerant coliform in CFU/100mL was positively and significantly correlated with the temperature in °C of the drinking water of the households with (r=0.415, p-value = 0.000). The Chi-square test was performed and the result showed statistically significant variation in the isolates of the thermo-tolerant indicator in the temperature of drinking water of households ranging from 15°C to 20°C and above 20°C with X2 (1, N=75) = 27.22 and p-value = 0.000.
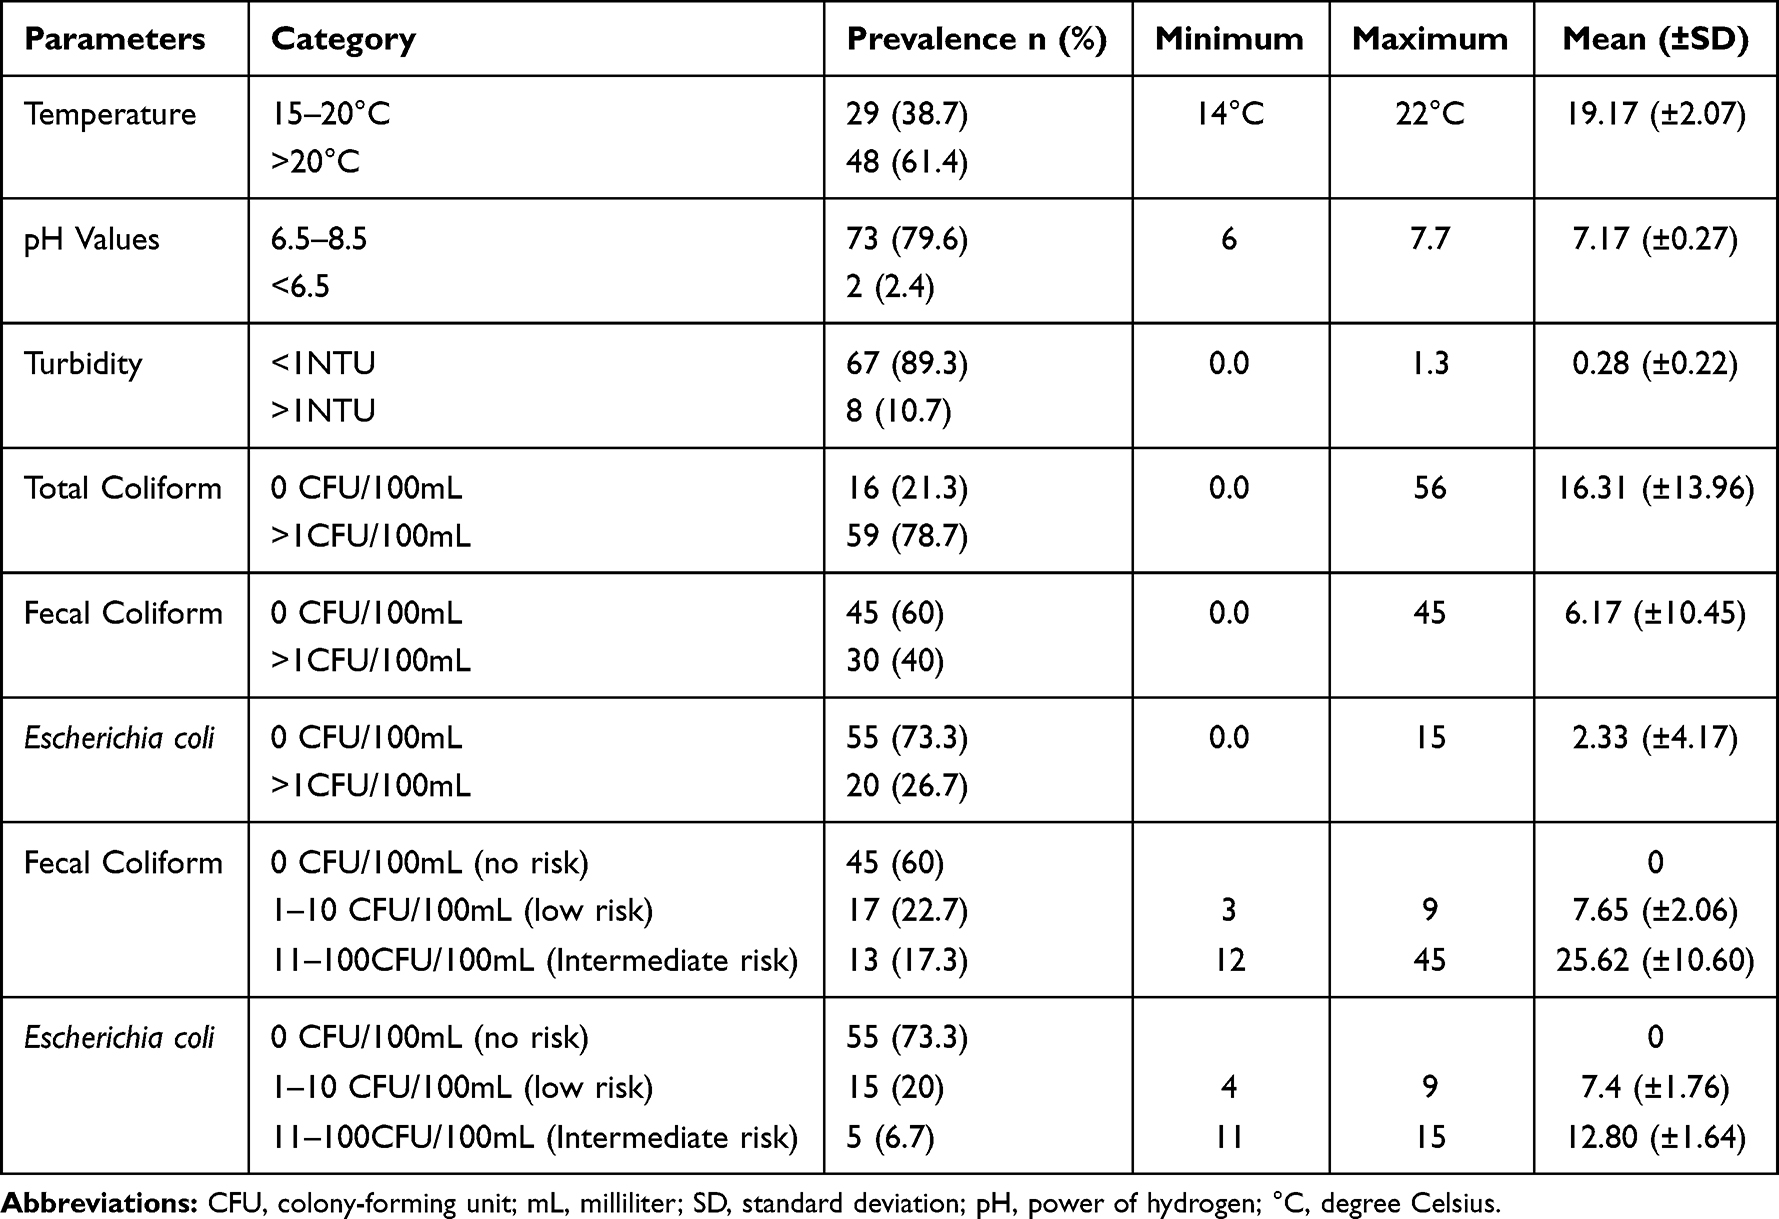 |
Table 2 Descriptive Analysis of Physico-Chemical and Bacteriological Prevalence of Drinking Water, Among Households in Bule Hora Town, South Ethiopia, 2021 (n=75) |
The majority 73 (97.6%) of the water samples had pH values in between 6.5 and 8.5 and the mean (standard deviation) of 7.17 (± 0.27) of sampled water. The majority 67 (89.3%) of drinking water samples had turbidity less than 1NTU and the rest 8 (10.7%) in between 1–2NTU. The mean (standard deviation) of the water turbidity was 0.28 (±0.22) sampled water. Residual free chlorine was not detected in all samples of water of the households.
Main Water Sources of the Households
More than 50% (40 [53.3%]) of the total collected and analyzed water samples of the households were from the private yard tap, followed by the neighboring yard tap 28 (37.3%) main water sources. Only 7 (9.3%) of water samples were mentioned to be from the public stand pipes of water sources. Of the water samples from the private yard tap 27 (36%) and from the neighboring yard tap 26 (34.7%), and from the public stand pipe 6 (8%) were positive for total coliforms. The analysis of the 2×2 table cross-tabulation revealed that in the private yard tap and the neighboring and public stand tap main water sources, total coliforms were less prevalent in the private yard tap than the neighboring yard tap and public stand pipe. About 81.25% of the private yard taps were negative for total coliform compared to 18.75% of the neighboring yard taps and public stand pipes. This difference was significant with (X2 = 5.02 (Continuity Correction), degree of freedom =1, n=75, and p value = 0.025).
Prevalence of Enterobacteriaceae from Point of Uses
As shown in Table 2, the risk levels of bacterial indicator organisms in water samples from household water containers were investigated. A total of 75 water samples were collected from household water containers. Majority 59 (78.7%) of water samples from households were positive for total coliform counts and the mean (standard deviation) of the total coliform counts of CFU/100mL was 16.31 (±13.96) in the samples of drinking water of the households.
Similarly, 30 (40%) samples were positive for thermo-tolerant coliform and the mean (standard deviation) of the thermo-tolerant coliform counts of CFU/100mL was 6.17 (± 10.45) in the sampled water. The risk level of the thermo-tolerant coliform prevalence was 17 (22.7%) and 13 (17.3%) for low risk (1–10) and intermediate risk (11–100) CFU/100mL, and the mean (standard deviation) was 7.65 (±2.06) and 25.62 (±10.60), respectively.
On the top of this, the analysis of household water samples revealed that 20 (26.6%) samples were positive for Escherichia coliform count and the mean (standard deviation) of the E. coliform counts of CFU/100mL was 2.33 (±4.17) in the sampled drinking water of households. The risk level of E. coli prevalence was 15 (20.0%) for low risk (1–10) CFU/100 mL, and 5 (6.7%) for intermediate risk (11–100) CFU/100 mL, respectively. The mean (standard deviation) of the low and intermediate risk level of E. coli prevalence was 7.4 (±1.76) and 12.80 (±1.64), respectively. The prevalence of the thermo-tolerant and Escherichia coliform indicator in CFU/100mL were positively and significantly correlated with risk level with (r=0.89, p-value <0.01, and r=0.98, p-value <0.01), respectively.
The average count of total coliform, thermo-tolerant and E. coli was beyond the recommended value by the WHO, which is 0 CFU/100 mL a sample. The results have shown that there is fecal contamination of stored household water in most surveyed households. High and very high risk levels were not detected for all indicator organisms.
Of the 75 household drinking water samples analyzed, Salmonella accounted for 18 (24%), Shigella 12 (16%) and other members of the Enterobacteriaceae such as Proteus spp., Citrobacter spp., Klebsiella spp., E. coli, and Enterobacter species were also isolated from the household of drinking water as shown in Figure 1.
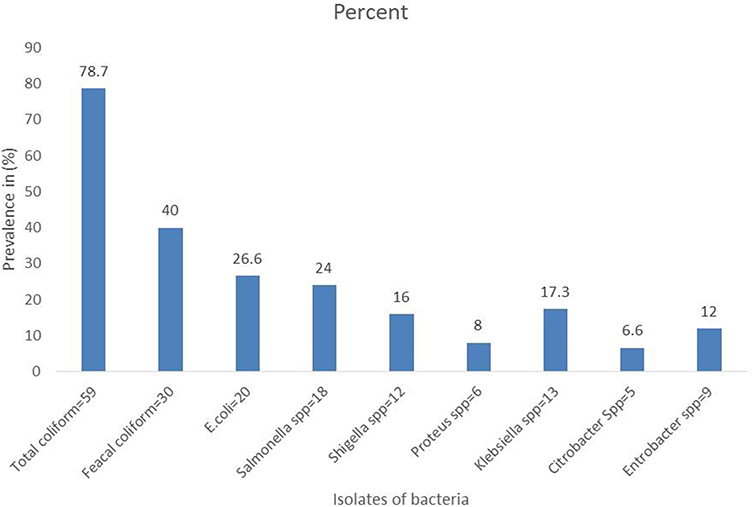 |
Figure 1 Prevalence of the isolates of Enterobacteriaceae in sample water from storage drinking water among households of Bule Hora Town, South Ethiopia, 2021. |
Antimicrobial Isolation and Susceptibility Test Profile
Figure 2 shows all isolates of Enterobacteriaceae showed 100% resistance to amoxicillin and ampicillin. Similarly, all isolates revealed 100% resistance to tetracycline except E. coli, Salmonella and Shigella species. Low levels of resistance were seen for gentamicin and ciprofloxacin. All isolates of Enterobacteriaceae showed multi-drug resistance to three or more antibiotics according to the Clinical and Laboratory Standard Institute (CLSI) criteria of 2019.17
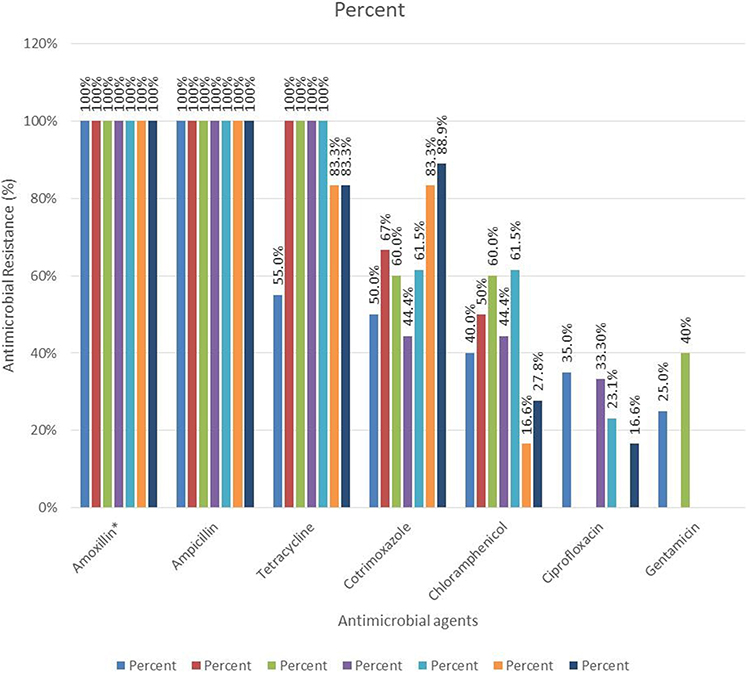 |
Figure 2 Antimicrobial resistance of Enterobacteriaceae isolated from household storage drinking water, among households of Bule Hora Town, South Ethiopia, 2021. Abbreviation: Amoxicillin*, amoxicillin plus clavulanic acid. |
Shigella showed 10 (83.3%), 2 (16.6%) and 10 (83.3%) and Salmonella showed 16 (88.9%), 5 (27.8%) and 15 (83.3%) resistant to cotrimoxazole, chloramphenicol and tetracycline, respectively.
Escherichia coli showed resistance to gentamicin 5 (25%), cotrimoxazole 10 (50%), chloramphenicol 8 (40%), ciprofloxacin 7 (35%) and tetracycline 11 (55%), respectively. Similarly, Klebsiella species showed resistance to cotrimoxazole, chloramphenicol and ciprofloxacin, 8 (61.5%), 8 (61.5%) and 3 (23.1%), respectively.
Other members of the Enterobacteriaceae resistance profile such as Proteus species, Citrobacter species, and Enterobacter species were also seen from the drinking water of the households as shown in Figure 2.
Out of 75 drinking water samples analyzed, 83 isolates of Enterobacteriaceae were identified as shown in Table 1. Of the identified isolates of Enterobacteriaceae, 53 (63.9%) were 100% resistance to three antimicrobial agents, namely amoxicillin, ampicillin and tetracycline, and 60 (72.3%) were resistance to five antimicrobial agents as shown in Figure 2.
Discussion
Currently, there is a lack of reliable human quantitative microbial health risk assessments of environmental exposures like drinking water for the development and implementation of appropriate risk management systems. This study assessed the antimicrobial resistance profile and quality of drinking water among households of Bule Hora Town, South Ethiopia.
The average prevalence of bacterial indicator organisms in water samples from household water storage containers, was about 78.6% for the total coliform, 40% for thermo-tolerant coliform, and 26.6% for Escherichia coliform, which was beyond the recommended value by the WHO and national standard (0 CFU/100mL of sample).7,12
Moreover, the findings of this study were higher when compared with the national study conducted in South Gondar3 that reported 50% for total coliform and in Bahir Dar town,6 which reported about 24.4%, 18.6% and 17.8% prevalence of total coliform, thermo-tolerant coliform and Escherichia coliform, respectively. However, it was lower when compared with a study conducted in Karachi town, Pakistan,18 that reported 96% prevalence of total coliform, the study conducted in Cajamarca, Peru,19 that reported about 55.4% and 37.3% prevalence of total coliform and Escherichia coliform, respectively. In addition, a higher prevalence of Escherichia coliform was reported in Arba Minch town, Ethiopia (81.1%),9 as compared to this study. The variation in the prevalence result of coliform groups in water samples could be speculated to the differences in sample size and water sources among the studies. But, it was consistent with another study conducted in Bahir Dar town, Ethiopia (77.1%).10
Furthermore, in this study, the isolates of Klebsiella, Enterobacter, and Citrobacter from household water container were higher than the study conducted in Cajamarca, Peru (8%, 5.1%, 2.5%), respectively.19 Similarly, the isolates of Klebsiella were higher than the study conducted in Andean, Peru (10.7%)20 However, the isolates of Citrobacter and Proteus were consistent with the study findings in Bahir Dar, Ethiopia (4.3% and 7.1%, respectively).6 Likewise, the isolates of Enterobacter in this study were consistent with the study in Andean, Peru (14.8%).20
All isolates of Enterobacteriaceae showed resistance to amoxicillin plus clavulanic acid and ampicillin. Specifically, the Escherichia coli resistance to amoxicillin plus clavulanic acid, ampicillin, chloramphenicol, cotrimoxazole, gentamycin and tetracycline was higher than the study in Cajamarca, Peru (3.4%, 28.2%, 11.9%, 17.9%, 2.6% and 32%), respectively.19 Similarly, the E. coli resistance to ciprofloxacin and cotrimoxazole was higher than the study conducted in Karachi, Pakistan (10.8% and 29.7%),18 and Bangladesh (19.7% and 37.9%),21 respectively. The difference might be the used media and discs.
However, the E. coli resistance to ciprofloxacin and cotrimoxazole in this study was less than the study conducted in Bangladesh (100% and 50%), respectively.22 On the other hand, Escherichia coli resistance to ampicillin, cotrimoxazole and tetracycline were consistent with the study conducted in Northern, Tanzania (100%, 46% and 57%), respectively.23 Similarly, the Escherichia coli resistance to amoxicillin plus clavulanic acid and chloramphenicol was consistent with the study conducted in South Gondar, Ethiopia (94.4% and 94.4%) and its resistance to amoxicillin plus clavulanic acid, ampicillin, cotrimoxazole, chloramphenicol and gentamycin were also consistent with the study conducted in Bahir Dar, Ethiopia (100%, 100%,45.5%, 37.3%, and 28.5%), respectively.6
The resistance to cotrimoxazole, and tetracycline of the isolates of Klebsiella species were higher than the study in Andean, Peru (33.3% and 33.3%)20 and in Bangladesh (25% and 0%).22 Similarly, the isolates of Klebsiella species resistance to cotrimoxazole in this study were higher than the study conducted in Karachi, Pakistan (29.4%).18 But Klebsiella was susceptible to gentamycin in this study, which was consistent with the study conducted in Andean, Peru.20
The resistance of Enterobacter species to cotrimoxazole in this study was higher than the study in Andean, Pakistan (29.4%).20 However, the resistance of Enterobacter species to the cotrimoxazole and ciprofloxacin was less than the study conducted in Bangladesh (50% and 75%).22 In this study, Citrobacter was resistance to cotrimoxazole, while it was susceptible in the study in Karachi, Pakistan.18 Proteus resistance to amoxicillin, tetracycline and cotrimoxazole was consistent with the study in Bangladesh (100%, 100% and 50%), respectively.22 However, Proteus was susceptible to gentamycin in this study, while it was resistance to it in study found in Bangladesh (25%).22
The prevalence of the isolates of Salmonella in this study was higher than the study in Ghana (4%).24 However, the prevalence of the isolates of the Salmonella and Shigella in this study was consistent with the study conducted in South, Gondar (22.7% and 15%), respectively.3
Moreover, Salmonella showed 88.9%, 27.8% and 83.3%, and Shigella showed 83.3%, 16.6% and 83.3% resistance to cotrimoxazole, chloramphenicol and tetracycline, respectively. Salmonella and Shigella resistance to amoxicillin, tetracycline and cotrimoxazole were higher than the study in Bangladesh (25% each), and (75%, 75% and 50%), respectively.22 Similarly, Salmonella resistance to ciprofloxacin and cotrimoxazole were higher than the study in Ghana (19.7% and 37.9%), respectively.24 But, the Salmonella and Shigella resistance to cotrimoxazole was lower than the study in South Gondar, Ethiopia (85% and 89.58%) respectively.3 The difference might be the difference in sample size and used media and discs.
Conclusion
The overall findings of the study indicated that most of the surveyed samples of drinking water from household storage were contaminated with fecal and antimicrobial resistance enteric waterborne pathogens. The users were at the potential risk from antimicrobial-resistant waterborne enteric pathogens such as Shigella species, Salmonella typhi and other Salmonella species, Escherichia coli, Klebsiella species, Citrobacter species and Proteus species. Thus, the researchers recommend further identification of antimicrobial-resistant bacteria with better detection methods in the environment like drinking water to address the human health risks from environmental exposures to antimicrobial-resistant bacteria.
Acknowledgments
We are very grateful for Bule Hora University, Bule Hora University Community Service and Research Office and Bule Hora University Institute of Health for their giving us the chance to undertake this research. We are also grateful for all Bule Hora University academic staff of Health Institute for their support in one or another way in conducting this research. Lastly but not least, we would like to acknowledge staff of Bule Hora Town health, water and administration offices and communities for their cooperation in providing us all the necessary information on the target population and general profile of the town, which are important for conducting this research.
Disclosure
The authors declare no conflicts of interest in relation to this work.
References
1. WHO/UNICEF. Progress on Sanitation and Drinking Water Rapport. Geneva: WHO/UNICEF; 2017:4–90.
2. CSA. Ethiopia Demographic and Health Survey. Addis Ababa: CSA; 2016:9–10.
3. Chalachew Y, Melese K, Melkamu M. Antimicrobial-resistance pathogen load and public health risk of drinking water in South Gondar. Res Square. 2020;1:1–14.
4. James VD, John B. All coliforms are not created equal: a comparison of the effects of water source and in-house water contamination on infantile diarrheal disease. Water Resour Res. 1983;29:1993.
5. Gonfa D, Fassil A, Mulissa J. Assessment of bacteriological and physicochemical quality of drinking water from source to household tap connection. J Environ Public Health. 2019;2129792:p1–7.
6. Abera B, Mulugeta K, Goraw G, Mulat Y. Bacterial quality of drinking water sources and antimicrobial resistance profile of enterobacteriaceas. J Water Sanitation Hygiene Dev. 2014;4:384–390. doi:10.2166/washdev.2014.105
7. WHO. Guidelines for Drinking-Water Quality in Surveillance and Control of Community Supplies. Geneva: WHO; 1997:P1–234.
8. Sobsey D. Antimicrobial Resistance and Water, Sanitation and Hygiene. Geneva: WHO; 2014.
9. Tigist G, Aberash A, Meriama M. Faecal Contamination of drinking water in Arba Minch Town. Adv Life Sci Technol. 2015;35:p9–14.
10. Milkiyas T, Mulugeta K, Bayeh A. Bacteriological and physicochemical quality of drinking water and hygiene-sanitation practices of the consumers in Bahir Dar City, Ethiopia. Ethiopia J Health Sci. 2011;21:19–26.
11. USA and CDC. A Guide to Conducting Household Surveys for Water Safety Plans Ed. CDC. Atlanta U.S: CDC; 2008:p24–25.
12. ESA. Compulsory Ethiopian Standard in Drinking Water Specification. Addis Ababa, Ethiopia: Ethiopia Standard Agency; 2013:p1–7.
13. ISO. Water Quality Detection of Salmonella Species in ISO19250 Detection of Salmonella Species. Geneva: International Organization for Standardization; 2010.
14. WHO. Chapter 8 Analytical Method for Microbiological Water Quality Testing. Köster NATEW, Botzenhart K, Burlion N, et al. Geneva: WHO; 2003.
15. ISO. Microbiology of Food Chain Preparation of Test Samples, Initial Suspension and Decimal Dilutions for Microbiological Examination in General Rules for Preparation of Initial Suspension and Decimal Dilutions. Geneva: International Organization for Standardization; 2017.
16. ISO. Water Quality - Enumeration of Culturable Microorganisms Colony Count by Inoculation in a Nutrient Agar Culture Medium in ISO 6222. Geneva: International Organization for Standardization; 1999.
17. CLSI. Performance Standards for Antimicrobial Susceptibility Testing, in CLSI Supplement M100. Wayne, PA USA: Clinical and Laboratory Standards Institute; 2019.
18. Sadia S, Imran A, Saima M. High heterotrophic counts in potable water and antimicrobial resistance among indicator organisms in two peri-urban communities of Karachi, Pakistan “. BMC Res Notes. 2018;18:p1–16.
19. Anika L, Stella M, Maribel R. Antibiotic-resistant Escherichia coli in drinking water samples from rural Andean households in Cajamarca, Peru. Am J Tropical Med Hygiene. 2019;100:p1363–68. doi:10.4269/ajtmh.18-0776
20. Stella M, Maria L, Gabriela S. Antimicrobial resistance in humans, animals, water and household environs in rural Andean Peru: exploring dissemination pathways through the One Health Lens. Int J Environ Res Public Health. 2021;10:1–16.
21. Zahid HM, Himayet K, Sobur A. Extended-spectrum beta-lactamase-producing Escherichia coli in drinking water samples from a forcibly displaced, densely populated community setting in Bangladesh. Front Public Health. 2020;8:1–14.
22. Tamanna Z, Khusbu A, Sharmin A, Mahmud R. Mosammat AB and Noor E, “Water quality and distribution of drug resistant bacteria in tap, well and surface water samples of randomly selected areas in Bangladesh. J Microbiol Exp. 2020;8:p193–98.
23. Beatus L, Joram B, Murugan S. Woutrina S and Douglas R, “Comparison of antibiotic resistant Escherichia coli obtained from drinking water sources in northern Tanzania: a cross-sectional study “. BMC Microbiol. 2016;870:1–10.
24. Denise D, Ralf K, Daniel E. Characterization of Salmonella enterica from invasive bloodstream infections and water sources in rural Ghana. BMC Infectious Dis. 2018;2:1–6.
 © 2022 The Author(s). This work is published and licensed by Dove Medical Press Limited. The
full terms of this license are available at https://www.dovepress.com/terms
and incorporate the Creative Commons Attribution
- Non Commercial (unported, 3.0) License.
By accessing the work you hereby accept the Terms. Non-commercial uses of the work are permitted
without any further permission from Dove Medical Press Limited, provided the work is properly
attributed. For permission for commercial use of this work, please see paragraphs 4.2 and 5 of our Terms.
© 2022 The Author(s). This work is published and licensed by Dove Medical Press Limited. The
full terms of this license are available at https://www.dovepress.com/terms
and incorporate the Creative Commons Attribution
- Non Commercial (unported, 3.0) License.
By accessing the work you hereby accept the Terms. Non-commercial uses of the work are permitted
without any further permission from Dove Medical Press Limited, provided the work is properly
attributed. For permission for commercial use of this work, please see paragraphs 4.2 and 5 of our Terms.