Back to Journals » International Journal of Nanomedicine » Volume 10 » Issue 1
Antileukemic effect of zerumbone-loaded nanostructured lipid carrier in WEHI-3B cell-induced murine leukemia model
Authors Rahman H ![]() , Rasedee A
, Rasedee A ![]() , How CW, Zeenathul NA, Chartrand M, Yeap SK, Abdul AB, Tan SW, Othman HH, Ajdari Z, Namvar F, Arulselvan P
, How CW, Zeenathul NA, Chartrand M, Yeap SK, Abdul AB, Tan SW, Othman HH, Ajdari Z, Namvar F, Arulselvan P ![]() , Fakurazi S, Mehrbod P, Daneshvar N, Begum H
, Fakurazi S, Mehrbod P, Daneshvar N, Begum H
Received 4 May 2014
Accepted for publication 28 June 2014
Published 2 March 2015 Volume 2015:10(1) Pages 1649—1666
DOI https://doi.org/10.2147/IJN.S67113
Checked for plagiarism Yes
Review by Single anonymous peer review
Peer reviewer comments 4
This paper has been retracted.
Heshu Sulaiman Rahman,1–3 Abdullah Rasedee,1,2 Chee Wun How,2 Nazariah Allaudin Zeenathul,1,2 Max Stanley Chartrand,4 Swee Keong Yeap,2 Ahmad Bustamam Abdul,2,5 Sheau Wei Tan,2 Hemn Hassan Othman,1,3 Zahra Ajdari,6 Farideh Namvar,7 Palanisamy Arulselvan,2 Sharida Fakurazi,2,5 Parvaneh Mehrbod,2 Nasibeh Daneshvar,2 Hasina Begum2
1Faculty of Veterinary Medicine, 2Institute of Bioscience, Universiti Putra Malaysia, Selangor, Malaysia; 3Faculty of Veterinary Medicine, University of Sulaimany, Sulaimany City, Northern Iraq; 4DigiCare Behavioral Research, Casa Grande, AZ, USA; 5Faculty of Medicine and Health Science, Universiti Putra Malaysia, Selangor, Malaysia; 6Faculty of Science and Technology, University Kebangsaan Malaysia, Selangor, Malaysia; 7Institute of Tropical Forestry and Forest Products (INTROP), Universiti Putra Malaysia, Selangor, Malaysia
Abstract: Cancer nanotherapy is progressing rapidly with the introduction of many innovative drug delivery systems to replace conventional therapy. Although the antitumor activity of zerumbone (ZER) has been reported, there has been no information available on the effect of ZER-loaded nanostructured lipid carrier (NLC) (ZER-NLC) on murine leukemia cells. In this study, the in vitro and in vivo effects of ZER-NLC on murine leukemia induced with WEHI-3B cells were investigated. The results from 3-[4,5-dimethylthiazol-2-yl]-2,5-diphenyltetrazolium bromide, Hoechst 33342, Annexin V, cell cycle, and caspase activity assays showed that the growth of leukemia cells in vitro was inhibited by ZER-NLC. In addition, outcomes of histopathology, transmission electron microscopy, and Tdt-mediated dUTP nick-end labeling analyses revealed that the number of leukemia cells in the spleen of BALB/c leukemia mice significantly decreased after 4 weeks of oral treatment with various doses of ZER-NLC. Western blotting and reverse-transcription quantitative polymerase chain reaction assays confirmed the antileukemia effects of ZER-NLC. In conclusion, ZER-NLC was shown to induce a mitochondrial-dependent apoptotic pathway in murine leukemia. Loading of ZER in NLC did not compromise the anticancer effect of the compound, suggesting ZER-NLC as a promising and effective delivery system for treatment of cancers.
Keywords: zerumbone-loaded nanostructured lipid carrier, leukemia, WEHI-3B cells, BALB/c mice, apoptosis, mitochondrial pathway
Introduction
Leukemia, a blood or bone marrow cancer, is the seventh most common cancer in humans of all ages with the highest incidence among children aged 14 years or less.1 In the United States, an estimated 48,610 new leukemia cases with 23,620 deaths were reported in 2013. Among these fatalities were children, comprising 30% of the cases.2
There have been dramatic improvements in blood cancer treatment using chemotherapy, ionizing radiation, radioimmunotherapy, immunotherapy, gene therapy, and stem cell transplantation. However, most of these therapies are plagued with side effects, and almost all cause cytotoxicity in healthy cells.3
Natural compounds have been an important source of drugs since ancient times. In medicine, some natural compounds were initially used as therapeutic compounds while others served as sources of chemical templates for the development of synthetic drugs. Many active principles derived from natural compounds have powerful chemopreventive activities in diseases.4 Active principles from natural sources with anticancer properties exhibit their activities via apoptotic and cell-signaling pathways, and act on cancer targets. These activities suggest that compounds derived from natural compounds are excellent starting points for the design and development of novel and biologically active cancer preventive agents.5
Although natural products have strong therapeutic values, many of their derivatives have poor water solubility and bioavailability, which severely limit their use in medicine.6 The nanoparticle delivery systems are newly introduced methods to overcome these limitations, turning potential but poorly soluble drugs into effective therapeutic agents.7 Among the nanoparticles, lipid nanoparticles are particularly compatible for use in humans and animals. These nanoparticles are not only less toxic to normal cells and biodegradable even with loaded drugs but they have also been recognized as safe and effective for topical and parenteral applications.8 Natural product nanoparticles with anticancer properties offer considerable advantage over currently employed chemopreventive and chemotherapeutic approaches in the treatment of cancers.4
Nanocarriers are nanosized materials (1–100 nm) that can carry multiple drugs or compounds. Nanocarriers can also be used to increase local drug concentration by the incorporation of drugs while facilitating controlled release at the targets. Currently, there are only a few clinically approved nanocarriers that incorporate molecules for selective binding and targeting of cancer cells, which comprise polymer conjugates, polymeric nanoparticles, lipid-based carriers (liposomes and micelles), dendrimers, carbon nanotubes, and gold nanoparticles (nanoshells and nanocages).9
Zerumbone (ZER), the predominant natural compound in the rhizome of Zingiber zerumbet, has poor water solubility. We have developed a ZER-loaded nanostructured lipid carrier (NLC) (ZER-NLC) by the high-pressure homogenization technique. ZER-NLC was shown to have anticancer properties and is particularly effective in the treatment of a human lymphoblastic leukemia cell line. Physicochemical and stability characterization showed that ZER-NLC possesses all the characteristics of an excellent delivery system for ZER.10,11
Although ZER-NLC was shown to exhibit antileukemia properties in vitro, its in vivo effect was uncertain. Thus, the present study was conducted to determine the effect of ZER-NLC on WEHI-3B (murine myelomonocytic leukemia) cell-induced leukemia in a BALB/c mice model. The murine system was chosen because of ease of establishment of leukemia in this animal model.12
Materials and methods
Leukemia cell line and culture condition
The murine myelocytic leukemia cell line (WEHI-3B) was purchased from American Type Culture Collection (ATCC) (Manassas, VA, USA). The cells were maintained in a complete growing RPMI-1640 (Sigma-Aldrich, St Louis, MO, USA) medium, supplemented with 10% fetal bovine serum (FBS) (PAA, Linz, Austria), and 1% antibiotic-antimycotic (Thermo Fisher Scientific, Waltham, MA, USA) in 75 cm2 culture flasks (TPP, Trasadingen, Switzerland) at 37°C and 5% CO2 in a humidified incubator (Binder, Tuttingen, Germany).
Reagents and chemicals
All reagents and chemicals were analytical grade and obtained from highly reputed companies. 3-[4,5-Dimethylthiazol-2-yl]-2,5-diphenyltetrazolium bromide (MTT) dye, dimethylsulfoxide (DMSO), doxorubicin, Hoechst 33342, propidium iodide (PI), phosphate-buffered saline (PBS) tablets, bovine serum albumin (BSA), ethylenediaminetetraacetic acid (EDTA), Triton X-100, RNAase A, Bradford stain, protease inhibitor cocktail, Tween-20, sodium dodecyl sulfate (SDS), formaldehyde, 4% glutaraldehyde, sodium cocodylate, osmium tetra-oxide, uranyl acetate, citrate, and skimmed milk powder were purchased from Sigma-Aldrich. Other reagents and chemicals used were 10% formalin (Triangle Biomedicinal Sciences (TBS), Cincinnati, OH, USA), paraffin wax (Leica EG1160, Germany), ketamine·HCl (Ilium, Ketamil, Australia) xylazine (Ilium, Xylazil-20, Australia), toulidine blue (Thermo Fisher Scientific), resin (TAAB Company, England), and RIPA lysis buffer (Thermo Fisher Scientific, Waltham, MA, USA).
ZER-loaded NLC
Pure (99.96%) colorless ZER crystals were extracted from the essential oil of fresh Zingiber zerumbet rhizomes by steam distillation according to the method described earlier.10 ZER-NLC was prepared by a high-pressure homogenization method and characterized by zetasizer, reverse-phase high-performance liquid chromatography, transmission electron microscopy, wide-angle X-ray diffraction, differential scanning colorimetry, and Franz Diffusion Cell system analyses. The loaded nanoparticles were shown to be physically stable with a particle size of 52.68±0.1 nm, zeta potential of −25.03±1.24 mV, and polydipersity index of 0.29±0.0041 μm.10,11
In vitro cytotoxic effect of ZER-loaded NLC on WEHI-3B
Colorimetric cytotoxicity effect of ZER-NLC on WEHI-3B cells
The antiproliferative effect of ZER-NLC at concentrations of 1–100 μg/mL on treated WEHI-3B cells was assessed using MTT assay according to the method described earlier.13 Briefly, about 1×10⁵ cells were seeded into each well of a 96-well plate and incubated for 24 hours to allow attachment. After treating with ZER-NLC for 24 hours, 48 hours, and 72 hours, MTT was freshly prepared at a concentration of 5.5 mg/mL and incubated with cells for 4 hours. The formazan crystals formed were dissolved in 100 μL of DMSO. The optical density (OD) of the suspension was measured at 570 nm using an ELISA plate reader (Universal Microplate reader; Biotech, Inc., Oklahoma City, OK, USA). Doxorubicin treatment was used as positive control, while DMSO (0.1%) was used as negative control. Finally, the IC50 (half maximal inhibitory concentration) values were compared with those of the positive antineoplastic agent control. All experiments were conducted in triplicates.
Morphological assessment of apoptotic cells by fluorescent microscopy
WEHI-3B cells (1×10⁵ cells/mL) were seeded on a 25 cm2 culture flask and treated with 7.5±0.55 μg/mL (IC50 concentration at 72 hours) of ZER-NLC for 24 hours, 48 hours, and 72 hours. The cells were then collected and washed twice with cold PBS. Approximately 10 μL of cell suspension were stained on a glass slide, in the dark, with a mixture of 10 μL Hoechst 33342 (1 mM) and 5 μL PI (100 μg/mL). Morphological changes of stained cells were observed under a fluorescence microscope (Zeiss, Germany) within 30 minutes of preparation.14
Early cell apoptosis detection by annexin V-FITC/PI assay
Apoptosis was detected with an annexin V/FITC kit (Sigma- Aldrich) following instructions of the manufacturer without modifications. Briefly, about 1×10⁵ WEHI-3B cells pretreated for 12 hours, 24 hours, and 48 hours with ZER-NLC were harvested and washed with prechilled PBS. The cells were suspended in 500 μL of 1× binding buffer and stained with annexin V (5 μL) and PI (10 μL), and incubated on ice in the dark for 15 minutes. Flow cytometric analysis was immediately conducted using an argon laser emitting at 488 nm using a BD FACSCalibur flow cytometer (BD Biosciences, San Jose, CA, USA). Data analysis was performed using the Summit V4.3 software (Beckman Coulter, Inc., Brea, CA, USA).
Determination of DNA content of the cells by cell cycle analysis
Cell cycle analysis of ZER-NLC-treated leukemic cells was conducted according to the method described previously with slight modification.15 The WEHI-3B cells were seeded at a density 1×10⁵ cells/mL and incubated for 24 hours. The cells were then treated with 7.5±0.55 μg/mL ZER-NLC for 24 hours, 48 hours, and 72 hours. After incubation, the cell pellets were washed with the washing buffer (cold PBS/BSA/EDTA containing 0.1% sodium azide), fixed in 500 μL 80% cold ethanol, and kept at −20°C for 1 week. Then the cells were washed twice with washing buffer, and 1 mL staining buffer containing 0.1% Triton X-100, 50 μL RNase A (1.0 mg/mL), and 25 μL PI (1.0 mg/mL) was added to the fixed cells and incubated for 30 minutes on ice in the dark. The DNA content of cells was then analyzed using the BD FACSCalibur flow cytometer. Data analysis was performed using the Summit V4.3 software.
Caspase activities assay
The caspase-3 and -9 activities in the WEHI-3B cells were determined using fluorometric assay kit according to the instructions of the manufacturer (Abcam, Cambridge, MA, USA). Briefly, 1×10⁵ WEHI-3B cells were seeded in a 96-well plate overnight, treated with 7.5±0.55 μg/mL ZER-NLC, and incubated for 24 hours, 48 hours, and 72 hours. The cells were then washed with cold PBS and made to a final volume of 50 μL with dH2O, and 5 μL active caspase, 50 μL master mix containing 2× reaction buffer, and 50 μM caspase substrate were added to the suspension. After incubation at 37°C for exactly 1 hour, the samples were read in a fluorescence plate reader (Infinite M200, Tecan, USA) equipped with a 400 nm excitation filter and 505 nm emission filter. Data were presented as OD, and a histogram was plotted.
In vivo antileukemic effect of ZER-loaded NLC
Preparation of cancer cells and leukemia induction
The WEHI-3B cells were grown to reach 90% confluence. The medium was removed, and the cells washed twice with PBS, stained with Trypan blue (Sigma-Aldrich), and counted under a light microscope (Nikon, Japan).16 The cells were then suspended in 300 μL PBS and used within 1 hour of preparation.
Animals
Sixty adult male BALB/c mice aged 6 to 8 weeks were purchased from the animal house of the Faculty of Medicine, Universiti Putra Malaysia. The mice were housed in polypropylene plastic cages with wood chips as bedding. They were acclimatized to the laboratory environment at 24°C±1°C under a 12-hour dark–light cycle for at least 5 days before commencement of the experiment. The mice were provided pellet and water ad libitum during the period of study. This study was approved by the Animal Care and Use Committee (ACUC), Faculty of Veterinary Medicine, Universiti Putra Malaysia (UPM/FPV/PS/3.2.1.551/AUP-R152).
The mice were divided into six groups of ten animals each. All animals in five groups were anesthetized by intraperitonal injection of a mixture of ketamine·HCl and xylazine, and further injected intraperitonally with 300 μL of WEHI-3B cells (1×10⁶ cells/animal) in PBS using a tuberculin syringe and 26G needle. One group was not treated. Starting the following day, a drop of blood from the tail veins of four mice from each group was collected for 5 consecutive days. Blood smears were observed under Wright stain to ascertain development of leukemia.
Experimental design and drug treatment
Assignment of the mice groups was as follows: Group 1 comprised the untreated, normal, healthy mice and served as the negative controls. Group 2 served as the leukemia control, while Groups 3, 4, and 5 were leukemic mice treated daily with 60 mg/kg body weight with blank NLC (vehicle) and 30 and 60 mg/kg body weight ZER-NLC, respectively. Animals in Group 6 were treated with 4 mg/kg body weight all trans-retinoic acid (ATRA) (Sigma-Aldrich), an anticancer chemotherapy drug, dissolved in olive oil (Sigma-Aldrich) and served as positive control. The animals were deprived of feed for 12 hours prior to treatment. The drugs were given orally exactly 4 days after administration of WEHI-3B cells and after confirmation of leukemia development. Treatments were instituted through gastric intubations using a ball-tipped stainless steel gavage needle attached to a syringe, once every day for 4 consecutive weeks. At the end of the study, the mice were euthanized with an overdose of a mixture of ketamine·HCl and xylazine administered intraperitonally, and spleen samples were collected.
Histopathology
Spleen tissue samples were cut into small pieces and fixed in 10% formalin for at least 48 hours. The fixed samples were dehydrated using an automated tissue processor (Leica ASP300, Leipzig, Germany), embedded in paraffin wax (Leica EG1160, Leipzig, Germany). Then the blocks were trimmed and sectioned using a microtome (Leica RM2155). The tissue sections were mounted on glass slides using a hotplate (Leica HI1220) and subsequently treated in order with 100%, 90%, and 70% ethanol for 2 minutes each. Finally, the tissue sections were stained with the Harris’s hematoxylin and eosin (H&E)17 and examined under a light microscope (Nikon, Chiyoda-ku, Tokyo, Japan) under ×1000 magnification.
Leukemia scoring was conducted on H&E-stained sections based on the number of leukemic cells in the spleen tissues. Score 0 = normal (no leukemic cells), score 1 = mild (leukemic cells between 0 cells/hpf and 25 cells/hpf), score 2 = moderate (leukemic cells between 25 cells/hpf and 50 cells/hpf), score 3 = severe (leukemic cells between 50 cells/hpf and 75 cells/hpf), and score 4 = more severe (leukemic cells between 75 cells/hpf and 100 cells/hpf).18
Transmission electron microscopy
Spleen samples were cut into sections of approximately 0.5 cm2 and fixed in 4% glutaraldehyde in a cocodylate buffer overnight. The specimens were washed in sodium cocodylate buffer and post-fixed in 1% osmium tetra-oxide. Then, the specimens were washed again in sodium cocodylate buffer, dehydrated in ascending grades (35%, 50%, 75%, 95%, and 100%) of acetone, infiltrated with a mixture of acetone and resin (50:50), embedded with 100% resin in beam capsule, and then polymerized. Then, the area of interest was chosen from the thick sections, stained with toulidine blue, and examined under light microscopy. The selected area was cut into ultrathin sections using an ultramicrotome, placed on copper grids, and stained with uranyl acetate and citrate. The tissue was finally washed twice with distilled water and viewed under a transmission electron microscope (Phillips, Eindhoven, the Netherlands).
TUNEL assay
Apoptosis in spleen tissues was determined using the TUNEL (Tdt-mediated dUTP nick-end labeling) kit according to manufacturer’s protocol (DeadEndTM fluorometric TUNEL system, Promega, Fitchburg, MI, USA). The spleen tissue sections were deparaffinized, rehydrated, fixed in formaldehyde, and equilibrated. Then, rTdT incubation buffer was added to the equilibrated area, which was then covered with a plastic cover slip and incubated at 37°C for 60 minutes in a humidified chamber away from direct light. The reactions were terminated by immersing the slides in 2× SSC (saline sodium citrate) and stained with freshly prepared PI solution in PBS in the dark. The slides were washed with PBS between each step. Finally, the samples were mounted on a glass cover slip and viewed under the fluorescent microscope using a standard fluorescent filter set to view the green fluorescence at 520±20 nm and the red fluorescence of PI at >620 nm at ×400 magnification.
Apoptosis scoring of the TUNEL slides of the spleen tissue was based on the following: Score 0 = no apoptosis, score 1 = mild apoptosis (apoptotic cells between 0 cells/hpf and 25 cells/hpf), score 2 = moderate apoptosis (apoptotic cells between 25 cells/hpf and 50 cells/hpf), score 3 = highly moderated apoptosis (apoptotic cells between 50 cells/hpf and 75 cells/hpf), and score 4 = marked apoptosis (apoptotic cells between 75 cells/hpf and 100 cells/hpf).19
Western blotting
Protein extraction from mice spleen tissues was done by snap-freezing the tissues in liquid nitrogen and adding RIPA lysis buffer (Thermo Fisher Scientific, Waltham, MA, USA) containing protease inhibitor cocktail (Sigma-Aldrich) to the tissue.20 The concentrations of protein in the suspensions were quantified using the Bradford protein assay kit.21 The suspension was aliquoted into PCR tubes (Bio-Rad Laboratories Inc., Hercules, CA, USA) and stored at −80°C until use. Equal amounts of protein (25 μg) were resolved and separated based on molecular weight via electrophoresis in an electric field of the 10% SDS-PAGE system (Bio-Rad). The broad, prestained protein molecular weight ladder (GeneDirex, Las Vegas, NV, USA) was used to assess protein migration. The proteins were transferred and blotted on to a polyvinylidene fluoride membrane (Bio-Rad) and were blocked sequentially for 1 hour in the blocking solution at room temperature on the Belly Dancer® (Stovall, Life Science Inc., NC, USA). The membranes were washed with PBS containing 0.5% Tween-20 (PBST) and probed with specific primary antibodies to subunits Bcl-2, Bax, Cyt-c, PARP, and FasL in PBST containing 5% skimmed milk (Abcam, Cambridge, MA, USA), and mixed overnight at 4°C on a roller mixer. β-Actin served as the internal control.22 The following day, the membranes were washed several times with PBST and incubated with goat–anti-rabbit IgG conjugated to horseradish peroxidase secondary antibody in PBST containing 5% skimmed milk (Abcam, Cambridge, UK) at room temperature for 1 hour. The membranes were again washed with PBST. The immunoreacted protein bands were developed and detected using a chemiluminescence blotting substrate kit (ECL western blot substrate; Abcam, Cambridge, UK).23 A chemiluminescence image analyzer system (Chemi-Smart, Vilber Lourmat, Germany) was used to view the membranes. The results were expressed in standard units and intensity of bands was quantitated using the image J software (BioTechniques, New York, NY, USA).
Relative quantitative gene transcription assay (qRT-PCR)
Total RNA was extracted from spleen tissue specimens using the RNeasy® lipid tissue mini kit (Qiagen, Valencia, CA, USA)24 before conducting q-PCR analysis. The extracted RNA was quantified using a nanophotometer (IMPLEN, GmbH, Germany), aliquoted, and stored at −80°C. The sequences of the primers were designed by and obtained from Integrated DNA Technologies (IDT, Coralville, USA) (Table S1). qRT-PCR assays for RNA of target Bcl-2, Bax, Cyt-c, PARP, and FasL, as well as the reference genes glyceraldehydes 3-phosphate dehydrogenase (GAPDH) and β-actin, were run for all animal groups using QIAGEN® one-step RT-PCR SYBR green kit (Qiagen).25 The cycles were set at 50°C for 10 minutes (reverse transcription), 1 cycle of 95°C for 5 minutes (initial activation), and 39 cycles of 95°C for 10 seconds (denaturation) and 50°C–60°C for 30 seconds (combined annealing and extension). The fluorescence was recorded after each extension step. The threshold was set manually at the exponential phase of the amplification process, and the melting curve analysis was performed from 70°C to 95°C, with 0.5°C per 5-second increments. All reactions were performed in triplicates, and the relative expression of genes were analyzed using the CFX Manager™ software, version 1.6 (BioRad, Hercules, CA, USA) incorporated in the real-time PCR thermal cycler (BioRad). The Ct values were determined for each sample by comparing the values of the target gene with those of the GAPDH and β-actin constitutive gene products.
Statistical analysis
The results were expressed as mean ± SD. Statistical analysis was accomplished using SPSS version 20.0. Data were analyzed using the one-way ANOVA, followed by the post hoc Tukey’s b-test. Probability values of less than 0.05 (P<0.05) were considered statistically significant.
Results and discussion
The NLC-based drug-delivery systems are used for improving drug efficacy through increased solubility, sustained release, and prolonged effect and tissue targeting.26 This system is ideal for the water-insoluble ZER, facilitating parenteral applications, increasing the half-life, and improving tumor-targeted delivery.27 To ascertain the potential of ZER-NLC as an anticancer compound, its anticancer effects were determined by in vitro and in vivo methods.
In vitro cytotoxicity of ZER-NLC
Cell viability of WEHI-3B leukemia cells treated with ZER-NLC
Under the experimental conditions, various concentrations of ZER-NLC exhibited significant (P<0.05) and marked inhibition on the survival of WEHI-3B cells with IC50 values 14.25±0.36 μg/mL, 10.42±0.77 μg/mL, and 7.5±0.55 μg/mL for 24 hours, 48 hours, and 72 hours treatment, respectively (Figure 1A). We have also shown in a previous study that the cytotoxicity of ZER-NLC is primarily due to the ZER itself and not NLC. In that study, we showed that the anticancer activity of ZER is not affected or impaired by its incorporation into NLC.10 In the current study, doxorubicin, an antitumor antibiotic made from natural products produced by the species of the soil fungus Streptomyces,28 was used as positive control. Doxorubicin imposed a significant (P<0.05) cytotoxic effect on WEHI-3B cells in a time-dependent manner with an IC50 of 1.3±0.15 μg/mL, 1.09±1.24 μg/mL, and 0.82±1.5 μg/mL after 24 hours, 48 hours, and 72 hours incubation (Figure 1B). DMSO as a negative control did not exhibit any inhibitory effect toward WEHI-3B cells. By the IC50 values, ZER-NLC seems to exhibit lower cytotoxicity than doxorubicin on WEHI-3B cells.
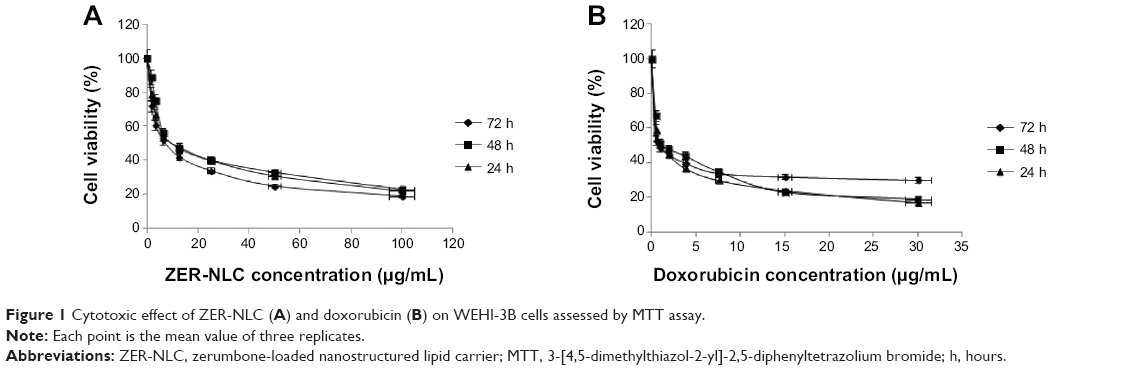 | Figure 1 Cytotoxic effect of ZER-NLC (A) and doxorubicin (B) on WEHI-3B cells assessed by MTT assay. |
Induction of apoptosis achieved by Hoechst 33342 staining
In an attempt to elucidate the mechanism of loss in cell viability induced by ZER-NLC, the Hoechst 33342 staining technique was used to determine development of apoptosis and morphology of the treated WEHI-3B cells. Staining the ZER-NLC-treated WEHI-3B cells for 24 hours showed the development of typical features of apoptosis such as chromatin condensation and morphology changes, as well as cell shrinkage and membrane blebbing. The ZER-NLC-treated cells (48 hours) had smaller nuclei; some had peripherally condensed or clumped chromatin, whereas others had fragmented nuclear chromatin. Apoptotic body formation was more prominent at 72 hours post ZER-NLC treatment. These observations suggest that the death of ZER-NLC-treated WEHI-3B cells occurred in a time-dependent manner. In contrast, the cells in control group, which were not treated, demonstrated normal nuclear and cellular morphology (Figure 2).
 | Figure 2 Fluorescent photomicrographs of WEHI-3B cells stained with Hoechst 33342 and treated with zerumbone nanostructured lipid carrier. |
Phosphatidylserine externalization
The rate of apoptosis of ZER-NLC-treated WEHI-3B cells was quantitated using the Annexin V-FITC/PI staining method, which is based on the externalization of phosphatidylserine to the cell surface during apoptosis.29 The experiment showed that the population of early and late apoptotic cells increased gradually and significantly (P<0.05) in all treated groups with a concomitant decrease in the viable cell population with time (Figure 3). At 12 hours of treatment, a large number of cells were primarily in the early phase of apoptosis (18.50%±0.91%) and, with increase in the incubation time to 48 hours and 72 hours, more cells entered the late phase of apoptosis with values of 19.79%±0.62% and 27.36%±0.10%, respectively (Table S2).
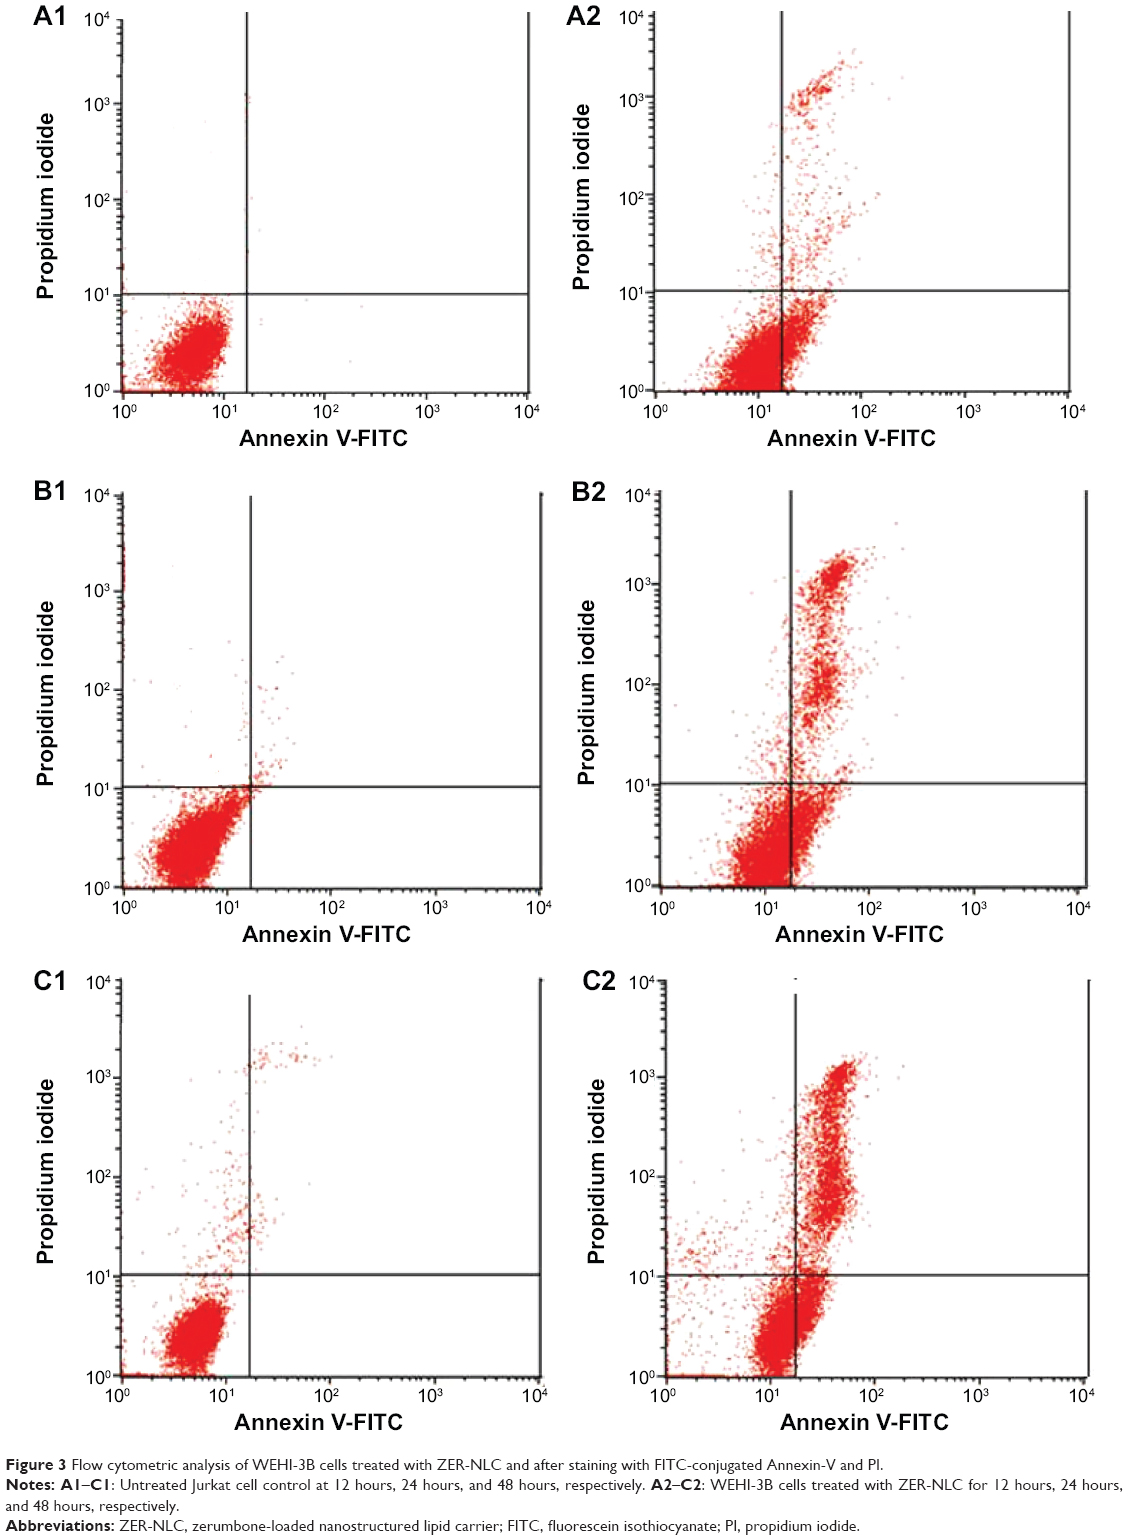 | Figure 3 Flow cytometric analysis of WEHI-3B cells treated with ZER-NLC and after staining with FITC-conjugated Annexin-V and PI. |
Thus, we concluded that ZER-NLC treatment induces apoptosis in WEHI-3B cells in a time-dependent manner, with gradual and significant (P<0.05) increase in early and late apoptotic cells and consequential decrease in viable cells. The results show that ZER-NLC induces suppression of WEHI-3B cell growth via induction of apoptosis.
Cell cycle assay
Cell cycle analysis was conducted to verify the morphological changes, and the assessment by Annexin V/PI staining was to see the effect of ZER-NLC on apoptosis. In terms of cell cycle evaluation, shifts in the redistribution of cell cycle phases in response to various stimuli, including a response to growth factors, drugs, mutations, or nutrients, can be readily assessed by flow cytometry via the staining of DNA using dyes such as PI.30 Cell cycle analysis demonstrated that the untreated cells showed normal DNA content and cell cycle distribution. On the other hand, ZER-NLC induced significant (P<0.05) accumulation of WEHI-3B cell population with a peak (21.22%±0.66%) at the subG0/G1 phase, especially after 72 hours of treatment. The result is consistent with the hypothesis that the appearance of sub-G1 cells is the marker of cell death by apoptosis.31 Treatment with ZER-NLC also induced cell cycle arrest in the G2/M phase with values of 10.54%±0.45%, 19.62%±0.37%, and 30.56%±0.53% after 24 hours, 48 hours, and 72 hours of treatment, respectively (Figure 4 and Table S3). Arrest of cancer cells in the G2/M phase induced by ZER-NLC was also shown to occur in the human lymphoblastic leukemia (Jurkat) cell line.32
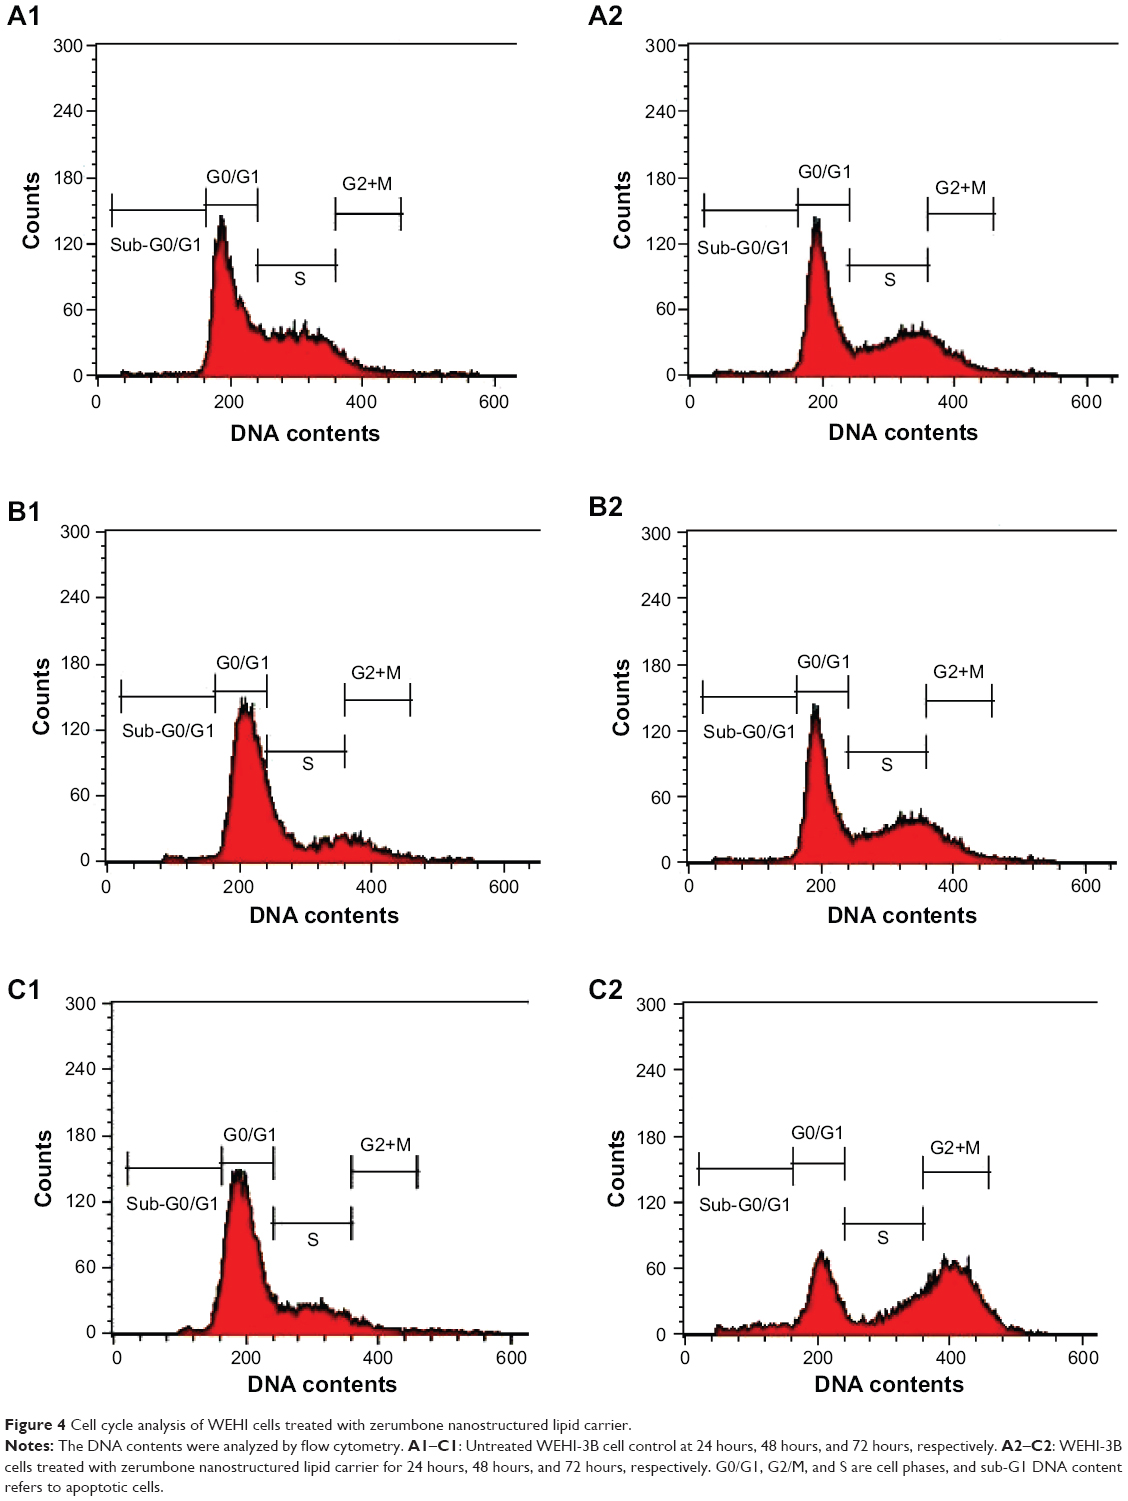 | Figure 4 Cell cycle analysis of WEHI cells treated with zerumbone nanostructured lipid carrier. |
Induction of apoptosis by caspase protease family
Caspases are produced by cells as inactive zymogens and undergo proteolytic activation during apoptosis. The activation of caspase proteases is a critical event in the induction of apoptosis.33 Caspase-9 is an upstream initiator caspase, while caspase-3 is one of the downstream effectors that play a central role in the initiation of apoptosis. Thus, to investigate the involvement of caspases in ZER-NLC-induced apoptosis, the activities of these proteases were determined in the treated WEHI-3B cells. ZER-NLC significantly (P<0.05) stimulated both caspase-3 and -9 activities in the treated WEHI-3B cells with more than onefold time-dependent increase over the untreated control groups (Figure 5 and Table S4).
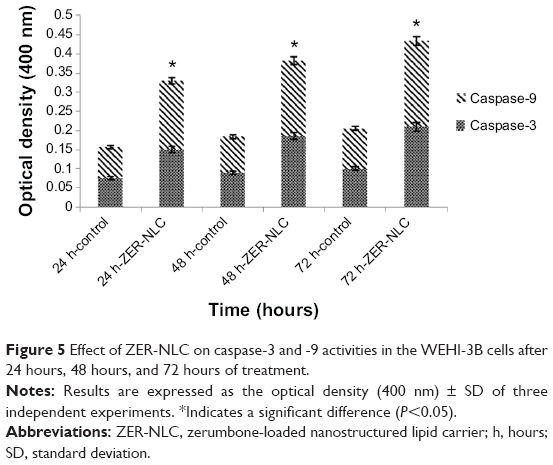 | Figure 5 Effect of ZER-NLC on caspase-3 and -9 activities in the WEHI-3B cells after 24 hours, 48 hours, and 72 hours of treatment. |
The mechanism of ZER-NLC-induced apoptosis in Jurkat and WEHI-3B cells is similar.10,11 Like in the case of Jurkat cells, ZER-NLC caused time-dependent increases in caspase-3 and -9 activities in WEHI-3B cells. Thus, these results suggest that ZER-NLC decreased the viability of WEHI-3B cells mainly through the induction of apoptosis via intrinsic mitochondrial pathway.
In vivo antileukemic effect of ZER-NLC
The WEHI-3B leukemia cell line was first established in 1969 and demonstrated identifiable characteristics of myelomonocytic leukemia. It has since been used successfully to induce leukemia in syngenic BALB/c mice, which has become a useful animal model for leukemia studies, including the effect of drugs and natural compounds.34 In this study, the BALC/c mice were induced to develop leukemia with administration of WEHI-3B cells and treated with ZER-NLC.
Blood smear
Leukemic mice showed increased number of immature myeloid and monocytic cells in circulation. The cells appeared large with high cytoplasm to nucleus ratio (Figure 6). These manifestations were observed in the mice as early as 4 days following the intraperitonal inoculation of WEHI-3B cell line.
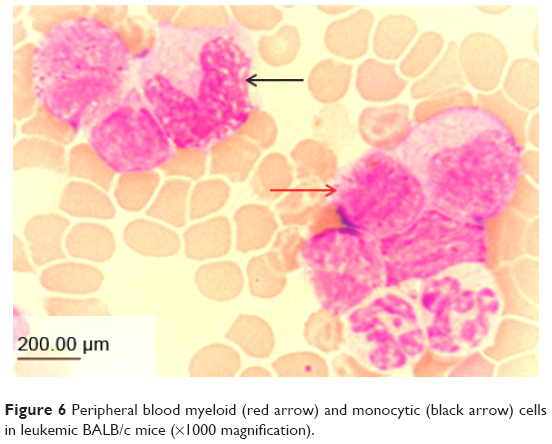 | Figure 6 Peripheral blood myeloid (red arrow) and monocytic (black arrow) cells in leukemic BALB/c mice (×1000 magnification). |
Histopathology
The spleen, as a secondary immune organ, with the high lymphocyte population, is the best organ to examine leukemia. Histopathologically, there was a massive and significant (P<0.05) proliferation of pleomorphic neoplastic cells in the spleen parenchyma of untreated leukemic mice, which led to the disappearance of the sinusoids. These neoplastic cells were characterized by large, irregular nuclei with clumped chromatin. The same lesions with minor differences were also found in NLC-treated animals. On the other hand, the spleen tissues of mice treated with ZER-NLC or ATRA demonstrated significant reduction (P<0.05) in leukemic cell population in comparison with the untreated normal control group (Figure 7 and Table S5). These findings are similar to those reported in previous BALB/c mice leukemia model studies.12,35
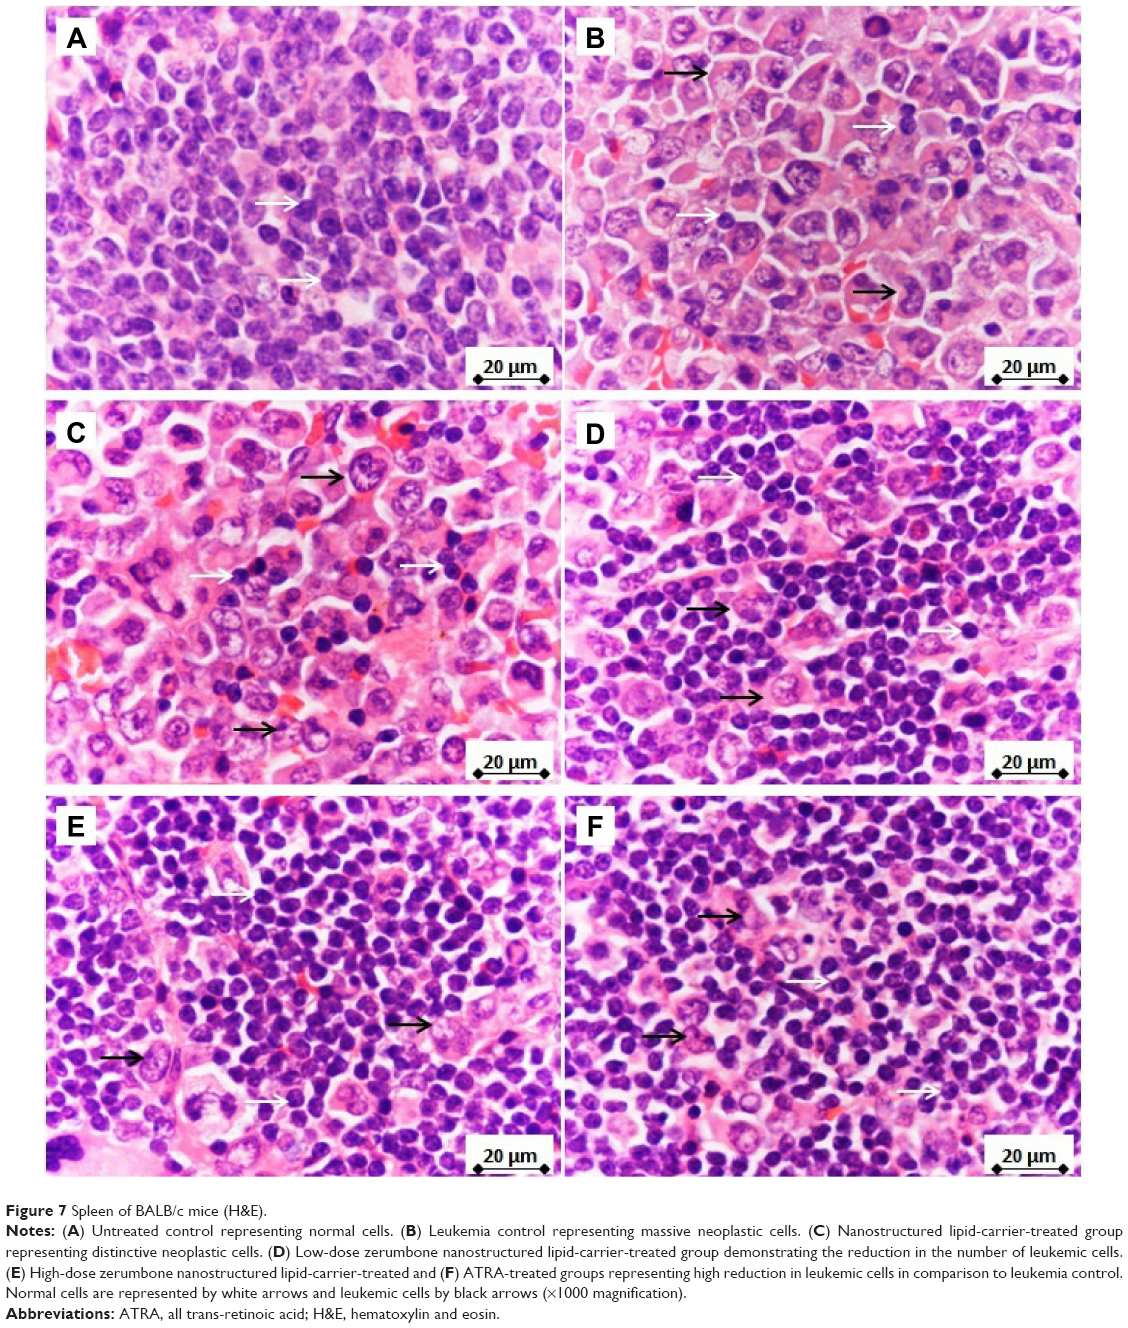 | Figure 7 Spleen of BALB/c mice (H&E). |
Transmission electron microscopy
TEM is a useful analytical tool in cell morphological studies in cancers. In this study, the spleen from untreated control mice showed normal cellular features. On the other hand, spleen from untreated leukemic mice showed pleomorphic cells, which were large in size, with markedly irregular surfaces and abnormal nuclear features. Treatment with ZER-NLC and ATRA produced apoptotic changes in the splenocytes characterized by margination of nuclear chromatin, nuclear lobulation, and cell membrane blebbing. Some apoptotic cells showed fragmented nucleus that formed apoptotic bodies (Figure 8).
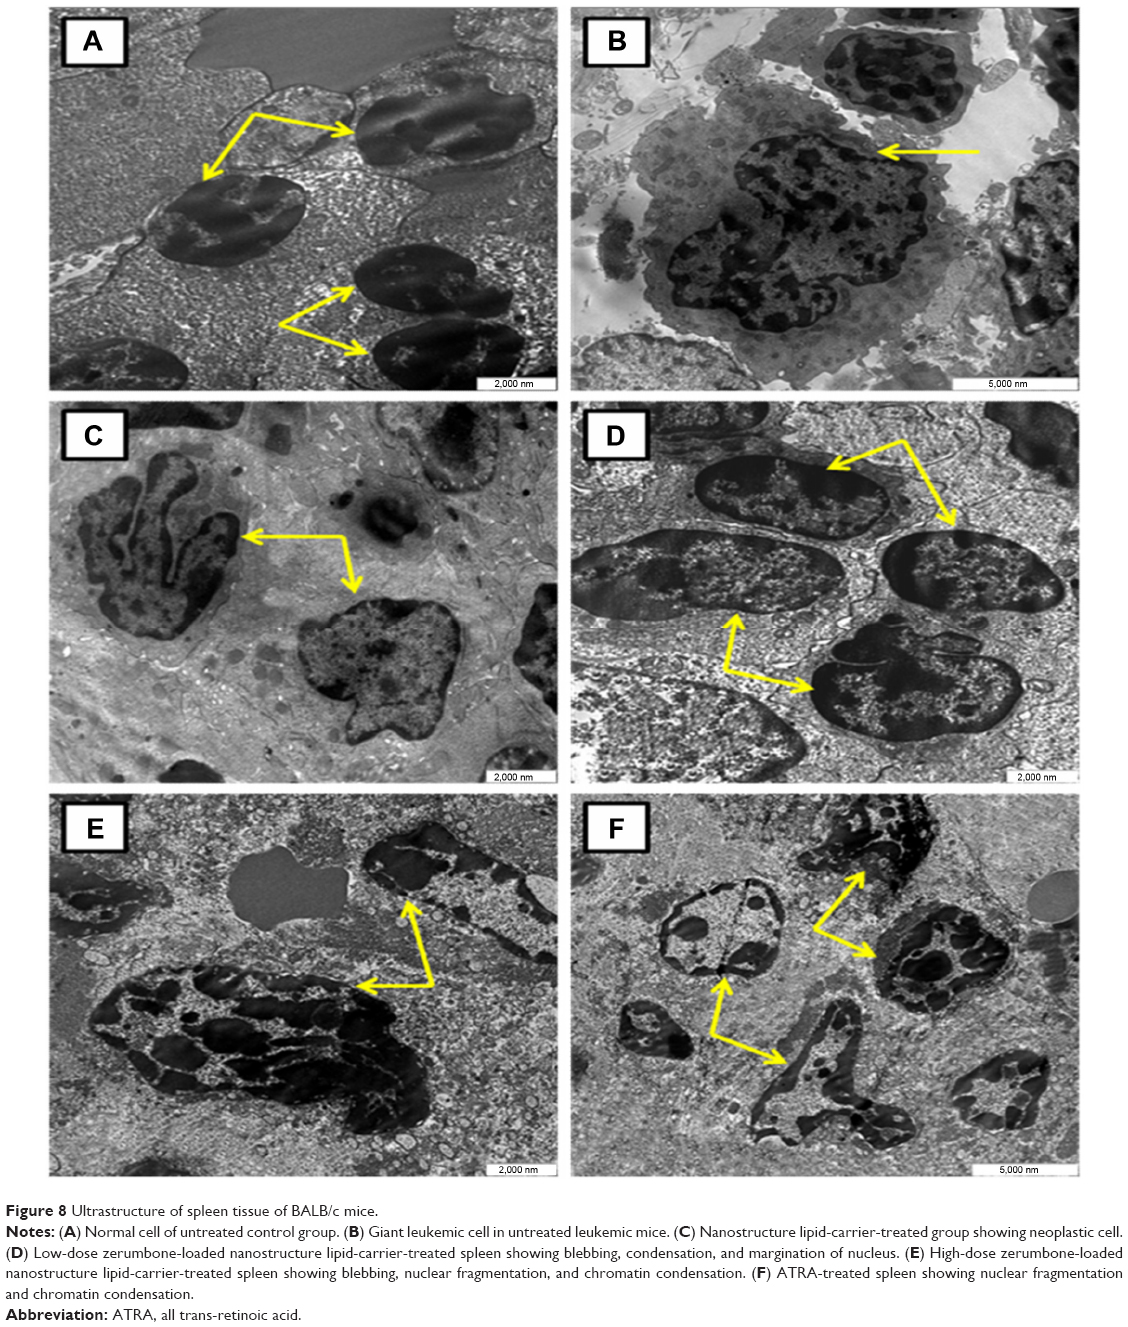 | Figure 8 Ultrastructure of spleen tissue of BALB/c mice. |
TUNEL assay
Spleen tissue sections of leukemic mice treated with ZER-NLC and ATRA showed significant (P<0.05) increase in the number of apoptotic cells as indicated by the high green fluorescence signal under microscopy. The spleen of untreated control and untreated leukemia groups showed nonsignificant (P>0.05) apparent apoptosis. Spleen tissues of leukemic mice treated with NLC alone showed the presence of only a few apoptotic cells. Fragmentation of DNA resulting from the induction of apoptosis signaling pathway is usually associated with effects of anticancer agents. Using the TUNEL assay, we showed that ZER-NLC, like the anticancer drug ATRA, had antileukemia activity by inducing significant (P<0.05) apoptosis of leukemic cells in the spleen of the BALB/c mice (Figure 9 and Table S6).
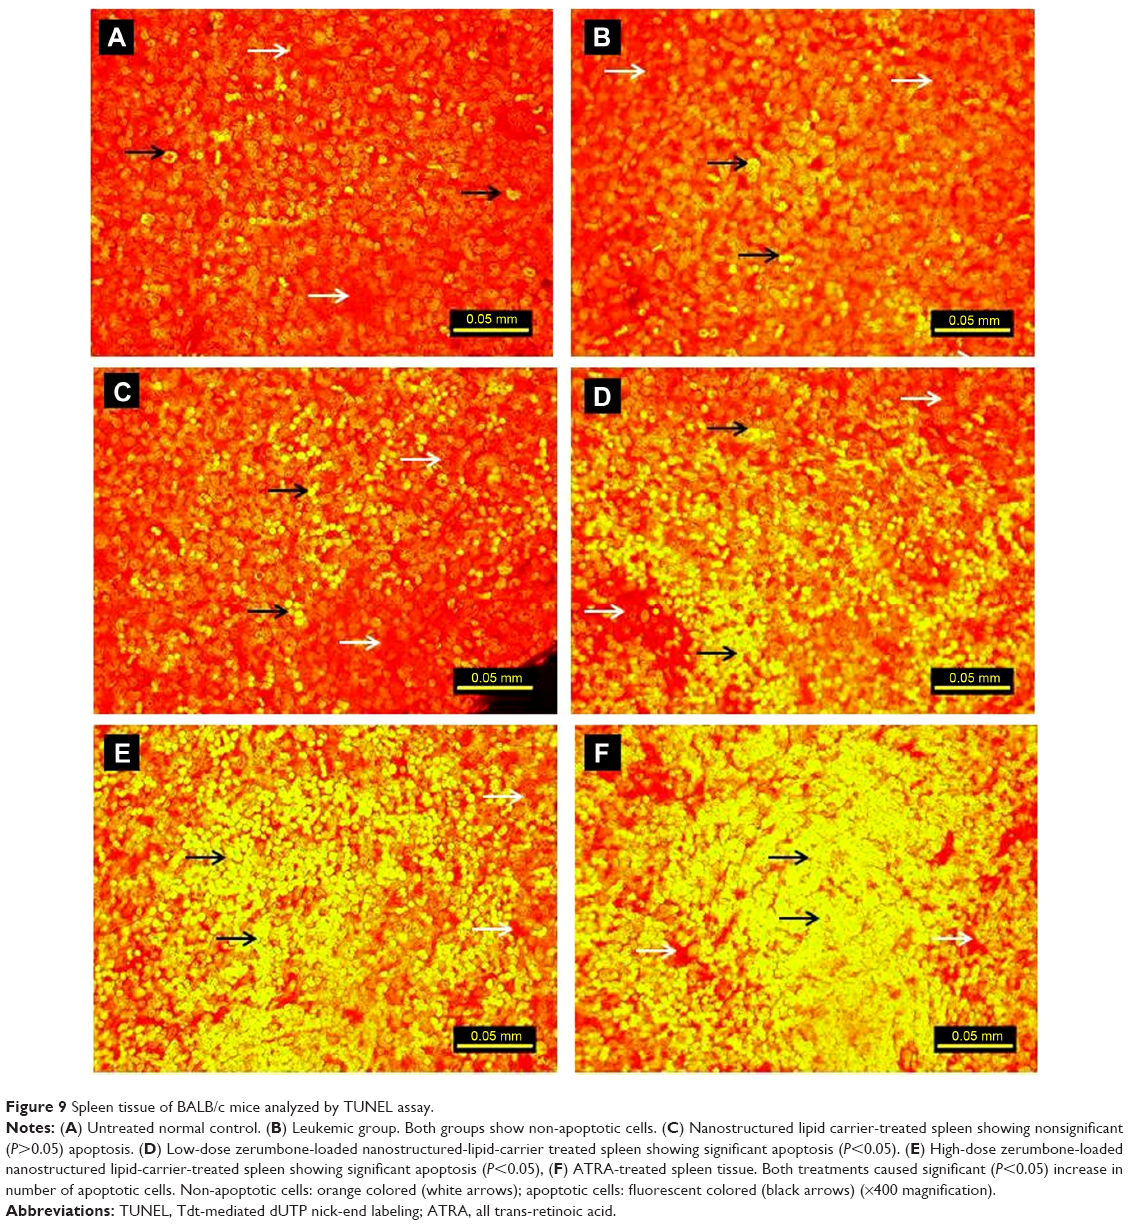 | Figure 9 Spleen tissue of BALB/c mice analyzed by TUNEL assay. |
Western blotting analysis
The expression of pro- and anti-apoptotic proteins in cells treated with anticancer drugs is complementary to the data obtained from other molecular and morphological studies. Using western blotting analysis, it was shown that there is a significant (P<0.05) increase in the expression of Bcl-2 protein in the splenocytes of leukemic and NLC-treated mice. The expression of Bax, Cyt-c, and PARP proteins was not significant (P>0.05) in untreated and NLC-treated leukemic murine spleen. However, when the leukemic mice were treated with ZER-NLC and ATRA, the spleen showed significant (P<0.05) increases in expression of Bax, Cyt-c, and PARP proteins, with significant (P<0.05) suppression of the Bcl-2 protein expression. Simultaneously, as a result of these treatments, the PARP protein cleaved from 116 kDa to 85 kDa in molecular weight. However, FasL, a type II transmembrane protein in the leukemic murine spleen, was not affected by the treatments (Figures 10 and 11; Table S7). Thus the mode of anti-apoptotic effect of ZER-NLC is both by stimulating pro-apoptotic and inhibiting anti-apoptotic proteins.
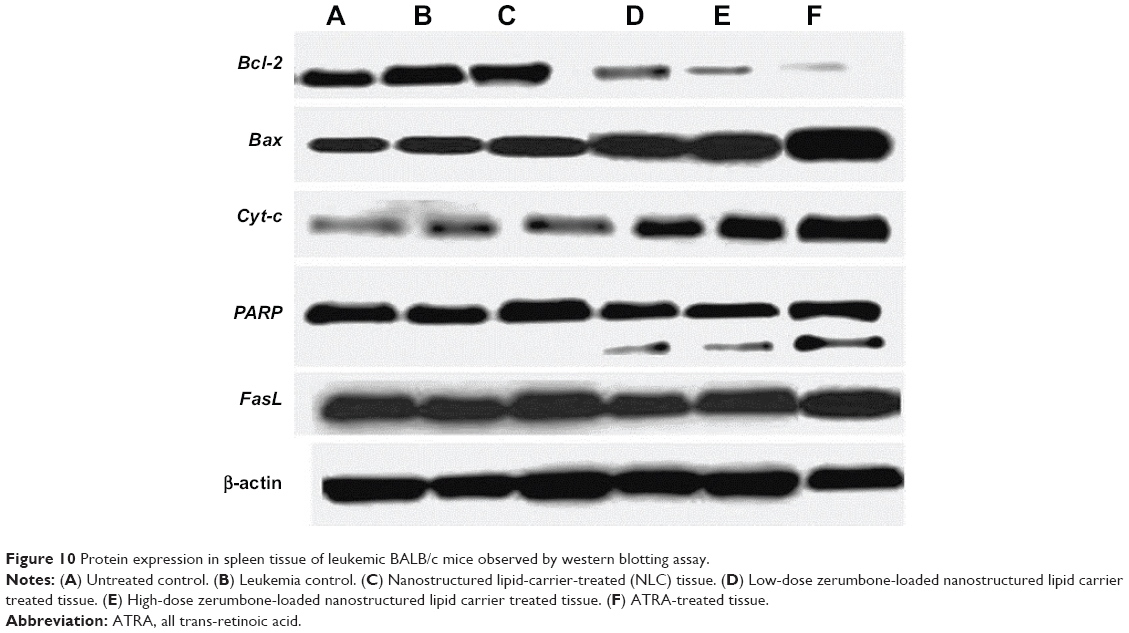 | Figure 10 Protein expression in spleen tissue of leukemic BALB/c mice observed by western blotting assay. |
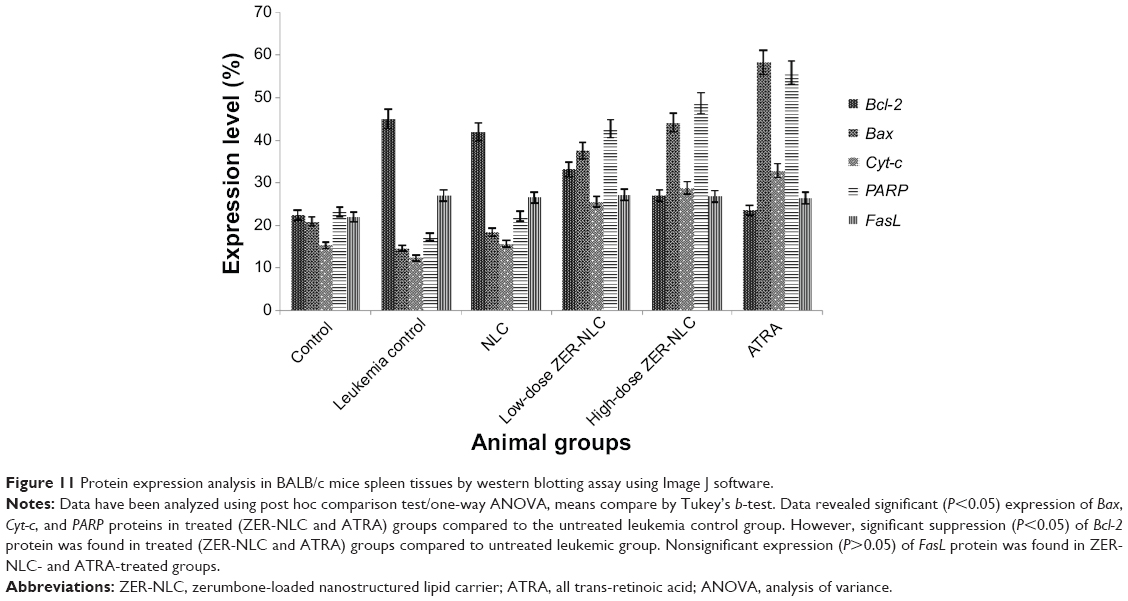 | Figure 11 Protein expression analysis in BALB/c mice spleen tissues by western blotting assay using Image J software. |
Relative expression levels of gene transcripts using RT-qPCR
RT-qPCR assay is considered the gold standard for gene expression analysis in various cells because of its reliability, accuracy, sensitivity, and fast quantification of results.36 This study is the first investigation on the mechanisms of the ZER-NLC-induced apoptosis in the WEHI-3B cells. Our study also determined gene transcription expression of some Bcl-2 family members. It was found that the expression of the Bcl-2 gene transcript was significantly (P<0.05) upregulated in the leukemia control and the NLC-treated mice group, while that of Bcl-2 was significantly (P<0.05) downregulated in ZER-NLC- and ATRA-treated murine splenocytes. In case of Bax, Cyt-c, and PARP, their relative gene transcript expressions were significantly (P>0.05) upregulated (P<0.05) in the ZER-NLC- and ATRA-treated mice (Figures 12 and 13; Table S8).
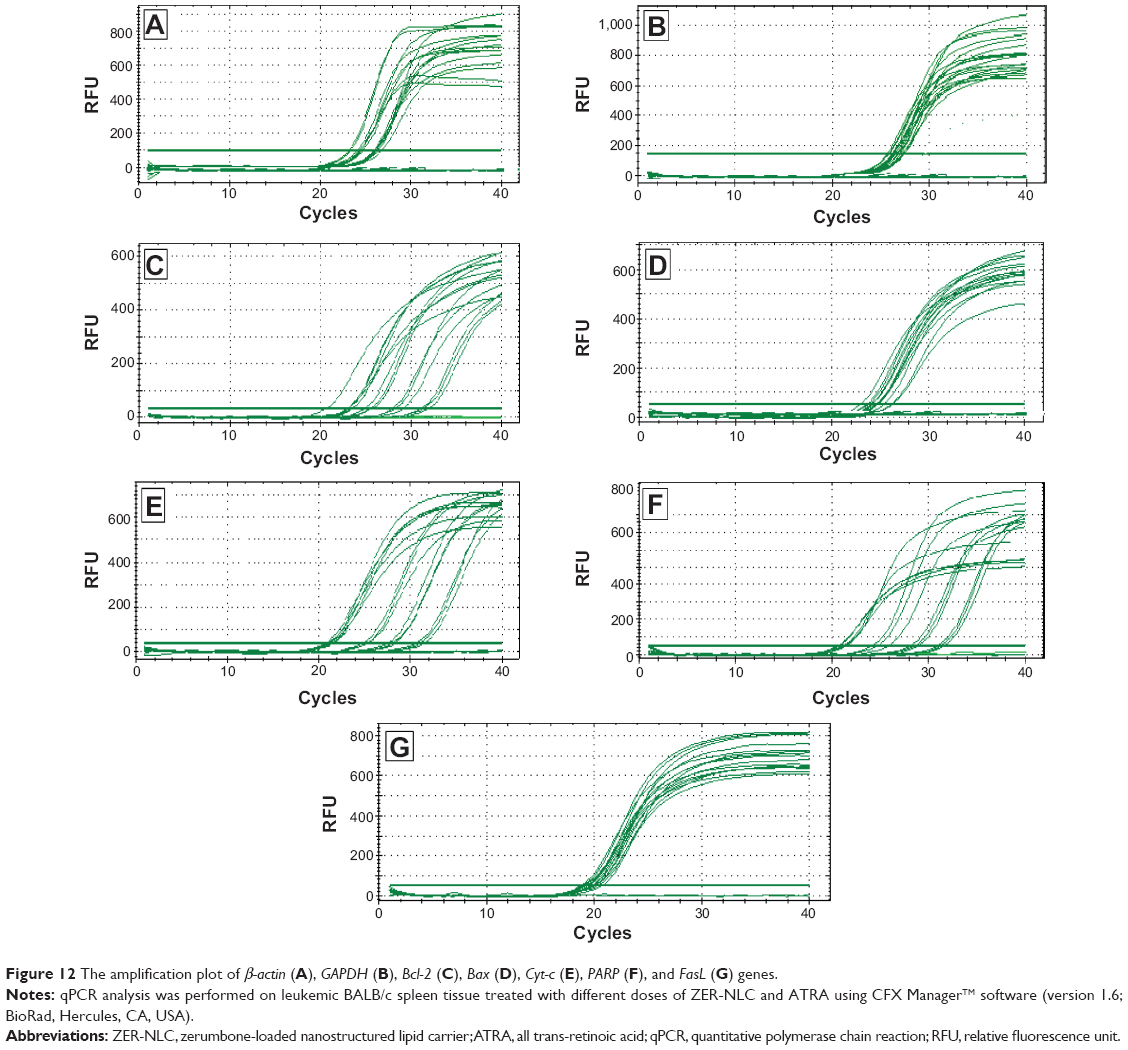 | Figure 12 The amplification plot of β-actin (A), GAPDH (B), Bcl-2 (C), Bax (D), Cyt-c (E), PARP (F), and FasL (G) genes. |
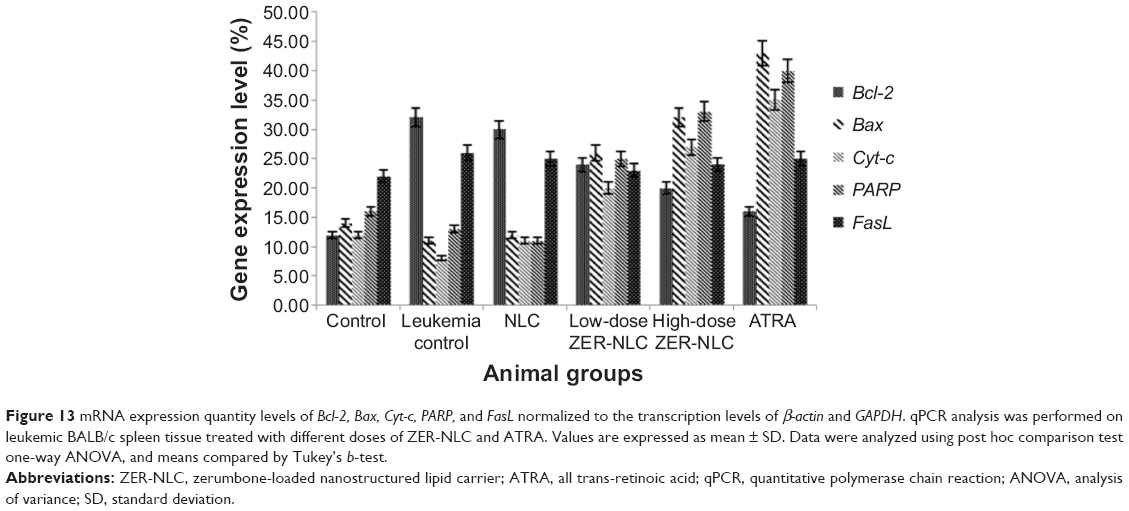 | Figure 13 mRNA expression quantity levels of Bcl-2, Bax, Cyt-c, PARP, and FasL normalized to the transcription levels of β-actin and GAPDH. qPCR analysis was performed on leukemic BALB/c spleen tissue treated with different doses of ZER-NLC and ATRA. Values are expressed as mean ± SD. Data were analyzed using post hoc comparison test one-way ANOVA, and means compared by Tukey’s b-test. |
Collectively, the results of these experiments show that the changes of anti-apoptosis and pro-apoptosis Bcl-2 family proteins are in a ratio that promotes apoptosis of leukemic cells, mediated primarily via an intrinsic mitochondrial pathway.32 Thus, this study unequivocally shows that ZER-NLC induces apoptosis of WEHI-3B cells through the mitochondrial-dependent pathway.
Conclusion
In conclusion, this study confirmed that ZER-NLC induces apoptosis of leukemic cells. The apoptotic effect of ZER-NLC on mice myelomonocytic leukemia is similar to that in human T-lymphoblastic leukemia: that is, through the activation of mitochondrial pathway of apoptosis. This study is a verification of ZER-NLC as new drug-delivery system for the treatment of cancers.
Acknowledgments
The authors wish to thank the Institute of Bioscience, Universiti Putra Malaysia (UPM), for kind help and support. They also wish to thank the Faculty of Veterinary Medicine, UPM, and DigiCare Behavioral Research for providing technical expertise for this study. This work was supported by the Ministry of Science, Technology and Innovation, Malaysia (Grant No. 5495308).
Disclosure
All authors report no conflict of interest in this work.
References
Alitheen NB, Yeap SK, Faujan NH, Ho WY, Beh BK, Mashitoh AR. Leukemia and therapy. Am J Immunol. 2012;7:54–61. | ||
Jemal A, Siegel R, Xu J, Ward E. Cancer statistics, 2010. CA Cancer J Clin. 2010;60:277–300. | ||
CFF. Cancer Facts & Figures 2012. Atlanta, GA: American Cancer Society; 2012. | ||
Bharali DJ, Siddiqui IA, Adhami VM, et al. Nanoparticle delivery of natural products in the prevention and treatment of cancers: current status and future prospects. Cancers. 2011;3:4024–4045. | ||
Pan MH, Ho CT. Chemopreventive effects of natural dietary compounds on cancer development. Chem Soci Rev. 2008;37:2558–2574. | ||
Abdelwahab SI, Sheikh BY, Taha MME, et al. Thymoquinone-loaded nanostructured lipid carriers: preparation, gastroprotection, in vitro toxicity, and pharmacokinetic properties after extravascular administration. Int J Nanomed. 2013;8:2163–2172. | ||
Ekambaram P, Sathali AH, Priyanka K. Solid lipid nanoparticles: a review. Sci Rev Chem Commun. 2012;2:80–102. | ||
Siddiqui IA, Adhami VM, Chamcheu JC, Mukhtar H. Impact of nanotechnology in cancer: emphasis on nanochemoprevention. Int J Nanomed. 2012;7:591–605. | ||
Peer D, Karp JM, Hong S, Farokhzad OC, Margalit R, Langer R. Nanocarriers as an emerging platform for cancer therapy. Nat Nanotechnol. 2007;2:751–760. | ||
Rahman HS, Rasedee A, Chee WH, et al. Zerumbone loaded nanostructured lipid carrier: preparation, characterization and antileukemic effect. Int J Nanomed. 2013;8:2769–2781. | ||
Rasedee A, Heshu SR, Ahmad Bustamam A, How CW, Swee KY, inventors; A composition for treating leukaemia. Malaysian patent PI2013700213. 2013. | ||
Mohan S, Abdul AB, Abdelwahab SI, et al. Typhonium flagelliforme inhibits the proliferation of murine leukemia WEHI-3 cells in vitro and induces apoptosis in vivo. Leuk Res. 2010;34:1483–1492. | ||
Van de Loosdrecht AA, Beelen RHJ, Ossenkoppele GJ, Broekhoven MG, Langenhuijsen MAC. A tetrazolium-based colorimetric MTT assay to quantitate human monocyte mediated cytotoxicity against leukemic cells from cell lines and patients with acute myeloid leukemia. J Immunol Meth. 1994;174:311–320. | ||
Park S-Y, Cho S-J, Kwon H-C, Lee K-R, Rhee D-K, Pyo S. Caspase-independent cell death by allicin in human epithelial carcinoma cells: involvement of PKA. Cancer Lett. 2005;224:123–132. | ||
Schloffer D, Horky M, Kotala V, Wȩsierska-G | ||
Błaszczyk A, Skolimowski J. Apoptosis and cytotoxicity caused by ethoxyquin salts in human lymphocytes in vitro. Food Chem. 2007;105:1159–1163. | ||
Luna LG. Manual of Histologic Staining Methods of the Armed Forces Institute of Pathology. 3rd ed. New York: Mc Graw-Hill; 1968. | ||
Hutheyfa A-S. Effects of Morinda citrifolia on N-methyl N-nitrosourea Induced Peripheral T Cell non-Hodgkin’s Lymphoma in Male Sprague Dawley Rats. Serdang: University Putra Malaysia; 2010. | ||
Abdelwahab SI, Abdul AB, Devi N, et al. Regression of cervical intraepithelial neoplasia by zerumbone in female Balb/c mice prenatally exposed to diethylstilboestrol: involvement of mitochondria-regulated apoptosis. Exp Toxicol Pathol. 2010;62:461–469. | ||
Qu L, Deng B, Zeng Y, Cao Z. Decreased expression of the Nkx2. 8 gene correlates with tumor progression and a poor prognosis in HCC cancer. Cancer Cell Int. 2014;14:28. | ||
Hajrezaie M, Golbabapour S, Hassandarvish P, et al. Acute toxicity and gastroprotection studies of a new schiff base derived copper (II) complex against ethanol-induced acute gastric lesions in rats. PLoS One. 2012;7:e51537. | ||
Xian M, Ito K, Nakazato T, et al. Zerumbone, a bioactive sesquiterpene, induces G2/M cell cycle arrest and apoptosis in leukemia cells via a Fas-and mitochondria-mediated pathway. Cancer Sci. 2007;98:118–126. | ||
Takada Y, Murakami A, Aggarwal BB. Zerumbone abolishes NF-κB and IκBα kinase activation leading to suppression of antiapoptotic and metastatic gene expression, upregulation of apoptosis, and downregulation of invasion. Oncogene. 2005;24:6957–6969. | ||
Matsuzawa-Nagata N, Takamura T, Ando H, et al. Increased oxidative stress precedes the onset of high-fat diet-induced insulin resistance and obesity. Metabolism. 2008;57:1071–1077. | ||
Shu P-Y, Chang S-F, Kuo Y-C, et al. Development of group-and serotype-specific one-step SYBR green I-based real-time reverse transcription-PCR assay for dengue virus. J Clin Microbiol. 2003;41:2408–2416. | ||
Mistry SN, Patel PK, Bharadia PD, Pandya VM, Modi DA. Novel drug delivery system for lipophilic agents: solid lipid nanoparticles. IJPI’s J Pharm Cosmetol. 2011;1:76–89. | ||
Cuong NV, Hsieh MF, Huang CM. Recent development in nano-sized dosage forms of plant alkaloid camptothecin-derived drugs. Recent Pat Anticancer Drug Discov. 2009;4:254–261. | ||
Mehta DK. British National Formulary. 52th ed. London, UK: Pharmaceutical Press; 2006. | ||
Martin S, Reutelingsperger C, McGahon AJ, et al. Early redistribution of plasma membrane phosphatidylserine is a general feature of apoptosis regardless of the initiating stimulus: inhibition by overexpression of Bcl-2 and Abl. J Exp Med. 1995;182:1545–1556. | ||
Ko JK, Leung WC, Ho WK, Chiu P. Herbal diterpenoids induce growth arrest and apoptosis in colon cancer cells with increased expression of the nonsteroidal anti-inflammatory drug-activated gene. Eur J Pharmacol. 2007;559:1–13. | ||
Park C, Moon D-O, Rhu C-H, et al. β-Sitosterol induces anti-proliferation and apoptosis in human leukemic U937 cells through activation of caspase-3 and induction of Bax/Bcl-2 ratio. Biol Pharm Bull. 2007;30:1317–1323. | ||
Rahman SR, Abdullah R, Ahmad BA, et al. Zerumbone-loaded nanostructured lipid carrier induces G2/M cell cycle arrest and apoptosis via mitochondrial pathway in human lymphoblastic leukemia cell line. Int J Nanomed. 2014;9:527–538. | ||
Green DR. Apoptotic pathways: paper wraps stone blunts scissors. Cell. 2000;102:1–4. | ||
Tsou M-F, Peng C-T, Shih M-C, et al. Benzyl isothiocyanate inhibits murine WEHI-3 leukemia cells in vitro and promotes phagocytosis in BALB/c mice in vivo. Leuk Res. 2009;33:1505–1511. | ||
Lin J-P, Yang J-S, Lu C-C, et al. Rutin inhibits the proliferation of murine leukemia WEHI-3 cells in vivo and promotes immune response in vivo. Leuk Res. 2009;33:823–828. | ||
Derveaux S, Vandesompele J, Hellemans J. How to do successful gene expression analysis using real-time PCR. Methods. 2010;50:227–230. |
 dek J. Induction of cell cycle arrest and apoptosis in human cervix carcinoma cells during therapy by cisplatin. Cancer Detect Prev. 2003;27:481–493.
Supplementary materials
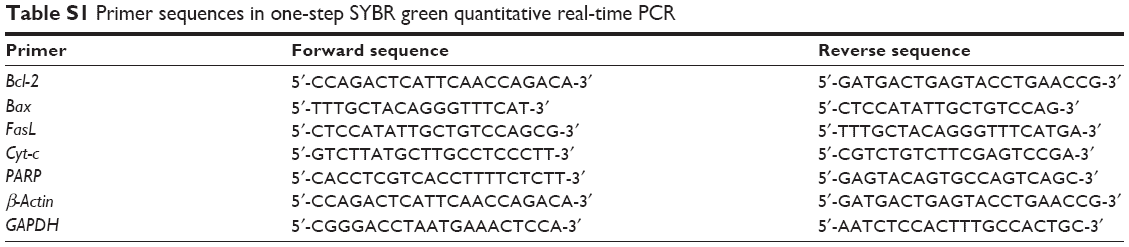 | Table S1 Primer sequences in one-step SYBR green quantitative real-time PCR |
 | Table S2 Flow cytometric analysis of WEHI-3B cells treated with ZER-NLC |
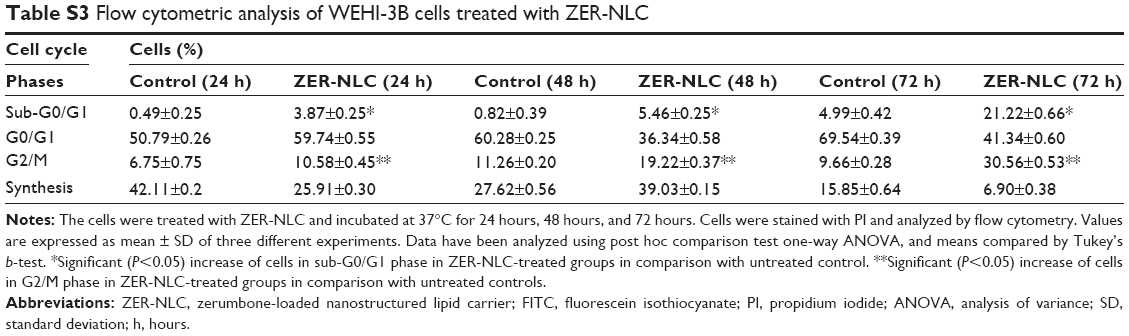 | Table S3 Flow cytometric analysis of WEHI-3B cells treated with ZER-NLC |
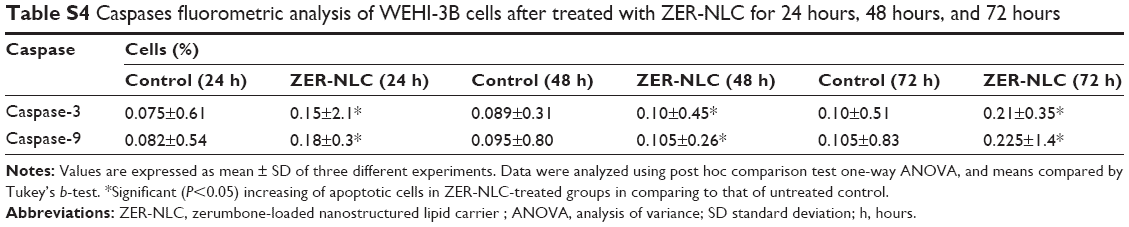 | Table S4 Caspases fluorometric analysis of WEHI-3B cells after treated with ZER-NLC for 24 hours, 48 hours, and 72 hours |
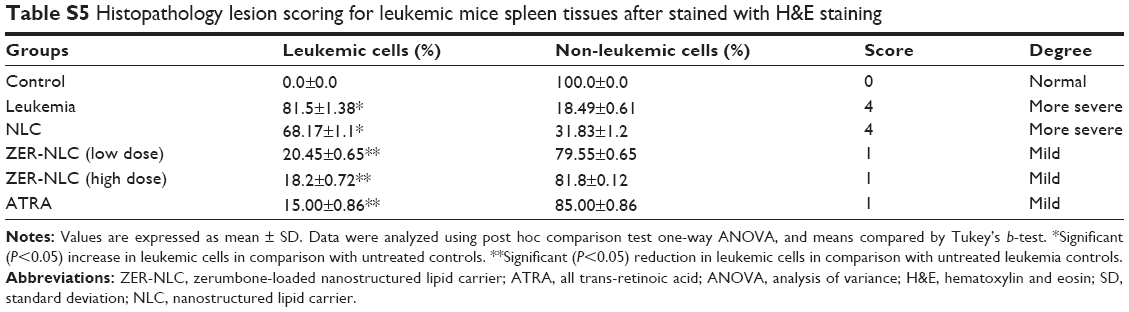 | Table S5 Histopathology lesion scoring for leukemic mice spleen tissues after stained with H&E staining |
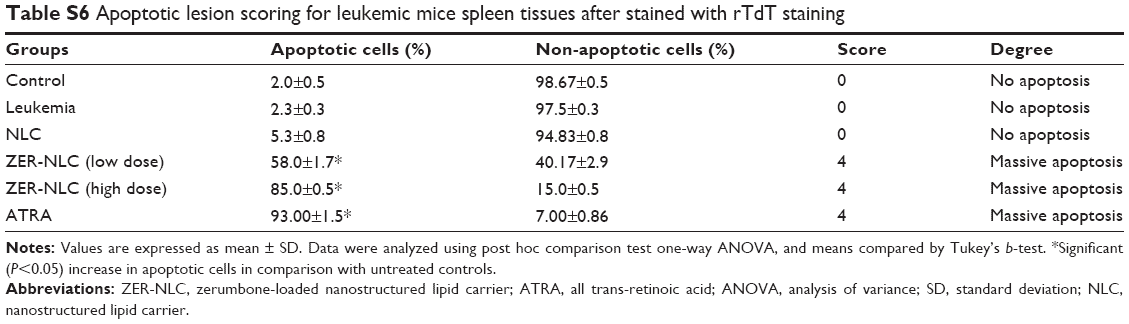 | Table S6 Apoptotic lesion scoring for leukemic mice spleen tissues after stained with rTdT staining |
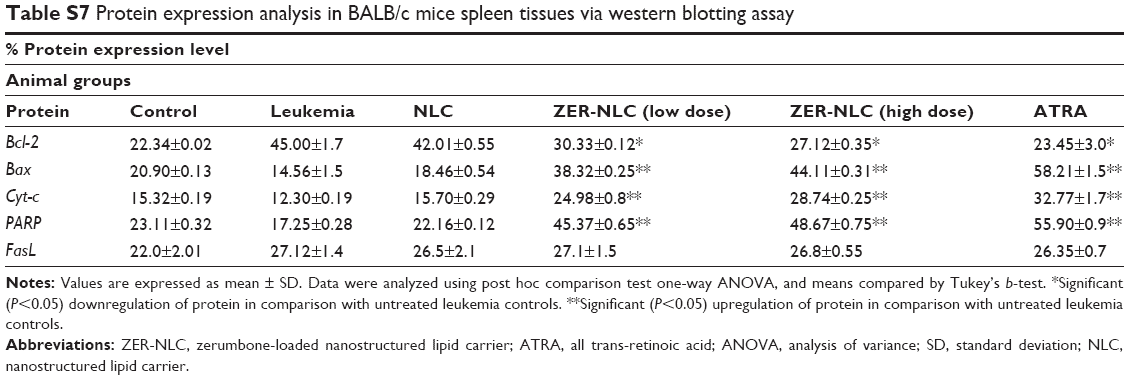 | Table S7 Protein expression analysis in BALB/c mice spleen tissues via western blotting assay |
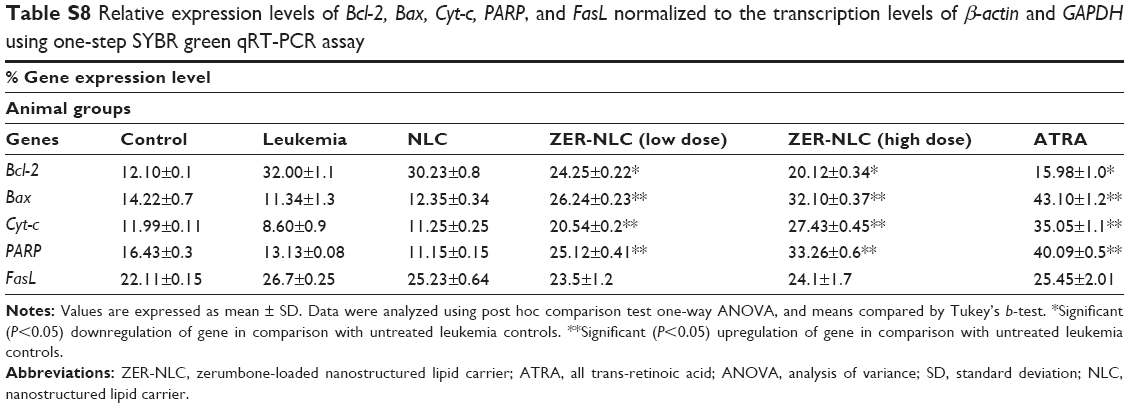 | Table S8 Relative expression levels of Bcl-2, Bax, Cyt-c, PARP, and FasL normalized to the transcription levels of β-actin and GAPDH using one-step SYBR green qRT-PCR assay |
 © 2015 The Author(s). This work is published and licensed by Dove Medical Press Limited. The
full terms of this license are available at https://www.dovepress.com/terms
and incorporate the Creative Commons Attribution
- Non Commercial (unported, 3.0) License.
By accessing the work you hereby accept the Terms. Non-commercial uses of the work are permitted
without any further permission from Dove Medical Press Limited, provided the work is properly
attributed. For permission for commercial use of this work, please see paragraphs 4.2 and 5 of our Terms.
© 2015 The Author(s). This work is published and licensed by Dove Medical Press Limited. The
full terms of this license are available at https://www.dovepress.com/terms
and incorporate the Creative Commons Attribution
- Non Commercial (unported, 3.0) License.
By accessing the work you hereby accept the Terms. Non-commercial uses of the work are permitted
without any further permission from Dove Medical Press Limited, provided the work is properly
attributed. For permission for commercial use of this work, please see paragraphs 4.2 and 5 of our Terms.