Back to Journals » Pharmacogenomics and Personalized Medicine » Volume 14
Analysis of Very Important Pharmacogenomics Variants in the Chinese Lahu Population
Authors Cheng Y, Li Q, Yang X, Ding H, Chen W, Dai R, Zhang C
Received 11 June 2021
Accepted for publication 7 September 2021
Published 1 October 2021 Volume 2021:14 Pages 1275—1289
DOI https://doi.org/10.2147/PGPM.S324410
Checked for plagiarism Yes
Review by Single anonymous peer review
Peer reviewer comments 4
Editor who approved publication: Dr Martin H Bluth
Yujing Cheng,1,* Qi Li,1,* Xin Yang,1 Heng Ding,2 Wanlu Chen,1 Run Dai,1 Chan Zhang1
1Department of Blood Transfusion, First People’s Hospital of Yunnan, Kunming City, 650021, Yunnan Province, People’s Republic of China; 2Blood Station of Honghe State Center, Honghe Prefecture City, 661100, Yunnan Province, People’s Republic of China
*These authors contributed equally to this work
Correspondence: Chan Zhang
First People’s Hospital of Yunnan, #157 Jinbi Road, Kunming, Yunnan, 650021, People’s Republic of China
Email [email protected]
Background: Genetic polymorphism, obviously, has a potential clinical role in determining differences in drug efficacy; however, there are no reports about the pharmacogenomic information of the Lahu population. Therefore, our research aimed to screen the genotypic frequencies of the very important pharmacogenomics (VIP) mutations and determined the differences between Lahu and the other 11 populations.
Methods: Agena MassARRAY (AgenaMassARRAY) single nucleotide polymorphism (SNP) genotyping technique was used to detect 81 VIP mutations of pharmacogenomics genes in Lahu, and their genotypic frequencies were compared with the other major 11 populations. Chi-square tests were used to identify different loci among these populations. Finally, the genetic structure and pairwise Fst values of Lahu and the other 11 populations were analyzed.
Results: We found that the distribution of allele frequencies within different pharmacogenes in Lahu showed significantly different with other populations. Additionally, the pairwise F-statistics (Fst) values and genetic structure revealed the variants in the Lahu population as well were mostly related to the Han Chinese in Beijing, China (CHB) and the Japanese population in Tokyo, Japan (JPT) genetically.
Conclusion: This study will provide a theoretical basis for safe drug use and help to establish the appropriate individualized treatment strategies in the Lahu population.
Keywords: pharmacogenomics, population genetics, Lahu population, VIP variants
Introduction
Pharmacogenomics is an organic combination of molecular pharmacology and gene function. Researchers use information from the entire genome to identify and describe the genetic basis and genetic influence of patients on drug therapy. As the most common type of genetic variation among people, single nucleotide polymorphisms (SNPs) constitute the basis of pharmacogenetics, which means the monogenic variants, which alter the drug response. Most importantly, the SNPs of drug metabolic enzymes and drug transporter genes are important determinants of variation among individual drug metabolites and of human therapeutic responses and disease susceptibility.1,2 What is more, individual differences in drug reactions and side effects are a major challenge in clinical pharmacology. Therefore, identifying these polymorphisms and understanding how they affect drug response and genetic disease trends are the key to drug genetics research.3 Pharmacogenomics can enhance the outcome of treatment by adopting pharmacogenomic testing to maximize drug efficacy and minimize the risk of serious adverse events.4 The most well-known pharmacogenes are cytochrome P450 genes, encoding Phase 1 cytochrome P450 (CYP) or Phase 2 drug-metabolizing enzymes, transporters, drug targets, or human leukocyte antigen (HLA) alleles and predicting drug efficacy or toxicity.5 CYP2C19*2 (rs4244285), CYP2C19*3 (rs4986893), and CYP2C19*17 (rs12248560) have been studied commonly. One study showed that CYP2C19*2 is the most common variant of the reduced function allele, accounting for more than 95% of the African whites and blacks, and more than 75% of the Asian population.6 Yi et al found that there was at least one allele with impaired CYP2C19 function, and the main prognostic risk was three times higher in clopidogrel carriers than in non-carriers,7 suggesting that the failure of clopidogrel antiplatelet drug therapy may be related to CYP2C19 gene mutation. These very important pharmacogenomics (VIP) genes have been summarized in the Pharmacogenomics Knowledge Base (PharmGKB; http://www.pharmgkb.org). A South Korean survey showed that pre-emptive genotyping can help many people avoid adverse drug reactions, suggesting that pharmacogenomics is promising.8 Exploring the VIP variants among different races is an acceptable way to find suitable drugs for patients or specific populations.
Lahu, distributed in 31 provinces, autonomous regions and municipalities directly under the Central Government in China, is an ancient ethnic group evolved from the Ancient Qiang people in Gansu and Qinghai provinces, whose population in total is 485,966. In the process of ethnic development, Lahu moved to the current Yunnan province and Southeast Asia, such as Myanmar and Thailand. In Yunnan, they mainly lived in Lancang and Shuangjiang counties near the border, with nearly 447,600 people, accounting for 98.66% of the total population of the Lahu ethnic group.9 The Lahu have not only their own unique genetic characteristics but also their own lifestyle patterns, particularly in terms of traditional practices related to the use of alcohol.10 However, the pharmacogenomic VIP variants in Lahu people are seldom reported. The study of drug genome in rare and population-specific mutation groups, such as the Lahu, is of great significance to the realization of individualized drug therapy and the development of new drugs. We hope our findings could conduce to the supplement of pharmacogenomic data and support the clinical application of personalized medication in the Lahu population.
In this study, the genotype frequencies of 81 VIP variants in the Lahu population and 11 major HapMap populations were compared and analyzed statistically. Finally, Fst pairwise comparisons and Bayesian clustering analysis were applied to analyze the Lahu population genetics.
Materials and Methods
Subjects
We randomly collected a sample of 100 unrelated Lahu healthy adults aged 25–55 years from the Department of Physical examination, Yunnan First People’s Hospital and drew blood samples. The participants, who must reach several detailed inclusion criteria, were considered to be eligible. What is more, all individuals were at least three generations of Lahu paternal ancestor without any known ancestry from other ethnicities. The exclusion criteria were as follows: with the presence of chronic cancer, contagious disease, drugs or alcohol addiction, with severe heart, liver, and kidney dysfunction, immune disorders, pregnancy, or lactation. We have obtained informed consent and blood samples from the volunteers according to the study protocol approved by the Ethics Committee of the Yunnan First People’s Hospital. The sample size and the proportion were determined through G*Power 3.1.9.2 software.11
The study was approved by the Ethics Committee of the Yunnan First People’s Hospital (YYLH054) and was performed in accordance with the Declaration of Helsinki. Written informed consent was obtained from all volunteers in the study.
Selection and Genotyping of VIP Variants
In the current study, we screened the genetic variants related to VIP variants from the PharmGKB database (https://www.pharmgkb.org/) with the minor allele frequency (MAF) > 0.05, Hardy–Weinberg equilibrium (HWE) > 0.05, and call rate > 0.95. The loci that could not be designed were excluded. Ultimately, a total of 81 genetic variants located in 45 genes were selected. The fresh blood samples were stored at −80°C. According to the manufacturer’s standard procedure, genomic DNA was isolated using GoldMag-Mini Genomic DNA Purification Kit (GoldMag Ltd. Xi’an, China). The DNA concentration and purity were performed using Nanodrop 2000.
(Thermo Scientific, Waltham, MA, USA) and agarose electrophoresis. The MassARRAY Assay Design 3.0 software (San Diego, California, USA) was applied to design amplification primers for the selected variants.12 The Agena MassARRAY RS1000 (SanDiego, California, USA) was utilized to perform genotype following the manufacturer's protocol (San Diego, California, USA). Finally, we used Agena Typer 4.0 software for data management and analysis.3,13
Statistical Analyses
Microsoft Excel and SPSS 19.0 statistical packages (SPSS, Chicago, IL) were applied to perform HWE and chi-square tests. HWE was assessed using chi-square test and p < 0.05 indicated the disequilibrium of HWE. All genotype frequencies of variants in the Lahu population and the other 11 populations from HapMap (http://hapmap.ncbi.nlm.nih.gov) were calculated and compared using the chi-square test. The other 11 people included the Han Chinese in Beijing, China (CHB); Gambian in Western Divisions, The Gambia (GWD); the Japanese population in Tokyo, Japan (JPT); British in England and Scotland (GBR); a northwestern European population (CEU); the Tuscan people of Italy (TSI); the Luhya people in Webuye, Kenya (LWK); African ancestry in the southwestern USA (ASW); Mexican Ancestry in Los Angeles, California (MXL); the Gujarati Indians in Houston, Texas, USA (GIH); Indian Telugu in the UK (ITU). All p values in this study were two-sided. Then, we reduced the false discovery rate of multiple testing by Bonferroni’s multiple comparison adjustment. When p values were less than 0.05/(81*11), it was considered to be statistically significant.
F-statistics (Fst) and structure analyses were usually adopted in population genetic studies. In this study, the Arlequin v3.5 program was used to calculate global Fst along with the pairwise Fst among all the populations using the loci, which were polymorphic at the 5% level.14 Therefore, we could estimate the pairwise distances between the populations. The diversity of population genetic structures was analyzed through Structure (version 2.3.4) software in 12 populations.15,16
Results
Identification of VIP Variants
In this study, 81 genetic variants were selected for investigation in the Lahu population, which was based on previously published VIP variants from the PharmGKB database. The VIP variants were distributed in 45 genes. Basic characteristics of these selected variants in the Lahu population are listed in Table 1.
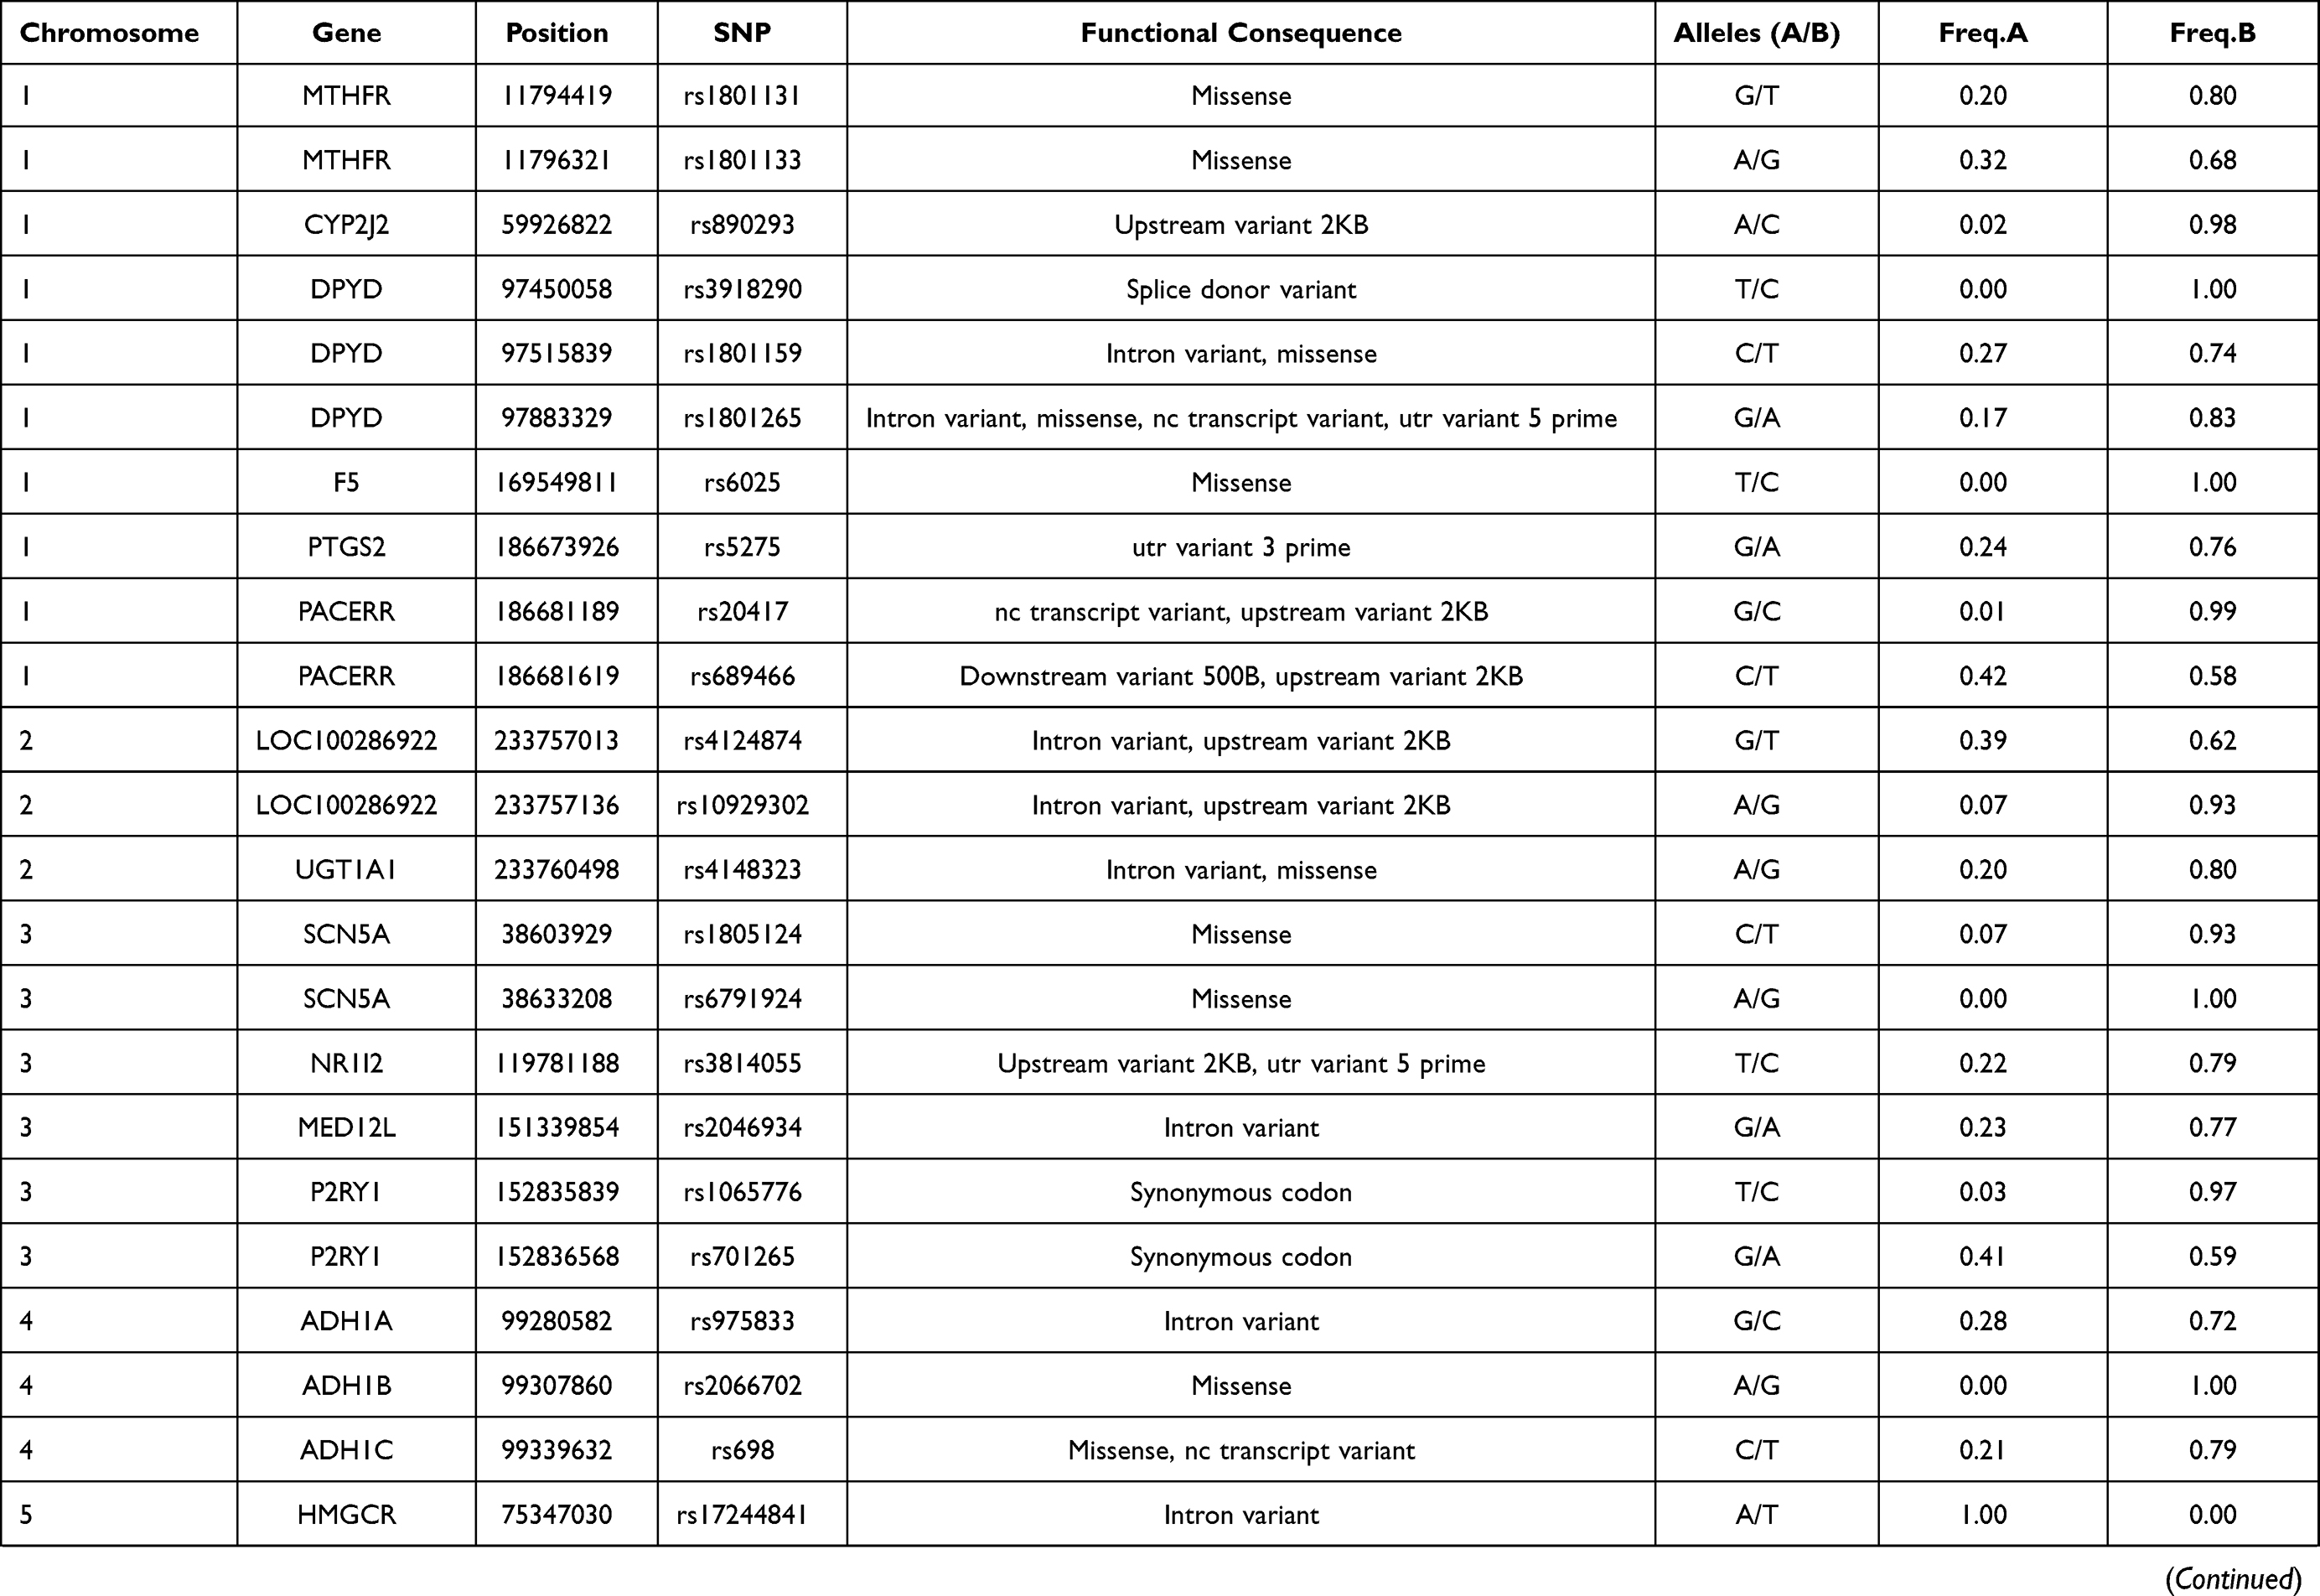 | 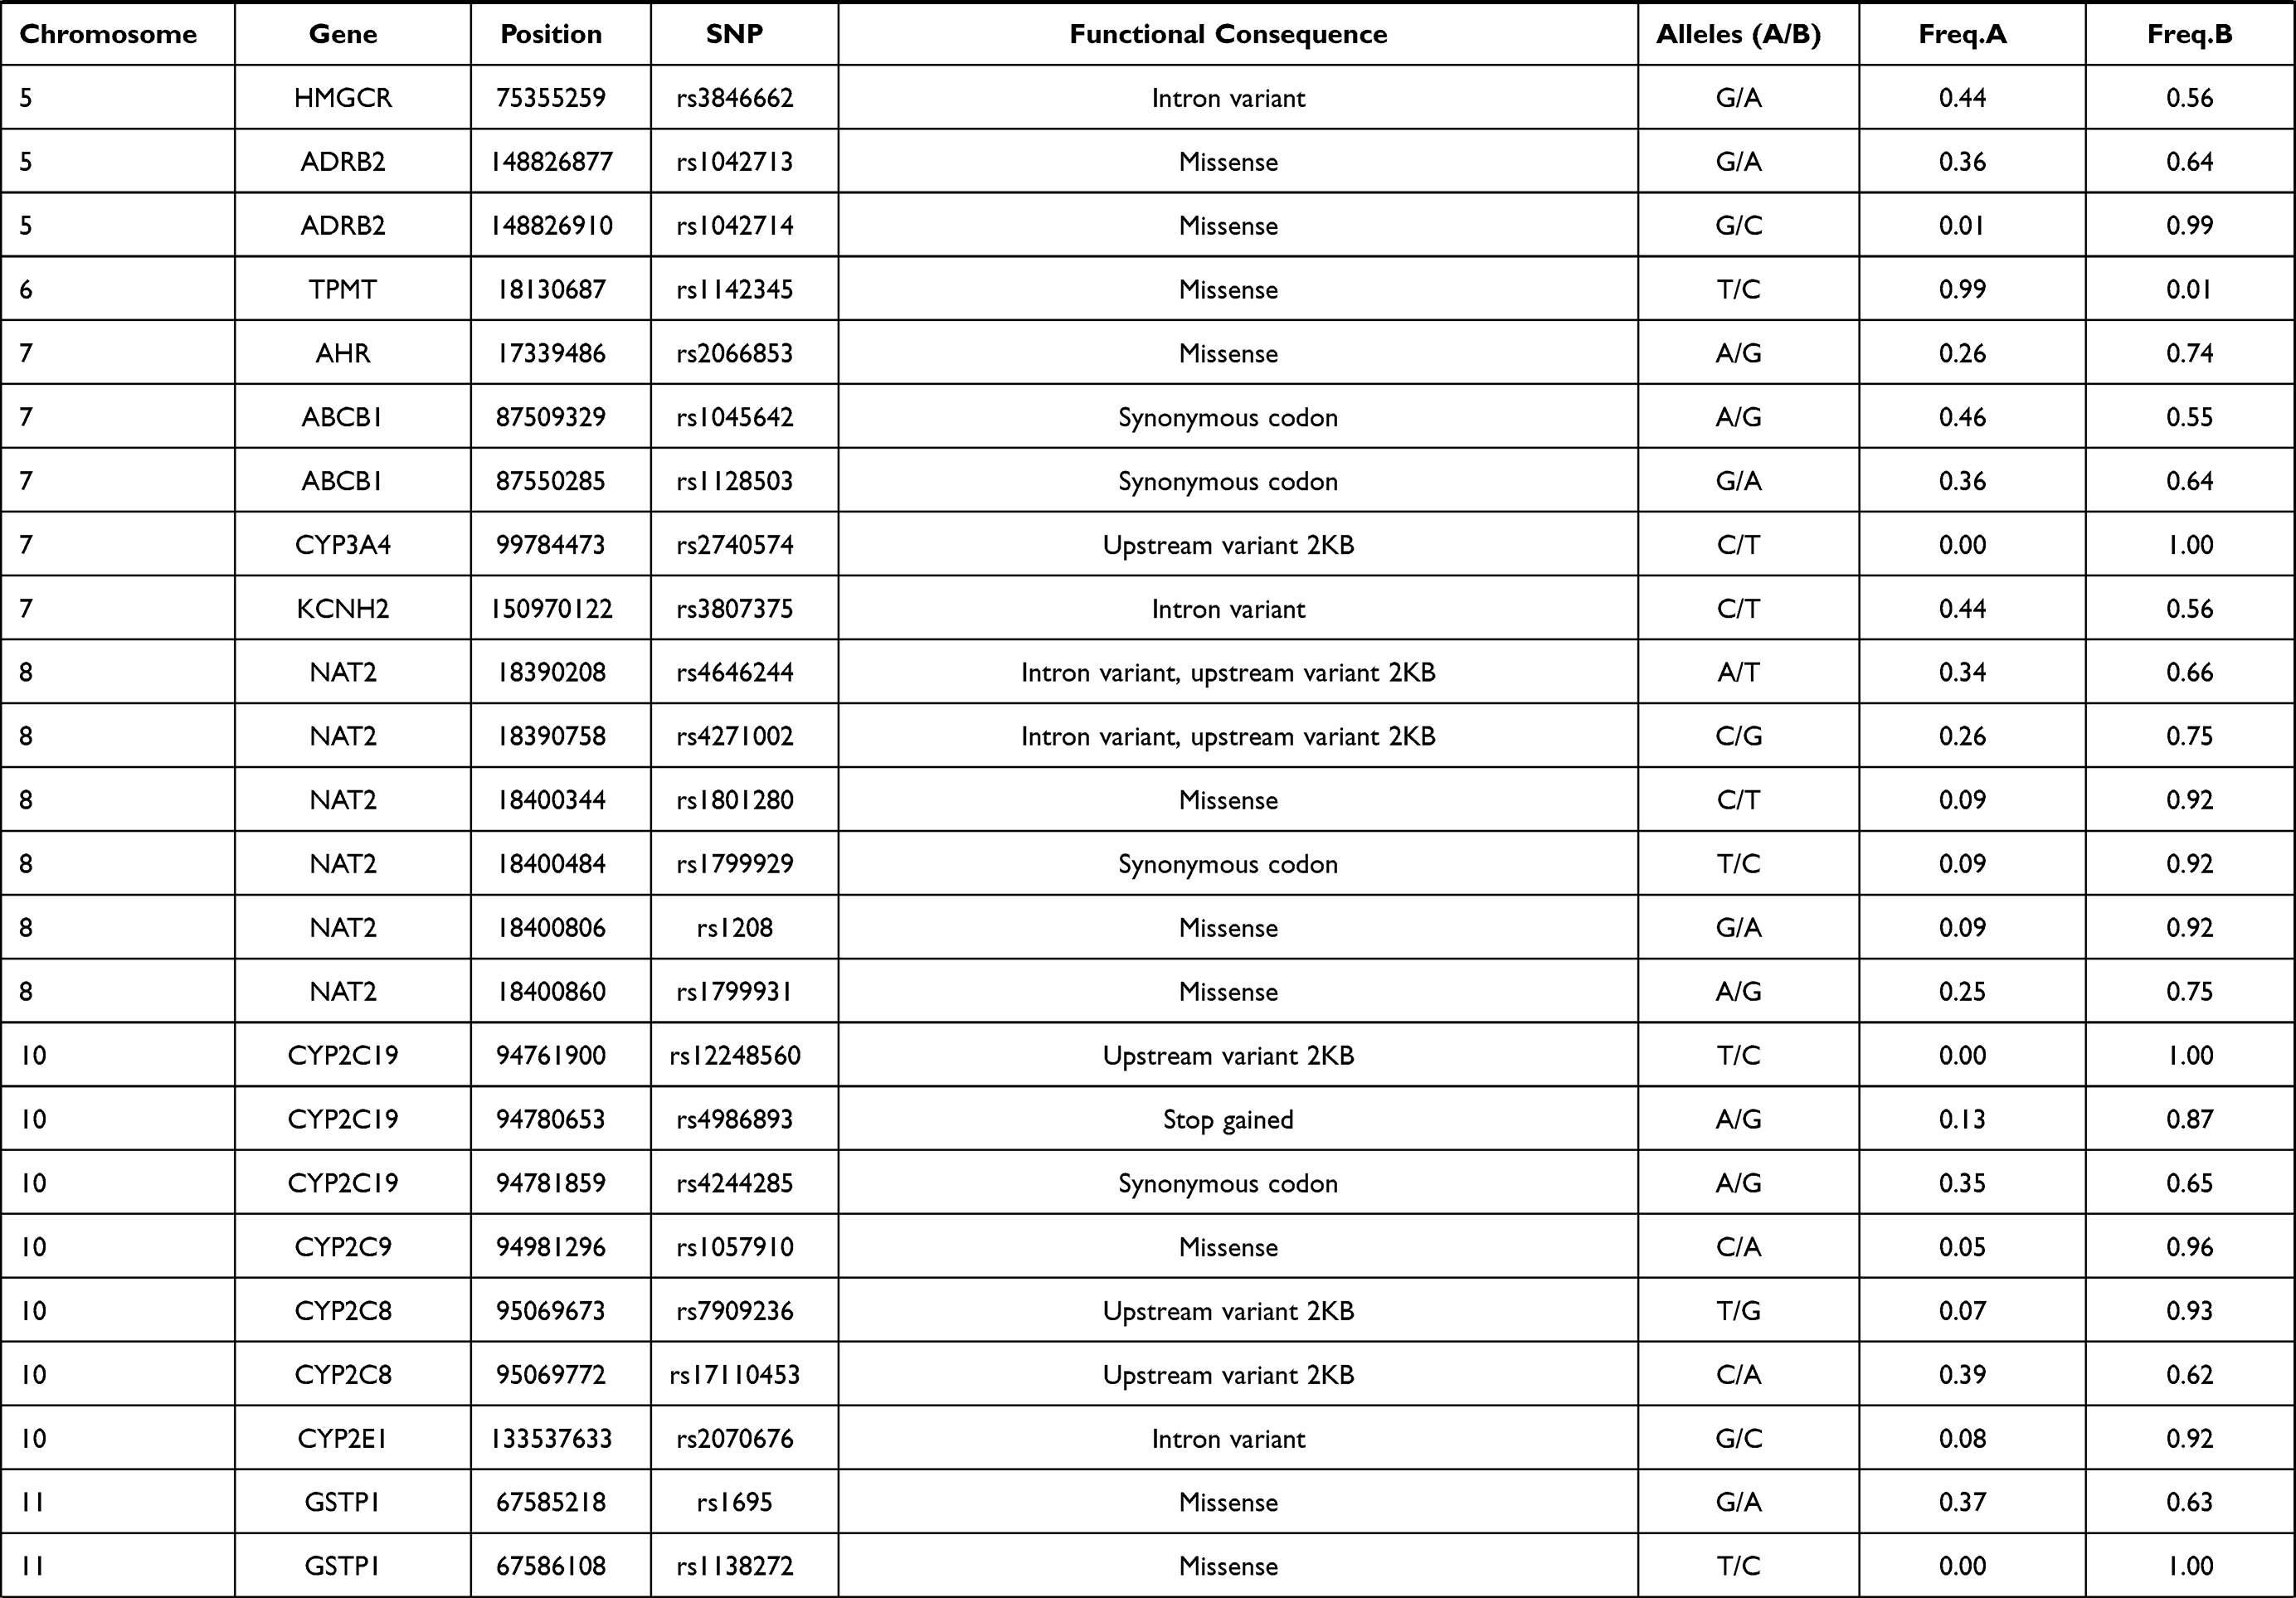 | 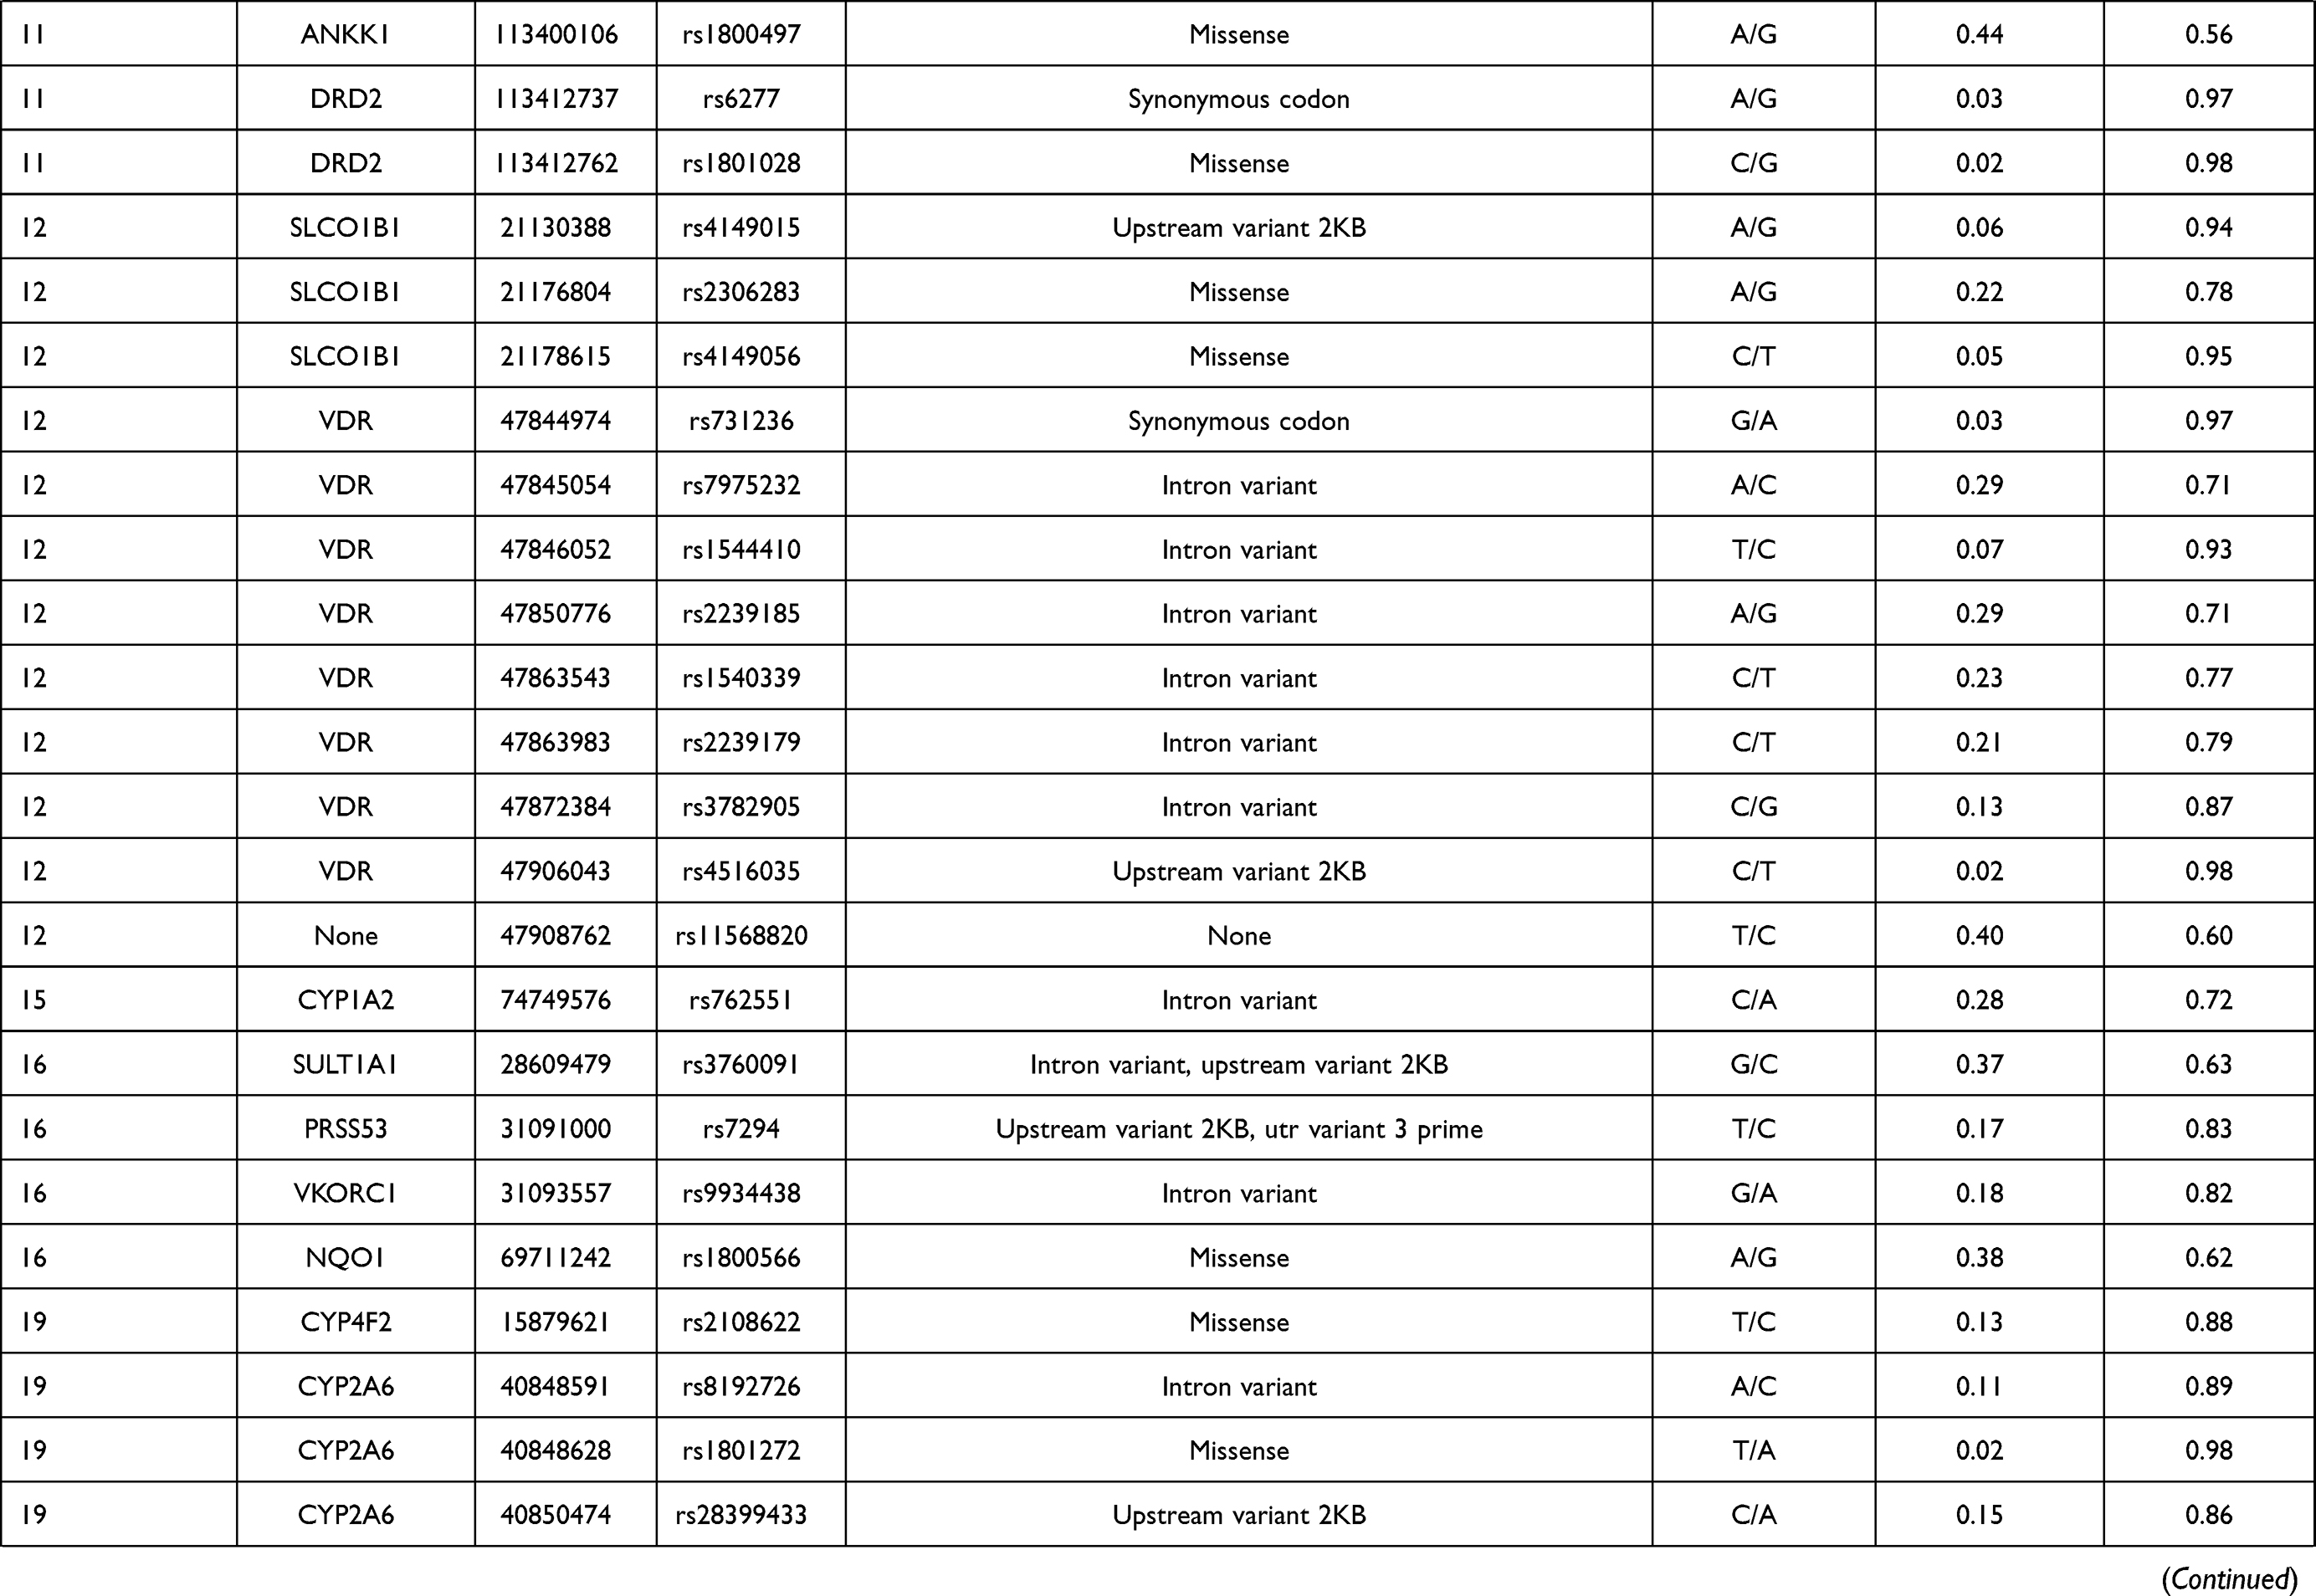 | 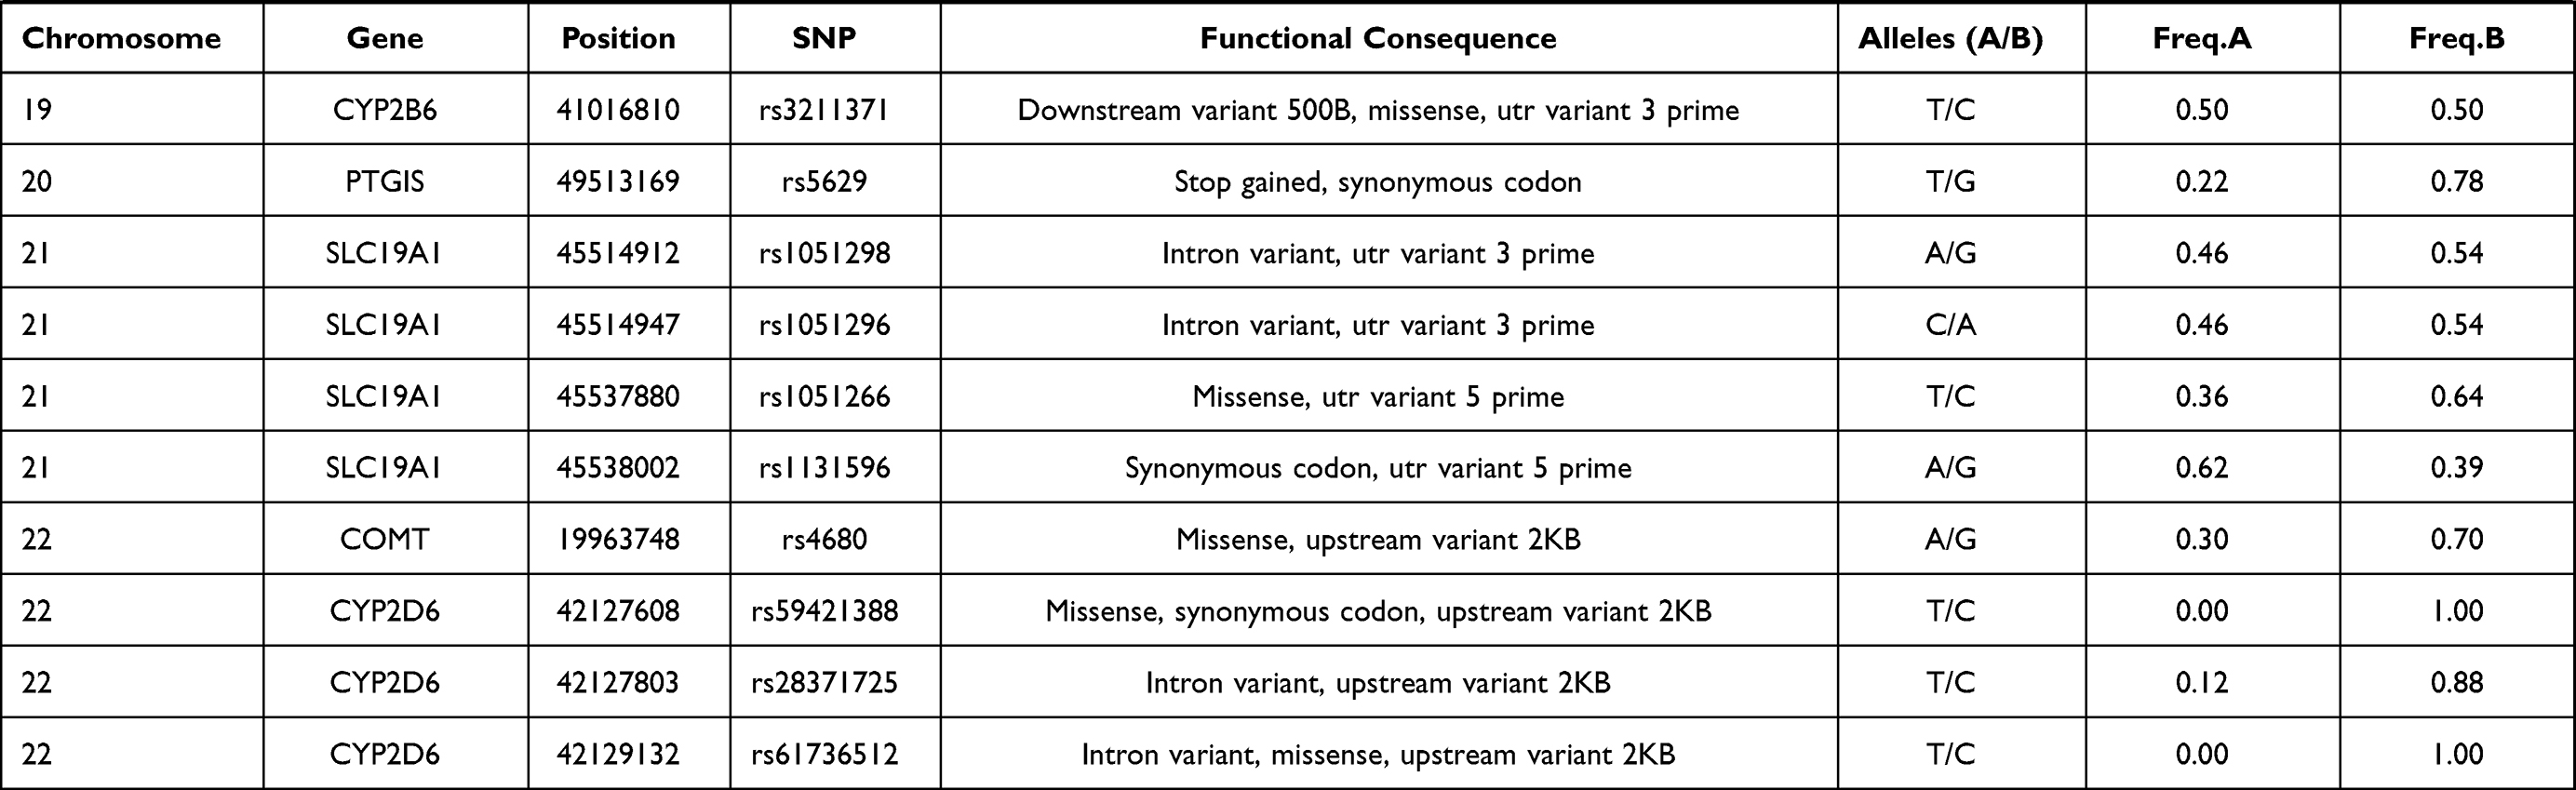 |
Table 1 Basic Characteristics Selected Variants in the Lahu |
Statistical Analyses
Chi-square test was performed for significant difference assessment on genotype frequency distribution of 81 loci among Lahu people and the other 11 populations from HapMap project, which are demonstrated in Table 2. On the one hand, compared to the 11 groups (CHB, GWD, JPT, GBR, CEU, TSI, ASW, LWK, GIH, ITU, and MXL) without adjustment (p < 0.05), the number of significantly different variants in the Lahu was 32, 59, 32, 49, 52, 54, 51, 55, 51, 52, and 49, respectively. In these 81 different SNPs, the genotype frequencies distribution in thiopurine S-methyltransferase (TPMT) rs1142345 and vitamin K epoxide reductase complex subunit 1 (VKORC1) rs9934438 were found to be different in the Lahu population when compared to the other 11 ethnic groups. After adjustment using the Bonferroni correction (p < 0.05/(81*11)), there were 5, 49, 6, 38, 39, 40, 40, 46, 39, 34, and 22 loci of significant differences between Lahu and the other 11 populations, respectively. The significance of rs1142345 and rs9934438 still existed between Lahu and the other 11 populations. After adjustment, the results also exhibited that GWD was the most different population compared with Lahu, with the number of 49 distinct SNPs loci, followed by LWK with the number of 46 distinct SNPs loci. It was also noteworthy that the different loci between CHB, JPT and the Lahu were the least. However, according to the statistics, the frequencies of alcohol dehydrogenase 1C (ADH1C) rs698, glutathione S-transferase pi 1 (GSTP1) rs1695, cytochrome P450 family 2 subfamily A member 6 (CYP2A6) rs28399433 were distinct from that of CHB groups, respectively. On the other hand, in addition to the above loci, we also found that the genotype distribution of potassium voltage-gated channel subfamily H member 2 (KCNH2) rs3807375 was significantly different between Lahu and JPT.
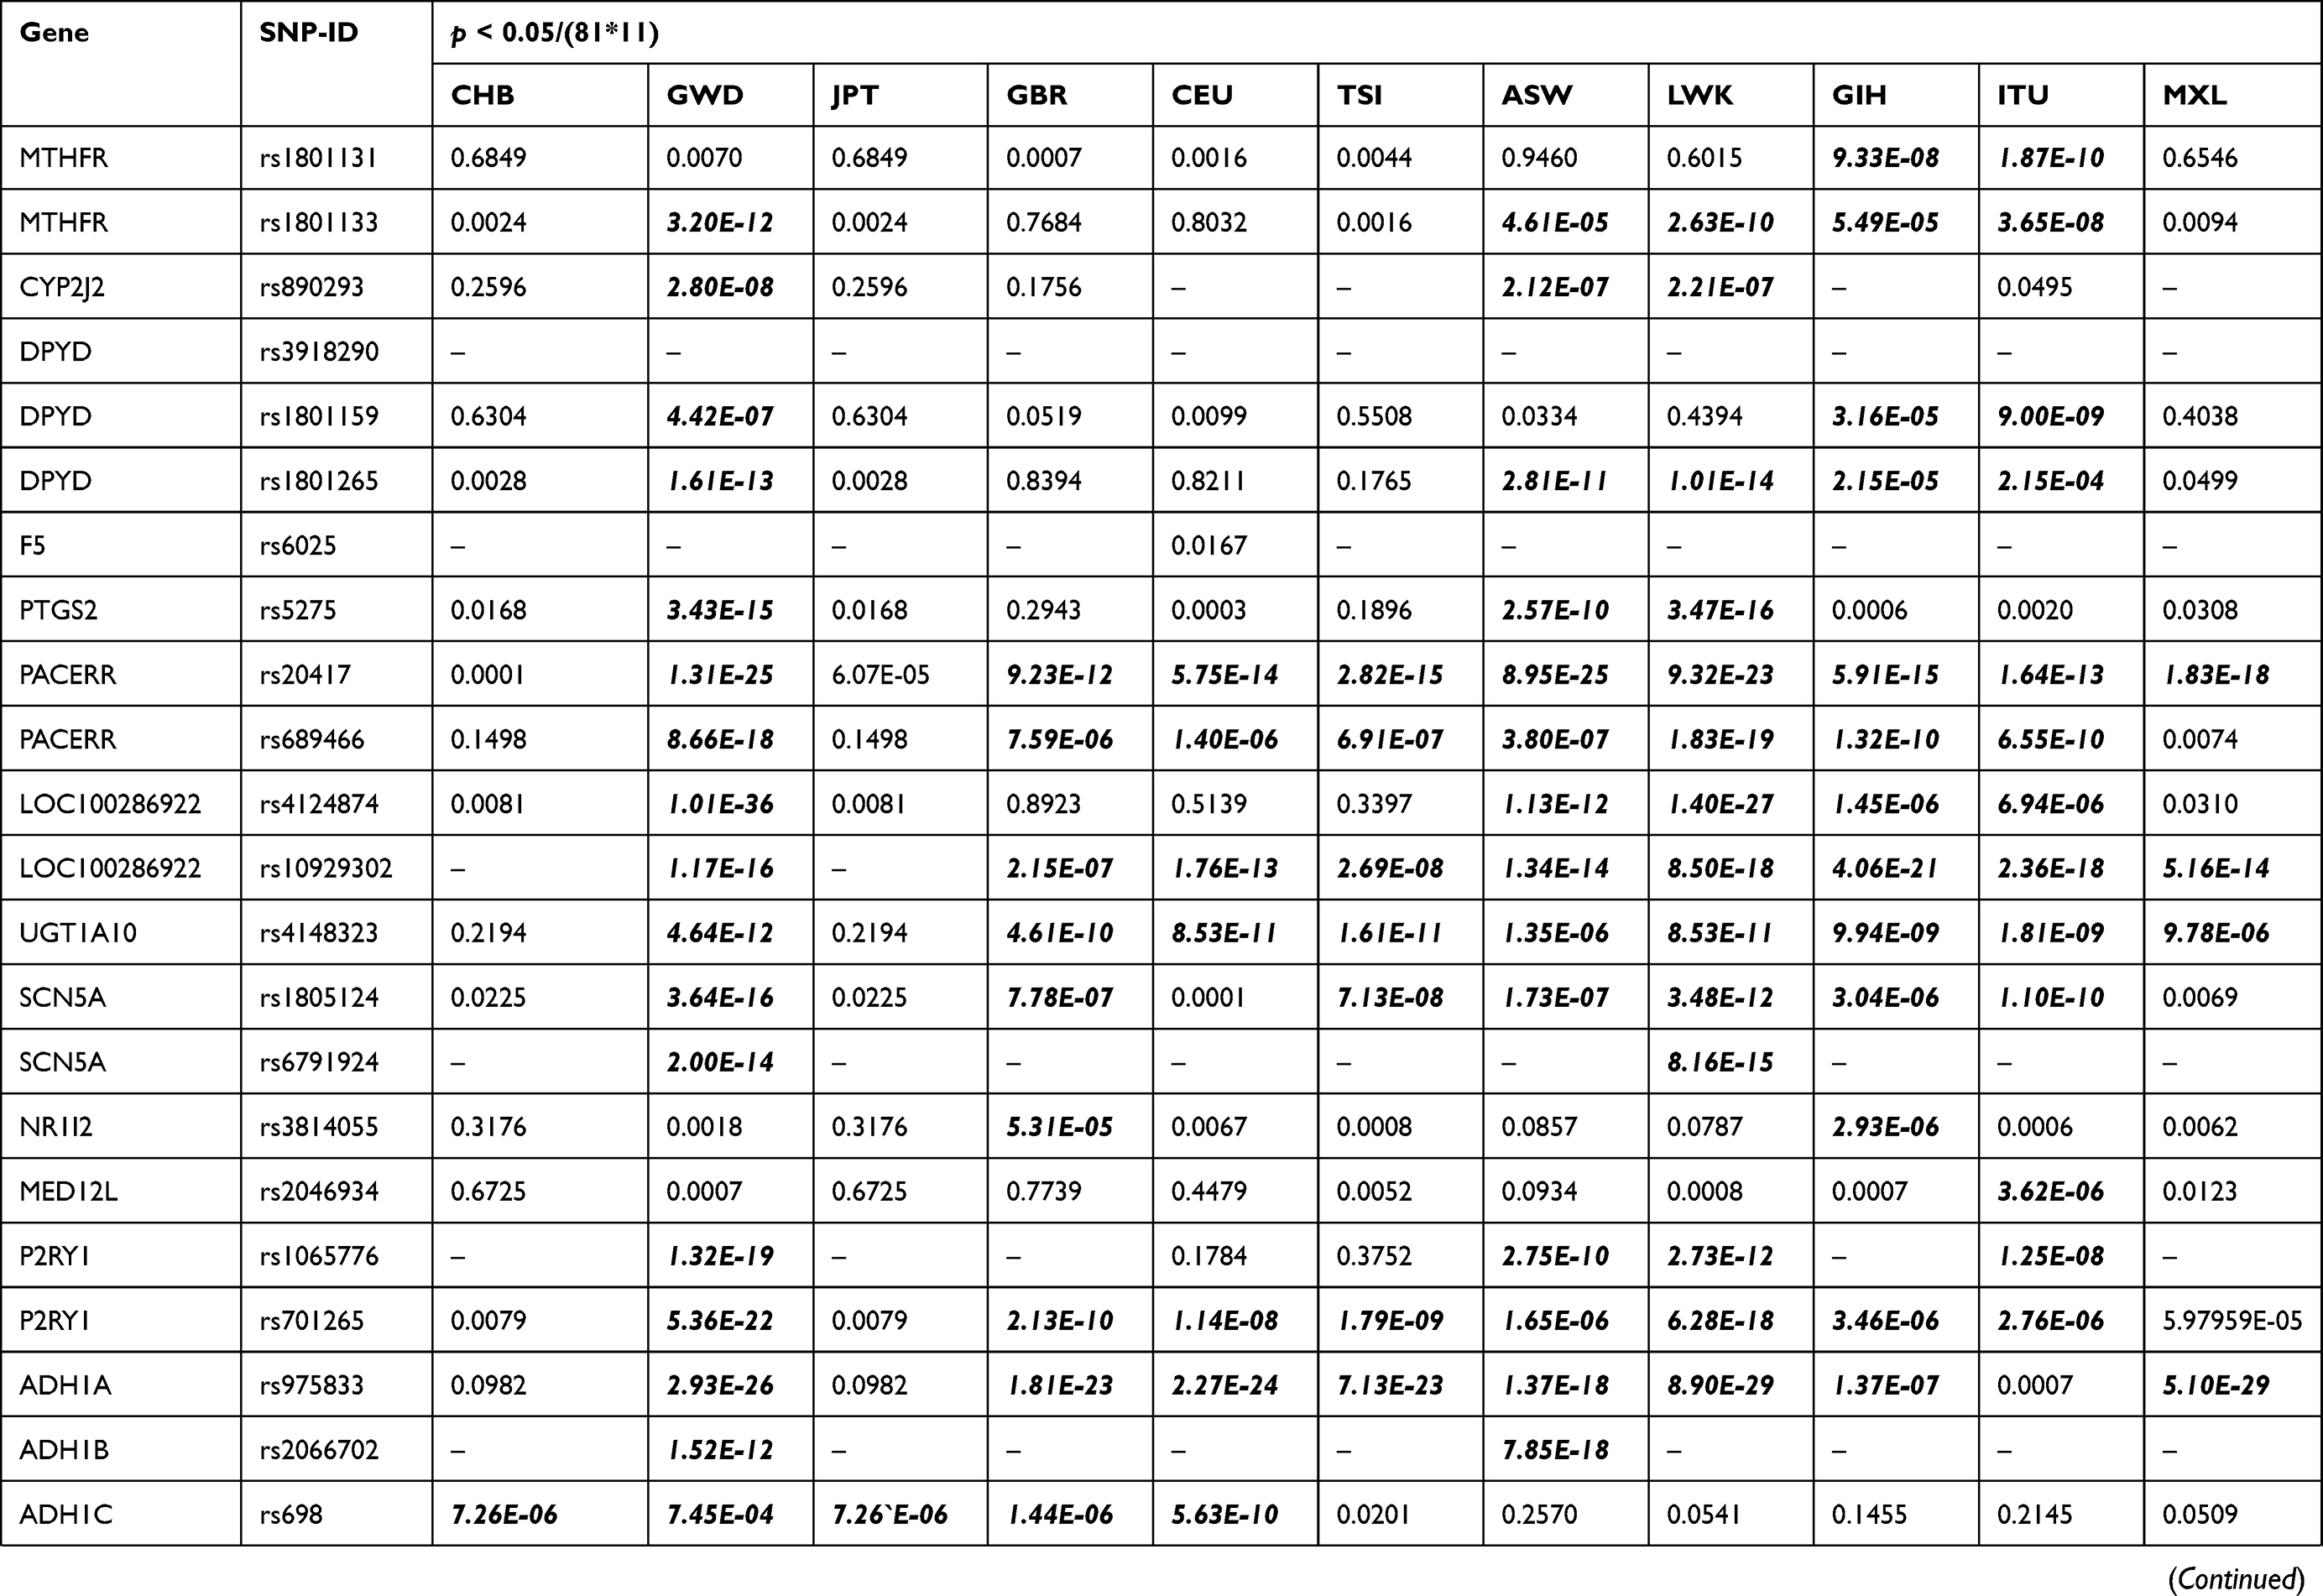 | 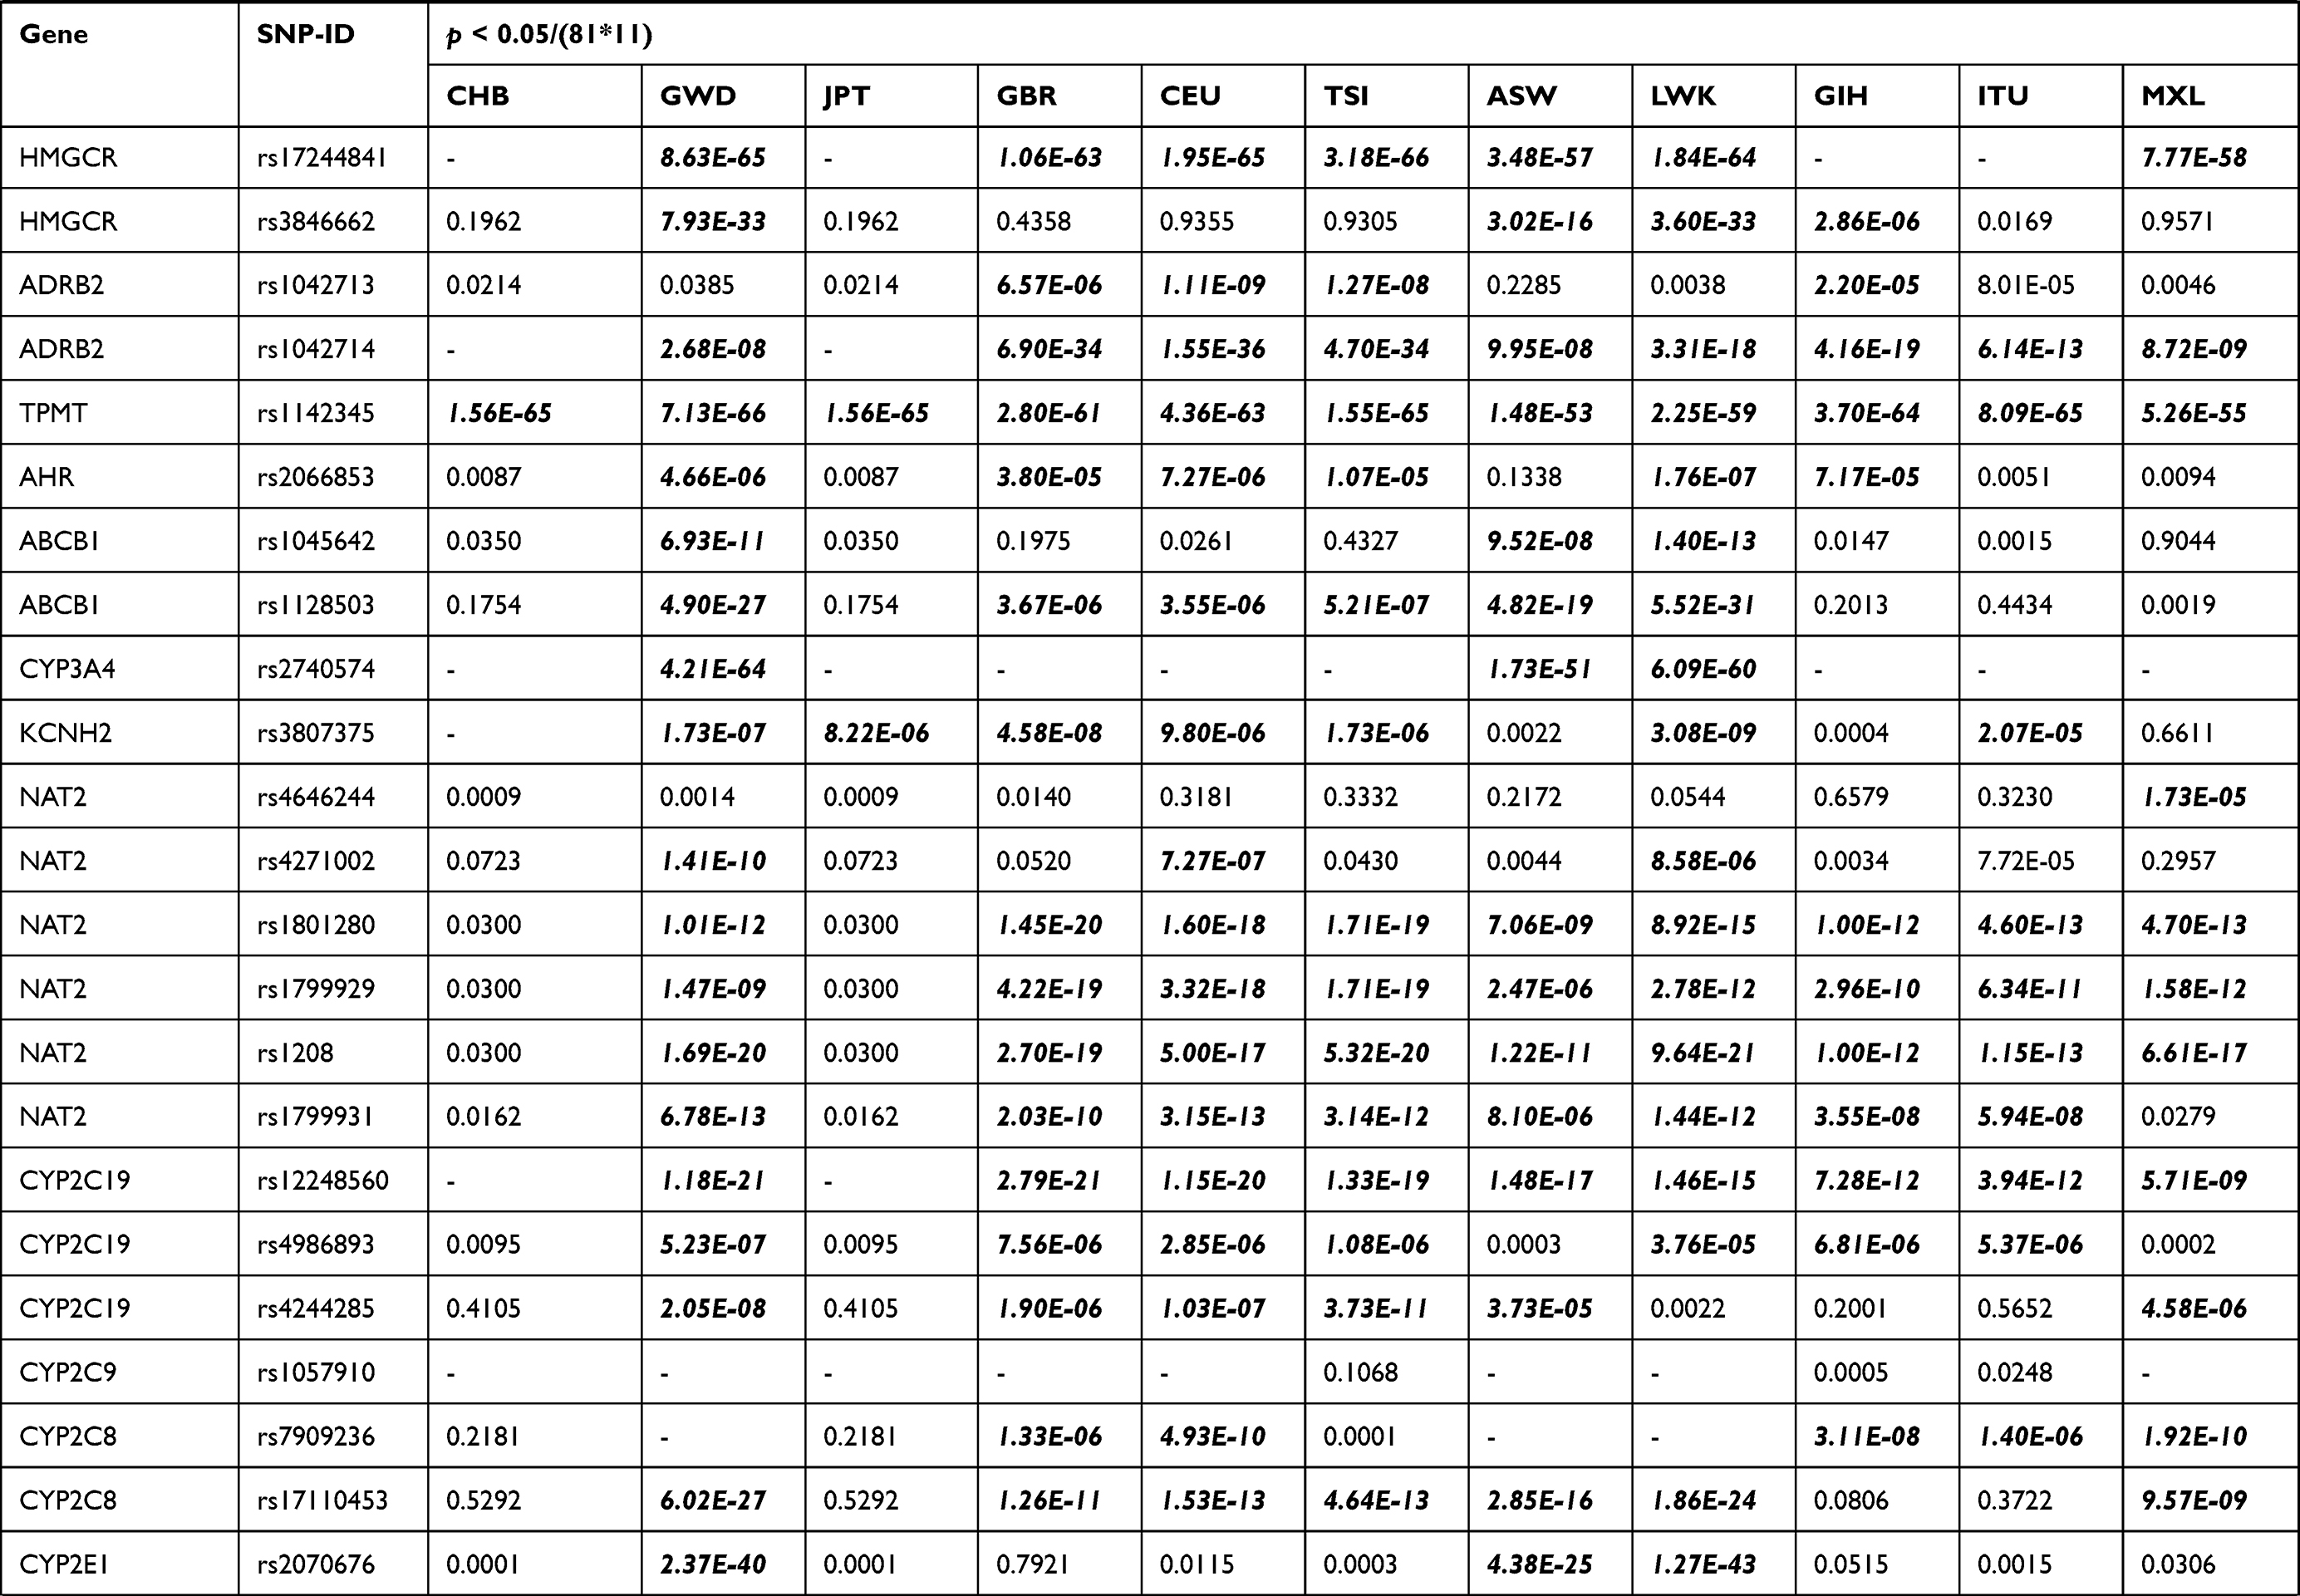 |  |  |
Table 2 Different VIP Variants Loci in the Lahu Compared with the 11 Populations After Bonferroni’s Multiple Adjustment |
Then, we performed linkage disequilibrium (LD) analysis using Haploview to define blocks and haplotypes. In the vitamin D receptor (VDR) gene, we found LD blocks in Lahu, CHB, JPT, GBR, CEU, TSI, GIH, ITU, and MXL, and however, there was no strong linkage between GWD, ASW, and LWK (Figure 1). Haplotype constitutions and frequencies showed that Lahu was differed from the other 11 populations. These findings, which are in accordance with the results, are shown in Table 2.
 |
Figure 1 LD analysis of the VDR in each of the twelve populations. LD is displayed by standard color schemes with bright red for very strong LD (LOD>2, D′ =1), pink red (LOD> 2, D′ <1), blue (LOD< 2, D′ =1) for intermediate LD, and white (LOD<2, D′ <1) for no LD. |
Analyses of Genetic Background
The Fst values were calculated with the help of Arlequin 3.5 to demonstrate the pairwise difference. With a detailed and comprehensive estimate and assessment for different population pairs, we figured out the magnitude of the differentiation among all the 12 geographic populations (0 means no divergence, and 1 indicates complete separation). As shown in Table 3, pairwise Fst values between Lahu and the other 11 HapMap groups measured the genetic divergence based on the genetic polymorphism data, which were variously ranged from 0.02782 to 0.23350. When Fst value is less than 0.15, there is no genetic differentiation between the two populations. Compared to other populations, the results showed that the lowest level (Fst = 0.02782) existed between the Lahu and CHB populations, followed by the JPT (Fst = 0.03449) and GIH (Fst = 0.114). The LWK population showed the greatest divergence (Fst = 0.2335).
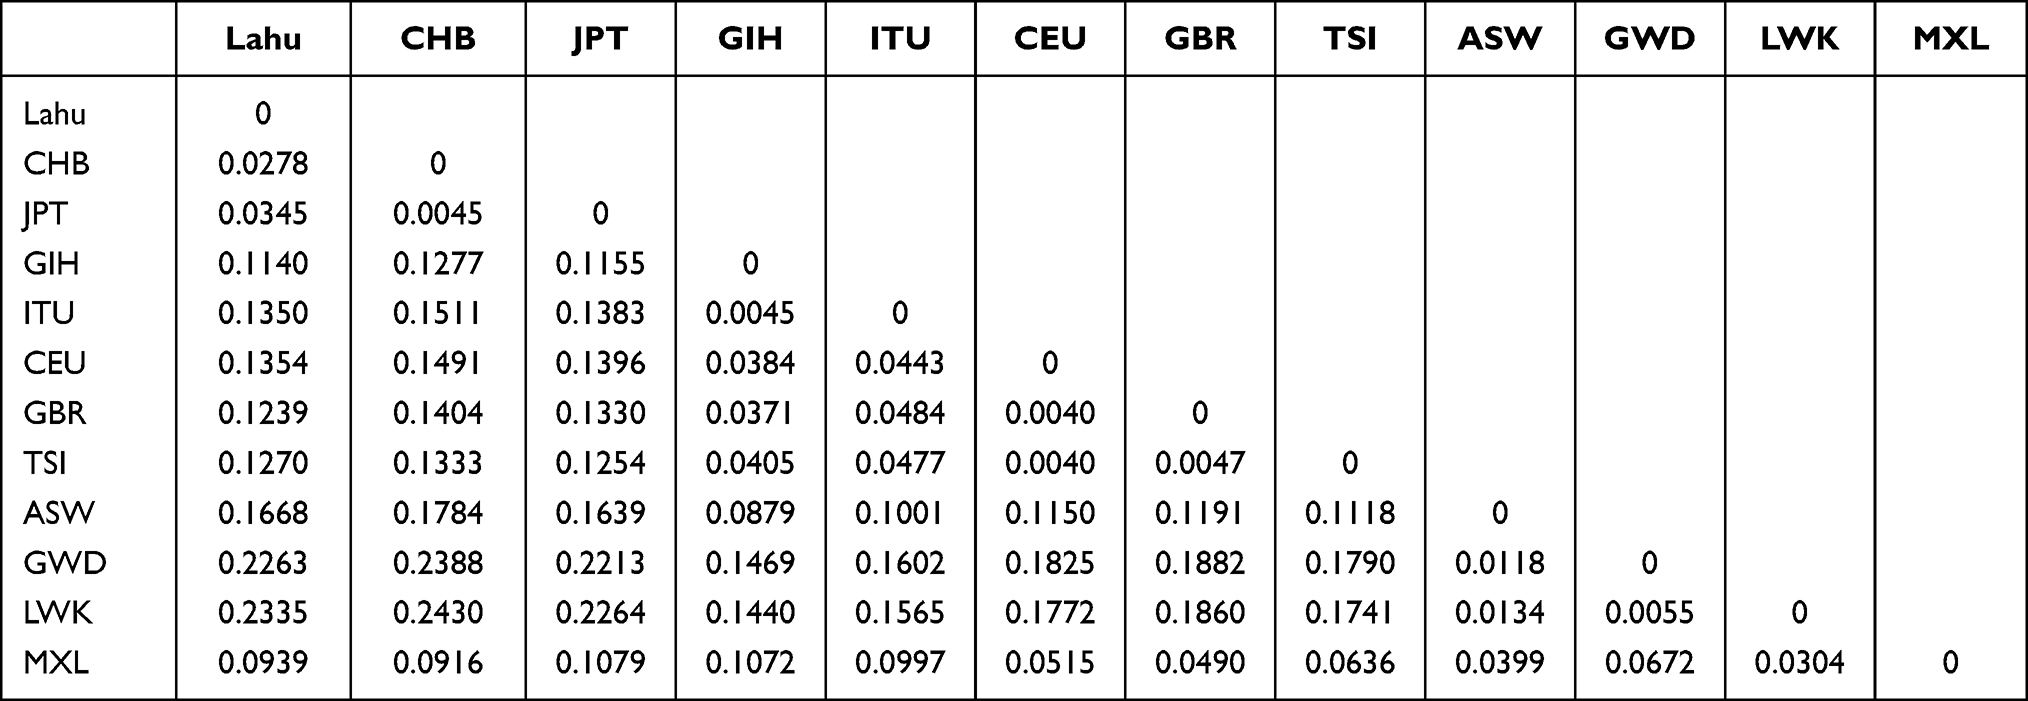 |
Table 3 Estimates of Pairwise Fst Among the 12 Population |
The Bayesian-based structure analysis showed us complementary methods for patterns of genetic similarity and differentiation of the total 12 populations, which works well for 81 loci in the current study. The most suitable K value was observed at 3. The proportion of each ancestor in a single individual was represented with a vertical bar, which was divided into three colors. In Figure 2, the BAR diagram showed that individuals sampled in Lahu were close to the clustering of people with CHB people.
 |
Figure 2 Results of STRUCTURE analyses (K=3) among 12 populations. Most suitable K value is 3. |
Discussion
There is increasing interest in pharmacogenomics because of genetic variations leading to each person’s different metabolism of and reactions to some drugs. As is known to all, race is an important factor leading to large differences in drug metabolism, treatment response, and toxicity among individuals.17 In our results, we genotyped the pharmacogenomic VIP variants in the Lahu population and determined the differences between Lahu and the other 11 populations. We found that 32, 59, 32, 49, 52, 54, 51, 55, 51, 52, and 49 of the selected variants in the Lahu population significantly differed from those of CHB, GWD, JPT, GBR, CEU, TSI, ASW, LWK, GIH, ITU, and MXL, respectively. These results suggest that the Lahu ethnic group has genetic heterogeneity that distinguishes it from other ethnic groups. Interestingly, the difference of loci genotype frequencies between CHB, JPT and Lahu was the least. Additionally, the pairwise Fst values and genetic structure also revealed that the variants in the Lahu were mostly similar to the JPT and CHB populations genetically.
Nonetheless, we found that compared to the other 11 populations, TPMT rs1142345 was significantly different in Lahu people. Pharmacogenomics studies have shown that genetic polymorphisms in TPMT are variable and that TPMT activity is regulated by genetic polymorphisms, which is also the cause of adverse drug reactions.18 The TPMT genotype has been considered as an indicator of the initial dose of thiopurine drugs,19 and race-specific differences in TPMT activity and mercaptopurine metabolism have been observed.20 African ancestry is associated with the lower TPMT activity, and some studies have reported a higher prevalence of TPMT variants in blacks.21,22 The CC genotype carrying the TPMT*3C (c.719 T>C, rs1142345) variant is susceptible to the toxicity of the standard dose of 6-mercaptopurine. A high-frequency CC genotype of the TPMT*3C variant was found in traditional indigenous people in the Amazon region.23 Compared with the other 11 populations, TPMT rs1142345 variants in the Lahu population are statistically different. The C allele is associated with mercaptopurine exposure in children with leukemia when compared with the T allele. The relationship between the polymorphism of rs1142345 and the risk of acute lymphoblastic leukemia has been widely reported.23,24 The personalized medication (mercaptopurine) for acute lymphoblastic leukemia of the Lahu ethnic group is worthy of attention.
Furthermore, we found that VKORC1 rs9934438 (A>G) was significantly different in Lahu compared to the other 11 populations as well. A common variant of the vitamin K epoxide reductase complex subunit 1 (VKORC1) gene has also been strongly associated with inter-individual warfarin dosing variability25,26 The warfarin dose of patients from Southern Italy GG genotype carriers at rs9934438 was significantly higher than that of AA genotype carriers or GA genotype patients.26 In different populations, such as the whites and Asians, the VKORC1 polymorphism has showed a sustained and significant effect on the warfarin response, accounting for 11% to 32% of the dose variation27,28 More attention should be paid to warfarin and related agents in the Lahu population.
Our research further found that differences in gene frequency of ADH1C rs698, CYP2A6 rs28399433, and GSTP1 rs1695 between the Lahu and the CHB. Their polymorphism has been reported to be closely related to alcohol metabolism,29 tobacco metabolism,30 and carcinogen metabolism.31 What is more, there are population differences, especially in Asia with the other states. Lahu and CHB were found to be two close populations. However, our study implied that individual medications in clinical practice should also be considered separately in the Lahu population.
In conclusion, the VIP variation detected in Lahu group is different from those of the other 11 populations. Determination of the allele distribution and frequencies of VIP variants in such a minority group would provide a theoretical basis for the safer drug administration and much better therapeutic effects. Our results first provide a basic overview of VIP in Lahu groups, and it is hoped that these data will help to develop the population-specific pharmacogenetics studies. However, this study still has limitations. Presently, the sample size is small. A large number of samples were needed to provide strong evidence for the results, to provide a broad overview of better efficacy and safer drug strategies for the Lahu people, and to influence the rational drug selection and the dosage of the Lahu people. Finally, we hope to help optimize personalized treatment strategies.
Abbreviations
VIP, very important pharmacogenomics; SNP, single nucleotide polymorphism; Fst, F-statistics; CHB, the Han Chinese in Beijing, China; GWD, Gambian in Western Divisions, the Gambia; JPT, the Japanese population in Tokyo, Japan; GBR, British in England and Scotland; CEU, the northwestern European population; TSI, the Tuscan people of Italy; ASW, African ancestry in the southwestern USA; LWK, the Luhya people in Webuye, Kenya; MXL, Mexican Ancestry in Los Angeles, California; GIH, the Gujarati Indians in Houston, Texas, USA; ITU, Indian Telugu in the UK.
Ethics Approval and Consent to Participate
The study was approved by the Ethics Committee of the Yunnan First People’s Hospital (YYLH054) and was performed in accordance with the Declaration of Helsinki. All participants agreed to participate and signed informed consent.
Acknowledgments
The authors thank all the participants in this study. We are also grateful to the hospital staff who contributed to the sample and data collection. Yujing Cheng and Qi Li are co-first authors of this study.
Author Contributions
All authors made a significant contribution to the work reported, whether that is in the conception, study design, execution, acquisition of data, analysis and interpretation, or in all these areas; took part in drafting, revising or critically reviewing the article; gave final approval of the version to be published; have agreed on the journal to which the article has been submitted; and agree to be accountable for all aspects of the work.
Funding
This work was supported by the Applied Basic Research Foundation of Yunnan Province (CN) [grant number: 2017FE468 (−125) and 202001AY070001-111], the Open Project of the Clinical Medicine Center of the First People's Hospital of Yunnan Province [grant number: 2021LCZXXF-XY12] and CAMS Innovation Fund for Medical Sciences (CIFMS) [grant number: 2016-I2M-3-024].
Disclosure
The authors report no conflicts of interest in this work.
References
1. Owen RP, Klein TE, Altman RB. The education potential of the pharmacogenetics and pharmacogenomics knowledge base (PharmGKB). Clin Pharmacol Ther. 2007;82(4):472–475. doi:10.1038/sj.clpt.6100332
2. Badary OA. Pharmacogenomics and COVID-19: clinical implications of human genome interactions with repurposed drugs. Pharmacogenomics J. 2021;21(3):275–284. doi:10.1038/s41397-021-00209-9
3. He Y, Yang H, Geng T, et al. Genetic polymorphisms of pharmacogenomic VIP variants in the lhoba population of southwest China. Int J Clin Exp Pathol. 2015;8(10):13293–13303.
4. Ma JD, Lee KC, Kuo GM. Clinical application of pharmacogenomics. J Pharm Pract. 2012;25(4):417–427. doi:10.1177/0897190012448309
5. Ventola CL. Role of pharmacogenomic biomarkers in predicting and improving drug response: part 1: the clinical significance of pharmacogenetic variants. P t. 2013;38(9):545–560.
6. Sacco RL, Kasner SE, Broderick JP, et al. An updated definition of stroke for the 21st century: a statement for healthcare professionals from the American Heart Association/American Stroke Association. Stroke. 2013;44(7):2064–2089. doi:10.1161/STR.0b013e318296aeca
7. Yi X, Lin J, Zhou J, et al. The secondary prevention of stroke according to cytochrome P450 2C19 genotype in patients with acute large-artery atherosclerosis stroke. Oncotarget. 2018;9(25):17725–17734. doi:10.18632/oncotarget.24877
8. Kim GJ, Lee SY, Park JH, et al. Role of preemptive genotyping in preventing serious adverse drug events in South Korean patients. Drug Saf. 2017;40(1):65–80. doi:10.1007/s40264-016-0454-5
9. Guo F. Genetic polymorphism of 17 autosomal STR loci in the Lahu ethnic minority from Yunnan Province, Southwest China. Forensic Sci Int Genet. 2017;31:e52–e3. doi:10.1016/j.fsigen.2017.08.002
10. Singkorn O, Apidechkul T, Putsa B, et al. Factor associated with alcohol use among Lahu and Akha hill tribe youths, northern Thailand. Subst Abuse Treat Prev Policy. 2019;14(1):5. doi:10.1186/s13011-019-0193-6
11. Faul F, Erdfelder E, Lang AG, et al. G*Power 3: a flexible statistical power analysis program for the social, behavioral, and biomedical sciences. Behav Res Methods. 2007;39(2):175–191. doi:10.3758/BF03193146
12. Gabriel S, Ziaugra L, Tabbaa D. SNP genotyping using the Sequenom massARRAY iPLEX platform. Curr Protoc Hum Genet. 2009;60. doi:10.1002/0471142905.hg0212s60
13. Thomas RK, Baker AC, Debiasi RM, et al. High-throughput oncogene mutation profiling in human cancer. Nat Genet. 2007;39(3):347–351. doi:10.1038/ng1975
14. Excoffier L, Laval G, Schneider S. Arlequin (version 3.0): an integrated software package for population genetics data analysis. Evol Bioinform Online. 2007;1:47–50.
15. Pritchard JK, Stephens M, Donnelly P. Inference of population structure using multilocus genotype data. Genetics. 2000;155(2):945–959. doi:10.1093/genetics/155.2.945
16. Evanno G, Regnaut S, Goudet J. Detecting the number of clusters of individuals using the software STRUCTURE: a simulation study. Mol Ecol. 2005;14(8):2611–2620. doi:10.1111/j.1365-294X.2005.02553.x
17. Chowbay B, Zhou S, Lee EJ. An interethnic comparison of polymorphisms of the genes encoding drug-metabolizing enzymes and drug transporters: experience in Singapore. Drug Metab Rev. 2005;37(2):327–378. doi:10.1081/DMR-28805
18. Otterness D, Szumlanski C, Lennard L, et al. Human thiopurine methyltransferase pharmacogenetics: gene sequence polymorphisms. Clin Pharmacol Ther. 1997;62(1):60–73. doi:10.1016/S0009-9236(97)90152-1
19. Schaeffeler E, Fischer C, Brockmeier D, et al. Comprehensive analysis of thiopurine S-methyltransferase phenotype-genotype correlation in a large population of German-Caucasians and identification of novel TPMT variants. Pharmacogenetics. 2004;14(7):407–417. doi:10.1097/01.fpc.0000114745.08559.db
20. Cooper SC, Ford LT, Berg JD, et al. Ethnic variation of thiopurine S-methyltransferase activity: a large, prospective population study. Pharmacogenomics. 2008;9(3):303–309. doi:10.2217/14622416.9.3.303
21. Hon YY, Fessing MY, C H PUI, et al. Polymorphism of the thiopurine S-methyltransferase gene in African-Americans. Hum Mol Genet. 1999;8(2):371–376. doi:10.1093/hmg/8.2.371
22. Jones CD, Smart C, Titus A, et al. Thiopurine methyltransferase activity in a sample population of black subjects in Florida. Clin Pharmacol Ther. 1993;53(3):348–353. doi:10.1038/clpt.1993.31
23. Cardoso de Carvalho D, Pereira Colares Leitão L, Mello Junior FAR, et al. Association between the TPMT*3C (rs1142345) polymorphism and the risk of death in the treatment of acute lymphoblastic leukemia in children from the Brazilian Amazon Region. Genes. 2020;11(10):1132. doi:10.3390/genes11101132
24. Yang JJ, Landier W, Yang W, et al. Inherited NUDT15 variant is a genetic determinant of mercaptopurine intolerance in children with acute lymphoblastic leukemia. J Clin Oncol. 2015;33(11):1235–1242. doi:10.1200/JCO.2014.59.4671
25. Limdi NA, Wadelius M, Cavallari L, et al. Warfarin pharmacogenetics: a single VKORC1 polymorphism is predictive of dose across 3 racial groups. Blood. 2010;115(18):3827–3834. doi:10.1182/blood-2009-12-255992
26. D’andrea G, D’ambrosio RL, DI PERNA P, et al. A polymorphism in the VKORC1 gene is associated with an interindividual variability in the dose-anticoagulant effect of warfarin. Blood. 2005;105(2):645–649. doi:10.1182/blood-2004-06-2111
27. Limdi NA, Arnett DK, Goldstein JA, et al. Influence of CYP2C9 and VKORC1 on warfarin dose, anticoagulation attainment and maintenance among European-Americans and African-Americans. Pharmacogenomics. 2008;9(5):511–526. doi:10.2217/14622416.9.5.511
28. Veenstra DL, You JH, Rieder MJ, et al. Association of vitamin K epoxide reductase complex 1 (VKORC1) variants with warfarin dose in a Hong Kong Chinese patient population. Pharmacogenet Genomics. 2005;15(10):687–691. doi:10.1097/01.fpc.0000174789.77614.68
29. Li D, Zhao H, Gelernter J. Further clarification of the contribution of the ADH1C gene to vulnerability of alcoholism and selected liver diseases. Hum Genet. 2012;131(8):1361–1374. doi:10.1007/s00439-012-1163-5
30. Tanner JA, Zhu AZ, Claw KG, et al. Novel CYP2A6 diplotypes identified through next-generation sequencing are associated with in-vitro and in-vivo nicotine metabolism. Pharmacogenet Genomics. 2018;28(1):7–16. doi:10.1097/FPC.0000000000000317
31. Kassogue Y, Diakite B, Kassogue O, et al. Genetic polymorphism of drug metabolism enzymes (GSTM1, GSTT1 and GSTP1) in the healthy Malian population. Mol Biol Rep. 2020;47(1):393–400. doi:10.1007/s11033-019-05143-5
 © 2021 The Author(s). This work is published and licensed by Dove Medical Press Limited. The
full terms of this license are available at https://www.dovepress.com/terms
and incorporate the Creative Commons Attribution
- Non Commercial (unported, 3.0) License.
By accessing the work you hereby accept the Terms. Non-commercial uses of the work are permitted
without any further permission from Dove Medical Press Limited, provided the work is properly
attributed. For permission for commercial use of this work, please see paragraphs 4.2 and 5 of our Terms.
© 2021 The Author(s). This work is published and licensed by Dove Medical Press Limited. The
full terms of this license are available at https://www.dovepress.com/terms
and incorporate the Creative Commons Attribution
- Non Commercial (unported, 3.0) License.
By accessing the work you hereby accept the Terms. Non-commercial uses of the work are permitted
without any further permission from Dove Medical Press Limited, provided the work is properly
attributed. For permission for commercial use of this work, please see paragraphs 4.2 and 5 of our Terms.