Back to Journals » Patient Preference and Adherence » Volume 11
An upper and lower bound of the Medication Possession Ratio
Authors Sperber CM, Samarasinghe SR ![]() , Lomax GP
, Lomax GP
Received 13 March 2017
Accepted for publication 10 July 2017
Published 30 August 2017 Volume 2017:11 Pages 1469—1478
DOI https://doi.org/10.2147/PPA.S136890
Checked for plagiarism Yes
Review by Single anonymous peer review
Peer reviewer comments 3
Editor who approved publication: Dr Johnny Chen
Christian M Sperber, Suren R Samarasinghe, Grace P Lomax
Patient Connect Limited, Guildford, UK
Background: The Medication Possession Ratio (MPR) is a ubiquitous and central measurement for adherence in the health care industry. However, attempts to standardize its calculation have failed, possibly due to the opacity of a single, static MPR, incapability of directly lending itself to a variety of studies, and challenges of comparing the value across studies. This work shows that the MPR strictly depends on the length of the time interval over which it is measured as well as on the dominant dispense quantity for short time intervals. Furthermore, removing a proportion of the patient cohort based on the number of acquisitions may also have a severe impact on the MPR. Therefore, it is suggested that the MPR is represented as a trend over a range of time intervals. To this end, an upper and lower bound of the MPR trend is developed with an upper bound acknowledging patients who change their treatment and the lower bound acknowledging patients who discontinue their treatment.
Purpose: Introducing a representation of the MPR value as a trend rather than a static number by developing a quantitative description of an upper and lower bound of the MPR trend, while shedding light on the impacts on prefiltering the patient cohort.
Patients and methods: Anonymized patient-level data was utilized as an example for a suggested calculation of an upper and lower bound of the MPR.
Results: Representation of the MPR for a predefined time interval precludes a reliable MPR assessment. A quantitative approach is suggested to generate an upper and lower trend of the MPR while emphasizing the impact on removing patients with a limited number of acquisitions.
Conclusion: An upper and lower trend makes the MPR more transparent and allows a better comparison across different studies. Removing patients with a limited number of acquisitions should be avoided.
Keywords: MPR, adherence, pharmacy claims, quantitative calculation, compliance, administrative claims data
Introduction
Many treatments with medications are designed to accumulate and maintain a defined concentration of an active ingredient in the patient’s system. To this end, the rate of loss of the active ingredient needs to equal the rate of its ingestion (dosage).1 Therefore, in order to sustain a steady-state system, it becomes imperative that taking medication at prescribed intervals and doses is of paramount importance. Diverging from the prescribed dosage, frequency, or completely discontinuing treatment directly affects the concentration of the active ingredient in the patient’s system. The degree to which a patient conforms to a prescribed course of medication has been termed adherence, while conformity with the prescribed period of treatment is referred to as persistence. Notably, persistence is usually defined as a categorical variable and defined as an adherence of 80% or higher.2 Official definitions of these terms were developed by the International Society of Pharmacoeconomics and Outcome Research.3
Nonadherence in patients has been a concern of health professionals for a long time as it correlates with an increase in prehospitalization, morbidity, and mortality.4–6 Poor adherence not only has been shown to adversely affect the patient’s health, but also puts financial strain on the health care system.7,8 As such, measuring adherence is a highly sought-after parameter in the health industry and has been proposed to be used for evaluating the quality of care.9 Furthermore, it has also been used to quantify the medication sales performance in the pharmaceutical industry.
In recent years, administrative claims data have increasingly been utilized to measure adherence as a relatively inexpensive, negligibly invasive, and easy-to-obtain source.10 Numerous studies employing administrative claims data for measuring adherence have been compiled and reviewed in Andrade et al.11 Andrade et al11 report that only a small number of studies use methods such as switching and discontinuation of treatment, while the majority of studies employ the Medication Possession Ratio (MPR) methods or their modifications such as “Proportion of Days Covered”,12 “Continuous, Single Interval Measure of Medication Acquisition”,10 “Medication Refill Adherence”,13 and so on. Usually, the MPR value determines the proportion of days of medication supply within a time interval, although a small number of studies have also focused on the proportion of days without supply within a given time interval.12 However, both methods have been reported to perform equally well.14,15 Numerous MPR calculations have been developed and discussed in the literature.11,14–19 However, many of these calculations are identical,15 and only a limited number of MPR approaches have ubiquitously been used in the literature. Despite a wealth of discussions on MPR parameters and attempts to standardize the calculations,14,15 confusion remains regarding terminology, how to appropriately report the values, the impact of filtering such as removing a proportion of the patient cohort, and their interpretation on the MPR. This confusion may be due to the lack of transparency of the MPR and its modifications as it is usually represented as a single and static figure. Moreover, a single figure obstructs a rigorous comparison across different study constraints such as the kind of treatment, type of medication, and patient cohorts; it also conceals itself from being equally useful to health professionals as well as the pharmaceutical industry. Notably, Franklin et al20 describe a method that considers a longitudinal trend utilizing binary indicators of adherence combined with a statistically driven clustering of patient’s medication adherence.
Notably, this study will not repeat the exercise of comparing all different equations of the MPR methods and the reader is referred to Karve et al14 and Hess et al15 for insight. Instead, we develop a workflow utilizing two accepted and commonly used calculations, discuss their limitations, impacts of filtering, and finally propose an absolute, ubiquitously useful, and transparent MPR trend as opposed to a static number. Where given standard deviations are reported at a one sigma level, we empirically apply this workflow to a comprehensive administrative claims dataset.
MPR equation
MPR formulates a ratio between the days of medication supply of all prescription fills (Rxs) within a time interval:
| (1) |
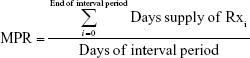
The MPR takes on positive numbers including zero. MPR of zero means no adherence, while an MPR of one means perfect adherence. An MPR above one indicates the patient took too high a dose of medication, henceforth referred to as overdosing, while an MPR of below one indicates too low a dose of medication within the interval period, henceforth referred to as underdosing.
The Variable MPR (VMPR) and Fixed MPR (FMPR) approaches have been repeatedly found in the literature, although sometimes under different names.14,15,18,21 The FMPR value has been shown to correlate well with rehospitalization rates and has been recommended as the preferred measurement for adherence.14,22 The VMPR value, on the other hand, has been shown to overestimate adherence and correlate less well with rehospitalization.14,15,18 These two approaches have been widely used and tested, and their merit for a rigorous adherence investigation is discussed in this study. Both approaches underlie the fundamental equation given in Equation 1.
The FMPR approach keeps the denominator constant at a fixed interval period. Most authors have used a 365-day period,23–25 although other interval periods may be considered when dealing with nonchronic treatments lasting shorter periods. If all treatment days of the acquisition’s supply fall within the interval period, the numerator is straightforward and is the total sum of quantities of all acquisitions (Figure 1A). If, however, a proportion of the treatment days of the last acquisition’s (ie, end of therapy) supply extends beyond the end of the interval period, the excess days’ supply is truncated (Figure 1B).
 | Figure 1 Three different ways for calculating the MPR value. |
Alternatively, rather than truncating the days’ supply in the numerator, the number of days in the denominator can be extended to the last day for which the patient has medication allocated from their last acquisition; then, the calculation represents the VMPR. As such, the interval period for the VMPR is defined by the days between the date of the patient’s first acquisition (ie, start of therapy) and last acquisition plus the days’ supply of their last acquisition (Figure 1C).
In order to arrive at the final result, the MPRs of individual patients are averaged, which is then referred to as the overall parameter. Notably, the calculations in this study are only for one medication and an individual patient. For multi-medication calculations, the interested reader is referred to Choudhry et al18 and Martin et al.19
Dataset, methodology, and MPR calculations
In this study, we use anonymized patient-level data, acquired by Patient Connect and collected at the point of dispensing from 820 pharmacies evenly distributed across the UK. These anonymized patient-level data assemble an unfiltered cohort of 108,682 unique patients who collected a specific cardiovascular medication between June 2013 and May 2016. The data include the dispensing date and quantity (usually prescribed at one tablet daily), unique patient ID, as well as age and gender. From this dataset, patients have been identified with an index date, between June 2014 and May 2015 (ie, 12 months after the start of the dataset). Index date is here defined as the earliest occurrence of a unique patient ID in the dataset, hence the patient’s first acquisition within the dataset. This query isolated 25,724 unique patient IDs, which are referred to as “new” patients. Limiting the dataset to only new patients attempts to identify a cohort of patients who started treatment at a similar time, hence generating more comparable samples within the population. Of the isolated patient cohort, 55% are male, 44% are female, and 1% is unspecified. The average age is 73±16 years, although the distribution is skewed toward older patients, which reflects the prevalence of the treated condition.
A first pass analysis of the patient’s adherence can be performed through comparing the frequency distributions of acquisition quantities (Figure 2A) and days between two subsequent acquisitions (Figure 2B). At a dose of one tablet a day, ideally, a patient would be expected back to the pharmacy after the number of days that equate to the number of tablets of the patient’s last acquisition. As such, for a perfect adherence, the quantities dispensed would be expected to correspond to the gaps between two subsequent acquisitions and a cross-correlation4 of these theoretical histograms would result in unity. While the histogram of acquisition quantities reveals that 87% of the dispensings of cardiovascular medication are at quantities of 28 (~59%), 56 (~19%), and seven (~9%) tablets, the histogram of days between two subsequent acquisitions reveals spikes at 28, 7, and 56 days. A cross-correlation between the first 365 samples (at one sample representing 1 day) of both the histograms results in a correlation coefficient of about 0.63 (with a significance of above 99% using a Student’s t-test), revealing a clear primary event in the correlation correlogram (Figure 2C). The discrepancy of the magnitudes of the spikes between the two histograms reflects the not perfect adherence. This correlation is a good estimate of adherence. In comparison, for a 365-day interval, the FMPR and VMPR parameters based on Equation 1 are 0.55±0.37 and 0.95±0.24, respectively. However, like the correlation coefficient, these two parameters are static numbers.
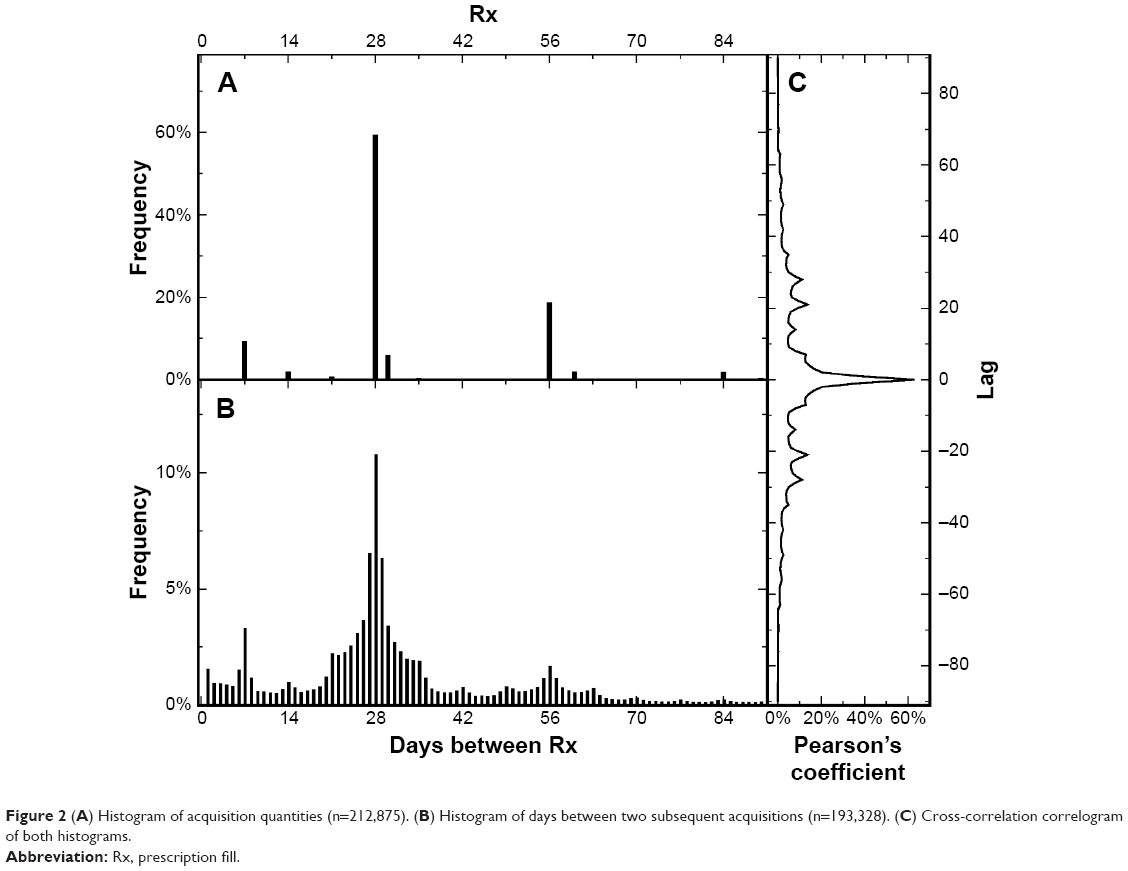 | Figure 2 (A) Histogram of acquisition quantities (n=212,875). (B) Histogram of days between two subsequent acquisitions (n=193,328). (C) Cross-correlation correlogram of both histograms. |
In this study, rather than representing the parameter as a static number, we develop an FMPR trend, gradually increasing the interval period from 1 to 365 days after the patient’s index day using an increment of 1 day. Notably, the VMPR calculation has no degree of freedom for the time interval and cannot be represented as a trend. Therefore, in order to allow a direct comparison between the FMPR and VMPR parameters at identical time intervals, we introduce a modification to the VMPR calculation and refer to it as the VMPRm parameter, where ‘m’ stands for modified. For this modification, the calculation of an individual VMPRm is identical to the FMPR method. However, when averaging the individual values, the VMPRm values are only included in the average when the time interval is smaller or equal to the conservatively determined time interval of the VMPR value. Unlike the FMPR method, where a patient is being tracked throughout the entire length of the interval period, that is, not excluded from the average at any time, the VMPRm method excludes a patient from the average after their last acquisition’s supply has run out. This has the advantage that the VMPRm parameter can also be represented as a trend. Significantly, the sample number in the averages of the FMPR trend remains constant, whereas the sample number in the averages of the VMPRm trend gradually decreases. Notably, as the index date in the FMPR calculation is aligned across patients, the sample number may vary for the index date overlap period at the end of the time interval. However, this can be easily avoided through adjustment of the time interval or limiting the index date overlap across patients if desired.
The individual FMPR and VMPRm values are limited to one, neglecting the case of overdosing. This approach has been discussed in the literature and has even led to different terminologies for the MPR.15,17,18 Notably, this cap is not applied to each acquisition and carrying over of medication into the subsequent acquisition is allowed, that is, excess medication can be stockpiled for later use.
Notably, the standard FMPR value evaluated as per the literature can be located on the FMPR trend. However, the VMPR parameter cannot be located on the VMPRm trend. This is because unlike the VMPRm parameter, the VMPR parameter represents an average of individual VMPR values based on a range of time intervals.
Results
The FMPR and VMPRm trends exhibit different magnitudes and shapes (Figure 3). The FMPR trend starts at one and decreases slowly within the first 28 days, reflecting the fact that most patients have 28 days’ supply (Figure 2A). After another 28 days, the drop-off is more significant, as only a proportion of patients return for a second acquisition immediately after completion of their first acquisition on their index date (Figure 2B). Subsequent increments of 28 days show a less pronounced drop-off, given that acquisitions become less aligned across patients. The number of individual FMPR values involved in the average is constant at 25,724, reflecting the number of patients isolated, throughout the 365-day interval. The VMPRm trend of this study, in contrast, is consistently above 0.8, suggesting a significantly higher adherence. Analogous to the FMPR trend, the VMPRm trend exhibits a drop-off for the first two 28-day increments. However, unlike the FMPR trend, the VMPRm trend displays a minimum at about 212 days and subsequently increases slowly. The number of individual VMPRm values involved in the average is 25,724 at day 1, again reflecting the number of isolated patients, and decreases to 10,919 at day 365, reflecting the number of patients who are still returning to the pharmacy. Two sudden declines in sample number size are striking at 28 and 56 days, reflecting the loss of patients after their first and second acquisition representing the most common acquisition’s quantity of 28 days’ supply (Figure 2).
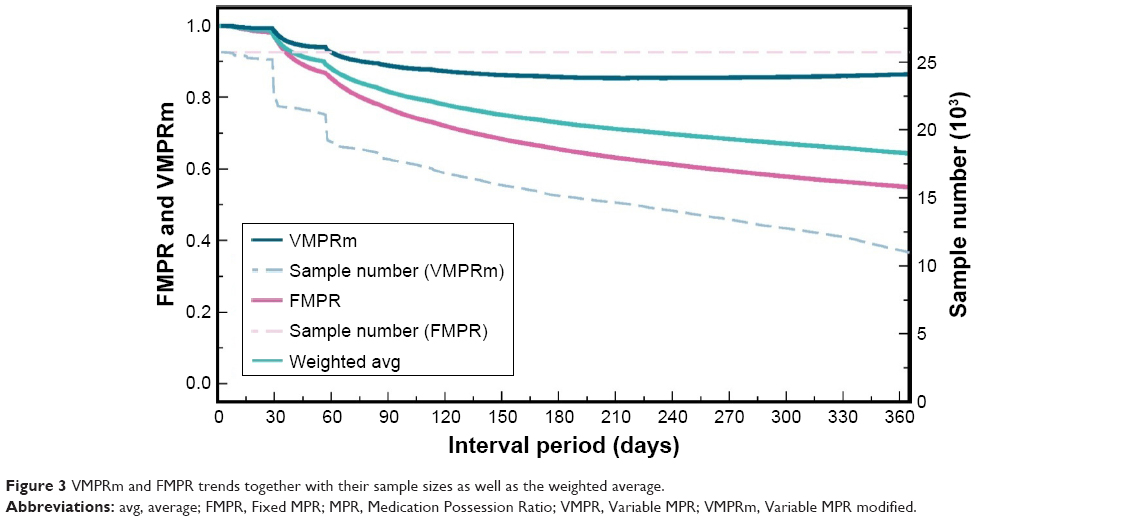 | Figure 3 VMPRm and FMPR trends together with their sample sizes as well as the weighted average. |
The FMPR, VMPR, and VMPRm parameters calculated in this study underlie different assumptions and require different interpretations. The trends calculated in this study show that the results of Equation 1 strongly depend on the length of the time interval. Therefore, averaging variable time intervals as for the VMPR parameter is not a sensible approach. The VMPRm trend circumvents this limitation, which makes a direct comparison to the FMPR trend possible. The difference between the FMPR and VMPRm trends must be seen in the light of the exclusion criterion applied to the individual values that leads to the overall parameter. Nonexclusion, that is, tracking a patient along the entire length of the interval period, as applied to the FMPR parameter, implies no adherence after the patient’s last acquisition. In contrast, exclusion, that is, removing the patient from consideration after their last acquisition, as applied to the VMPRm parameter, implies the patient leaves the program. There are numerous examples that justify an exclusion scenario eg, when a patient switches to a different medication, changes the pharmacy, deceases or is cured. In contrast, an example for a nonexclusion criterion is when a patient discontinues their medication course.
The rapid decrease in the FMPR trend can be attributed to patients with a limited number of acquisitions within the time interval. The dataset in this study suggests that 24% of patients do not return to the pharmacy after their index date. Therefore, a gradual decrease of the FMPR parameter is observed. FMPR trends generated from patients with two or fewer acquisitions within the interval period display a trend consistently lower than the overall average. In contrast, FMPR trends generated from patients with seven or more acquisitions display a trend consistently higher than the overall average (Figure 4A).
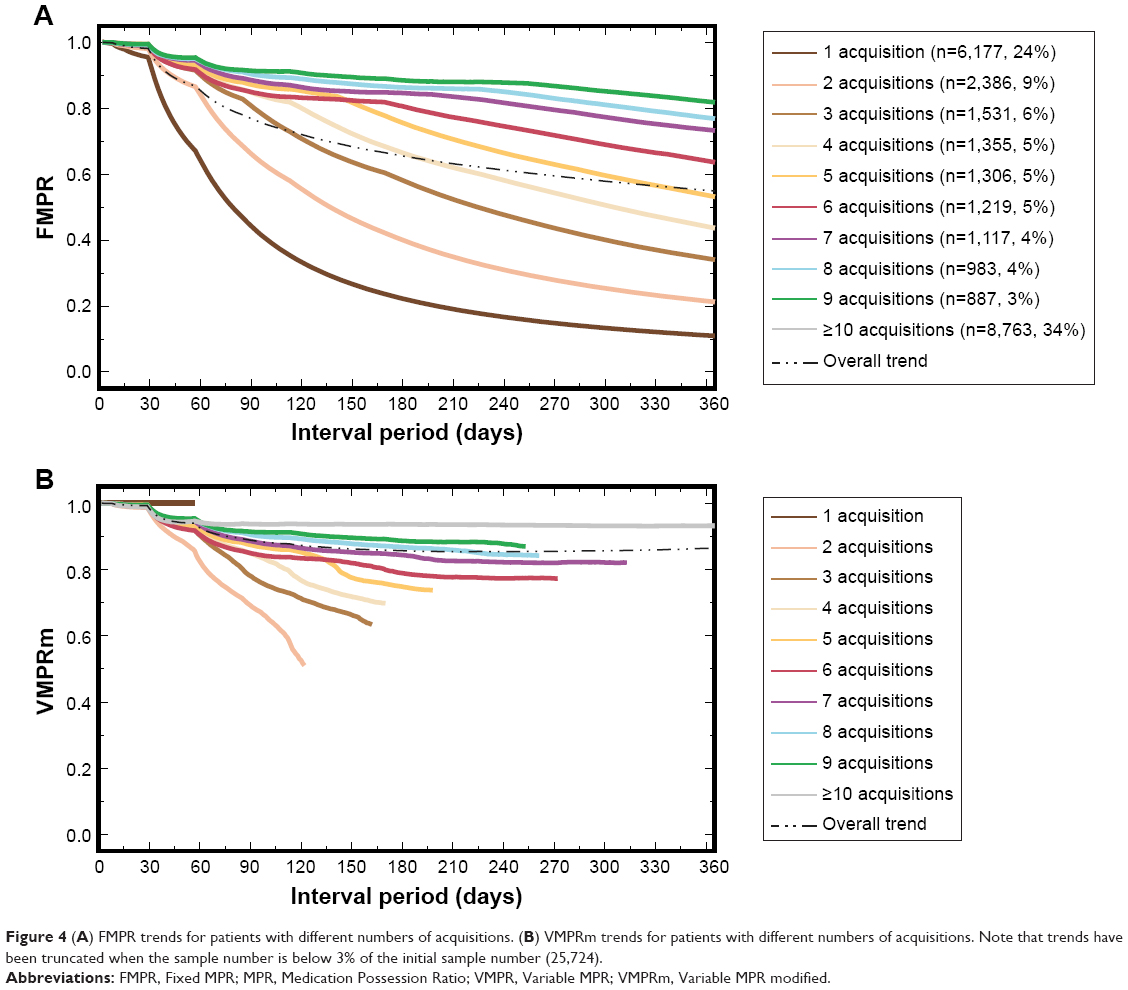 | Figure 4 (A) FMPR trends for patients with different numbers of acquisitions. (B) VMPRm trends for patients with different numbers of acquisitions. Note that trends have been truncated when the sample number is below 3% of the initial sample number (25,724). |
The significantly less rapid decline of the VMPRm trend reflects the fact that medication doses can only be missed between two subsequent acquisitions; hence, the possibility of a discontinuation of the treatment is discarded. Therefore, patients who have visited the pharmacy only once exhibit a perfect adherence, while patients with short gaps between subsequent acquisitions exhibit a good adherence. Therefore, only patients with extended gaps between two subsequent acquisitions contribute to a decrease in the VMPRm parameter. However, the number of these patients is limited. Thus, the decrease in VMPRm parameter is most pronounced within the first days, but decelerates with time until it slowly increases again as the number of patients with more regular acquisitions dominate the average. For this dataset, trends generated for patients with seven or fewer acquisitions consistently plot below the overall average, whereas trends for patients with nine or more acquisitions consistently plot above the overall average (Figure 4B).
Discussion
The VMPRm parameter may be regarded as close to an upper limit as it removes patients who discontinue treatment, while the FMPR may be regarded as close to a lower limit as it removes patients who leave the program. A more realistic value lies in between these two parameters.
One possible approach to estimate a more realistic trend may be through an average of the FMPR and VMPRm trends weighted by sample number (Figure 3). Notably, this study did not have information of the required detail at disposal to confirm that this average reflects an accurate approach to the true adherence measurement. However, removing 7% of all patients, coinciding with the mortality rate of 7% for all cardiovascular diseases,23 produces an FMPR trend which is still below the weighted average trend. Notably, we tested FMPR trends for different age groups and did not find significant differences, suggesting that natural mortality rates have no effect on the trends. A more important factor may be the pharmacy loyalty, that is, the number of patients visiting the pharmacy or going to a different pharmacy for individual acquisitions, as well as the proportion of patients who switch to another cardiovascular medication. We encourage investigators to test this average, for example, through patient interviews or other techniques.
Figure 5 shows how removing patients with only a limited number of acquisitions shifts the overall FMPR parameter significantly up, in particular after eliminating patients with only one single acquisition. It is ubiquitous in the literature that patients are selected with a minimum number of acquisitions, ascertaining the patient is taking part in the program,26,27 although Karve et al14 discourage this approach as it does not take into account early discontinuation of the treatment. Averaging the VMPRm and FMPR parameters is an attempt to find a balance between the two extremes of discontinuing treatment early and leaving the program.
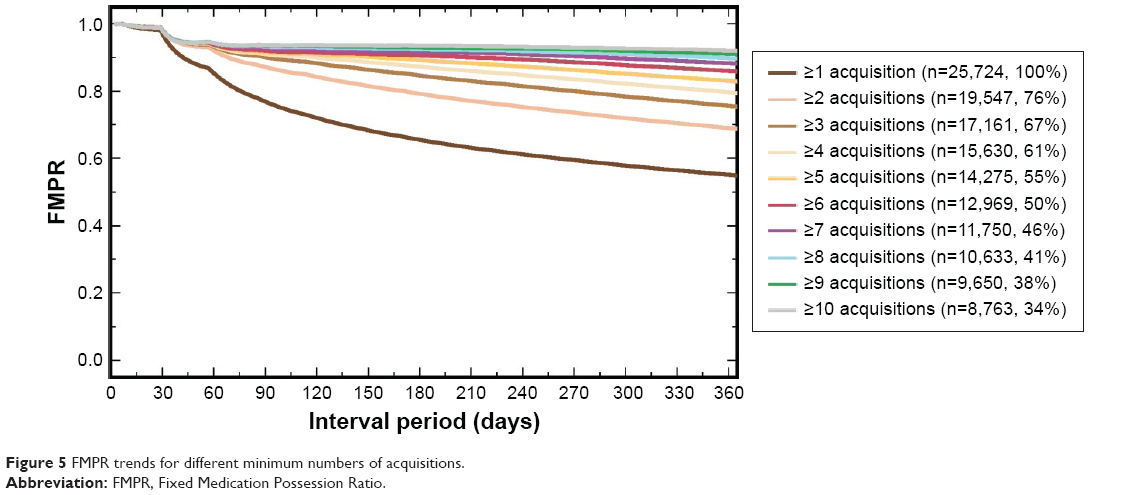 | Figure 5 FMPR trends for different minimum numbers of acquisitions. |
Another type of common filtering is capping individual MPRs at one,15,17,18 which is part of the Proportion of Days Covered definition in Benner.12 On one hand, this kind of filtering may be justified in circumstances where patients return to the pharmacy early without having finished their previous batch, for example, stockpiling or losing medication; on the other hand, overdosing may be a real problem in circumstances where, for example, the medication is difficult to dose, such as in liquids or possibly where the medication is addictive. In cases of overdosing, however, it may be argued that patients exhibit a compliance as poor as underdosing patients not conforming to medical instructions. Allowing MPR values greater than one leads to balancing out MPR values <1. Thus, this approach is masking nonadherence, suggesting perfect adherence. We acknowledge that overdosing patients is less severe an issue to the pharmaceutical industry than to the health system. However, masking the proportion of underdosing patients would also provide the pharmaceutical industry with a false sense of their patient cohort’s behavior.
If, however, overdosing patients needs to be addressed, care must be taken. Overdosing patients may be reported through applying a minimum limit of one, isolating MPRs >1, simply reporting overdosing patents as a proportion, or grouping overdosing and underdosing patients in the same bins depending on their absolute distance to perfect adherence.
For the VMPRm approach, the proportion of overdosing patients in this study is 49% at a time interval of 365 days, resulting in a VMPRm parameter of 0.98 compared to 0.86 when no cut-off is applied. Figure 6A shows a histogram of the individual VMPRm parameters without the cut-off applied. For the FMPR approach, the proportion of overdosing patients in this study is 18% at a time interval of 365 days, resulting in an FMPR parameter of 0.55 compared to 0.57 when no cut-off is applied. Figure 6B shows a histogram of the individual FMPR parameters without the cut-off applied. The smaller change for the FMPR approach is due to the fact that tablet excess can spread out into periods where underdosing exists. These periods are limited to intervals between two subsequent acquisitions for the VMPRm parameter. Notably, the traditional VMPR parameter changes from 0.95 to 0.98 when no cut-off is applied.
 | Figure 6 Histograms of individual (A) FMPR values and (B) VMPRm values for a time interval of 365 days after the patient’s index date and without capping at one. |
Karve et al14 support capping FMPR values at one, although they report that differences between a cap and no cap are limited. This study confirms this finding only for long time intervals and finds capping essential for short time intervals.
The authors acknowledge that filtering, such as removing patients with a limited number of acquisitions or implementing specific caps on individual adherence values, may be a sensible approach when supported by clinical context and data. For example, removing patients with a limited number of acquisitions may be considered in circumstances where a medication is only prescribed for a defined therapy period or where the patient’s medication journey is known, that is, switching habits from one medication to another. Caps on the individual MPR values may be adjusted appropriately when a medication has a range of prescribed doses, such as in inhalers. However, in the absence of strong evidence and pure emphasis on the performance of a specific medication rather than the dispositions of a patient cohort, these filters are discouraged. Notably, information on an individual patient gets lost when calculating an average from a patient cohort. In order to unravel individual-level information, patient cohorts of interest can be isolated and their adherence measurement computed separately. Franklin et al,20 in contrast, do not isolate the patient cohort a priori, but instead cluster similar adherence patterns and subsequently summarize characteristics of the patient cohorts contributing to each cluster. This novel approach can be readily adapted to the individual FMPR and VMPRm values, subsampling the individual trends. However, care must be taken when clustering the VMPRm values, given that their longitudinal trends include different follow-up periods, which impacts the probability of membership to each cluster.20
Finally, this study develops a workflow for establishing an upper and lower bound for the MPR parameter. However, it applies this workflow to only one dataset and does not test these limits with absolute values derived from independent datasets using alternative approaches for measuring adherence. Furthermore, administrative claims data do not allow confirmation of the dispensed quantity of medication that was being ingested and as such, the parameters rather represent refill adherence. It can also not take into account patients who have never acquired their prescribed medication, reflecting an adherence of zero. Various other limitations exist to utilizing administrative claims data that have been discussed in the literature11,15,21 and also apply to this study.
Conclusion
The FMPR and VMPR parameters gradually change with the length of the time interval, and features of the trends are sensitive to the most frequently dispensed acquisition quantities. Thus, a fixed time interval represents an arbitrary cut-off. For a more rigorous investigation of the MPR, we recommend displaying trends rather than static numbers, with the FMPR trend as a lower limit and the VMPRm trend as an upper limit. This gives a better transparency of the adherence measurement and allows a better comparison across studies. Filtering by removing proportions of the patient cohort may change the parameters significantly. Forming a weighted average between the VMPRm and FMPR trends is our recommended alternative approach to filtering the patient cohort using limits to the number of acquisitions. Capping individual FMPR and VMPRm values at one is crucial, in particular, for shorter time intervals. If overdosing needs to be measured, a separate consideration of overdosing and underdosing patients seems to be more sensible.
Acknowledgments
The authors are very grateful to Patient Connect Limited, who fully funded this study. All colleagues at Patient Connect who contributed to this paper are thanked immensely; in particular, the authors would like to thank Zoe Barker and Karine Sa Ferreira for very helpful reviews, as well as three anonymous reviewers.
Disclosure
The authors report no conflicts of interest in this work.
References
Clark MA, ed. Lippincott’s Illustrated Reviews. Pharmacology. 5th ed. Baltimore, MD: Wolters Kluwer Health/Lippincott Williams & Wilkins; 2012. | ||
Sikka R, Xia F, Aubert RE. Estimating medication persistency using administrative claims data. Am J Manag Care. 2005;11(7):449–457. | ||
Cramer JA, Benedict A, Muszbek N, Keskinaslan A, Khan ZM. The significance of compliance and persistence in the treatment of diabetes, hypertension and dyslipidaemia: a review: Compliance in cardiovascular disease. Int J Clin Pract. 2007;62(1):76–87. | ||
Rasmussen JN, Chong A, Alter DA. Relationship between adherence to evidence-based pharmacotherapy and long-term mortality after acute myocardial infarction. JAMA. 2007;297(2):177–186. | ||
Weiden PJ, Kozma C, Grogg A, Locklear J. Partial compliance and risk of rehospitalization among California Medicaid patients with schizophrenia. Psychiatr Serv. 2004;55(8):886–891. | ||
Svarstad BL, Shireman TI, Sweeney JK. Using drug claims data to assess the relationship of medication adherence with hospitalization and costs. Psychiatr Serv. 2001;52(6):805–811. | ||
Muszbek N, Brixner D, Benedict A, Keskinaslan A, Khan ZM. The economic consequences of noncompliance in cardiovascular disease and related conditions: a literature review: Economics of noncompliance in CVD. Int J Clin Pract. 2008;62(2):338–351. | ||
Sokol MC, McGuigan KA, Verbrugge RR, Epstein RS. Impact of medication adherence on hospitalization risk and healthcare cost. Med Care. 2005;43(6):521–530. | ||
Lee TH. Eulogy for a Quality Measure. N Engl J Med. 2007;357(12):1175–1177. | ||
Steiner JF, Prochazka AV. The assessment of refill compliance using pharmacy records: methods, validity, and applications. J Clin Epidemiol. 1997;50(1):105–116. | ||
Andrade SE, Kahler KH, Frech F, Chan KA. Methods for evaluation of medication adherence and persistence using automated databases. Pharmacoepidemiol Drug Saf. 2006;15(8):565–574. | ||
Benner JS. Long-term persistence in use of statin therapy in elderly patients. JAMA. 2002;288(4):455. | ||
Hamilton RA, Briceland LL. Use of prescription-refill records to assess patient compliance. Am J Hosp Pharm. 1992;49(7):1691–1696. | ||
Karve S, Cleves MA, Helm M, Hudson TJ, West DS, Martin BC. Prospective validation of eight different adherence measures for use with administrative claims data among patients with schizophrenia. Value Health. 2009;12(6):989–995. | ||
Hess LM, Raebel MA, Conner DA, Malone DC. Measurement of adherence in pharmacy administrative databases: a proposal for standard definitions and preferred measures. Ann Pharmacother. 2006;40(7–8):1280–1288. | ||
Lam WY, Fresco P. Medication adherence measures: an overview. BioMed Res Int. 2015;2015:1–12. | ||
Halpern MT, Khan ZM, Schmier JK, et al. Recommendations for evaluating compliance and persistence with hypertension therapy using retrospective data. Hypertension. 2006;47(6):1039–1048. | ||
Choudhry NK, Shrank WH, Levin RL, et al. Measuring concurrent adherence to multiple related medications. Am J Manag Care. 2009;15(7):457–464. | ||
Martin BC, Wiley-Exley EK, Richards S, Domino ME, Carey TS, Sleath BL. Contrasting measures of adherence with simple drug use, medication switching, and therapeutic duplication. Ann Pharmacother. 2009;43(1):36–44. | ||
Franklin JM, Shrank WH, Pakes J, et al. Group-based trajectory models: a new approach to classifying and predicting long-term medication adherence. Med Care. 2013;51(9):789–796. | ||
Kozma C, Dickson M, Phillips AL, Meletiche DM. Medication possession ratio: implications of using fixed and variable observation periods in assessing adherence with disease-modifying drugs in patients with multiple sclerosis. Patient Prefer Adherence. 2013;7:509–516. | ||
Karve S, Cleves MA, Helm M, Hudson TJ, West DS, Martin BC. An empirical basis for standardizing adherence measures derived from administrative claims data among diabetic patients: Med Care. 2008;46(11):1125–1133. | ||
Elliott WJ, Plauschinat CA, Skrepnek GH, Gause D. Persistence, adherence, and risk of discontinuation associated with commonly prescribed antihypertensive drug monotherapies. J Am Board Fam Med. 2007;20(1):72–80. | ||
Silva NL, Ribeiro E, Navarro JL, Zanini AC. Compliance with treatment: related-issues and insights for pharmacist intervention. Braz J Pharm Sci. 2011;47(1):1–12. | ||
Fairman KA. Evaluating medication adherence: which measure is right for your program? J Manag Care Pharm. 2000;6(6):499–506. | ||
Avorn J, Monette J, Lacour A, et al. Persistence of use of lipid-lowering medications: a cross-national study. JAMA. 1998;279(18):1458–1462. | ||
Blandford L. Analyzing variations in medication compliance related to individual drug, drug class, and prescribing physician. J Manag Care Pharm. 1999;5(1):47–51. |
 © 2017 The Author(s). This work is published and licensed by Dove Medical Press Limited. The
full terms of this license are available at https://www.dovepress.com/terms
and incorporate the Creative Commons Attribution
- Non Commercial (unported, 3.0) License.
By accessing the work you hereby accept the Terms. Non-commercial uses of the work are permitted
without any further permission from Dove Medical Press Limited, provided the work is properly
attributed. For permission for commercial use of this work, please see paragraphs 4.2 and 5 of our Terms.
© 2017 The Author(s). This work is published and licensed by Dove Medical Press Limited. The
full terms of this license are available at https://www.dovepress.com/terms
and incorporate the Creative Commons Attribution
- Non Commercial (unported, 3.0) License.
By accessing the work you hereby accept the Terms. Non-commercial uses of the work are permitted
without any further permission from Dove Medical Press Limited, provided the work is properly
attributed. For permission for commercial use of this work, please see paragraphs 4.2 and 5 of our Terms.