Back to Journals » International Journal of Nanomedicine » Volume 11
An integrated study on antimicrobial activity and ecotoxicity of quantum dots and quantum dots coated with the antimicrobial peptide indolicidin
Authors Galdiero E ![]() , Siciliano A, Maselli V, Gesuele R, Guida M
, Siciliano A, Maselli V, Gesuele R, Guida M ![]() , Fulgione D, Galdiero S
, Fulgione D, Galdiero S ![]() , Lombardi L
, Lombardi L ![]() , Falanga A
, Falanga A ![]()
Received 7 March 2016
Accepted for publication 11 May 2016
Published 26 August 2016 Volume 2016:11 Pages 4199—4211
DOI https://doi.org/10.2147/IJN.S107752
Checked for plagiarism Yes
Review by Single anonymous peer review
Peer reviewer comments 4
Editor who approved publication: Dr Thomas Webster
Emilia Galdiero,1 Antonietta Siciliano,1 Valeria Maselli,1 Renato Gesuele,1 Marco Guida,1 Domenico Fulgione,1 Stefania Galdiero,2 Lucia Lombardi,3 Annarita Falanga2
1Department of Biology, University of Naples “Federico II”, Naples, Italy; 2Department of Pharmacy and Cirpeb, University of Naples “Federico II”, Naples, Italy; 3Department of Experimental Medicine, Second University of Naples, Naples, Italy
Abstract: This study attempts to evaluate the antimicrobial activity and the ecotoxicity of quantum dots (QDs) alone and coated with indolicidin. To meet this objective, we tested the level of antimicrobial activity on Gram-positive and Gram-negative bacteria, and we designed an ecotoxicological battery of test systems and indicators able to detect different effects using a variety of end points. The antibacterial activity was analyzed against Staphylococcus aureus (ATCC 6538), Pseudomonas aeruginosa (ATCC 1025), Escherichia coli (ATCC 11229), and Klebsiella pneumoniae (ATCC 10031), and the results showed an improved germicidal action of QDs-Ind. Toxicity studies on Daphnia magna indicated a decrease in toxicity for QDs-Ind compared to QDs alone, lack of bioluminescence inhibition on Vibrio fisheri, and no mutations in Salmonella typhimurium TA 100. The comet assay and oxidative stress experiments performed on D. magna showed a genotoxic and an oxidative damage with a dose–response trend. Indolicidin retained its activity when bound to QDs. We observed an enhanced activity for QDs-Ind. The presence of indolicidin on the surface of QDs was able to decrease its QDs toxicity.
Keywords: peptide, quantum dots, ecotoxicity, antimicrobial activity, oxidative stress, genotoxicity
Introduction
Toxicity of manufactured nanoparticles (NPs) to organisms is a subject of great interest due to their increasing use in commercial products and their potential environmental release, which determine their interaction, bioaccumulation, or transfer to the environment.1–5 The toxicity of NPs is theoretically expected to be different from that of traditional materials because of their extremely small size and high surface–volume ratio, and thus raises many concerns about the potential risks of human exposure. The NPs toxicity to organisms might be attributed to three main causes, namely, the presence of NPs, the release of soluble ions, and the generation of free radicals. In fact, some studies have shown that NPs’ toxicity is mainly caused by the release of soluble ions,6 while other studies showed that NPs have the ability to penetrate into cells and migrate to various organs and tissues, causing damage by interacting with functional biomolecular structures; therefore, the toxicity cannot simply be attributed to the dissolved ions.7 Many studies have also showed that NPs could penetrate into the cell and interact with DNA, inducing both DNA damage and chromosome mutations. Given this heterogeneity, regulation will be difficult; nonetheless, the diversity of NPs requires a better understanding of the fundamental processes that affect their interactions with aquatic organisms resulting in toxicity.
Quantum dots (QDs) are a unique class of semiconductors that contain a metallic core (usually Cd-based) with a nanometer diameter (1–10 nm). The surface of the QD is usually coated with different molecules to protect the core from the oxidation and other degradation processes that could release Cd ions into the medium and to achieve specific activities. QDs are among the most exploited NPs showing great promise in nanomedicine for labeling of cellular proteins, cellular imaging, real-time tracking, in vivo animal imaging, and cancer applications;8–11 moreover, QDs can be conjugated to bioactive molecules to target specific biological events. Their wide applicability is correlated to their exceptional optical and electronic properties, which provide significant advantages over traditional fluorescent organic dyes owing to their strong fluorescence at narrow and size-timeble wavelengths, resistance to photobleaching, and electronic and catalytic properties. Although the applications for QDs are rapidly increasing, little is known about the health risks from exposure to these NPs. In fact, their greater diffusion in the environment has led to alarming concerns about their potential long-term toxicity,12,13 which may also generate genotoxic and epigenetic events, chromosome abnormalities, and cellular damage.14
Literature data concerning their toxicity are rather conflicting because of 1) differences in physicochemical properties of each individual type of QDs (such as composition, size, surface charge, and functionalization), 2) lack of toxicology-based studies, and 3) variety of concentration tested.15
Moreover, only a few studies have addressed the ecotoxicological effects of QDs in algae,16 mussels,17 crustaceans,18 and fish.19 The existence of diverse types of QDs presents a further challenge for toxicological evaluation because each individual type presents unique physicochemical properties, which will dominate its interactions with the biological system. Consequently, for each QD, it is necessary to evaluate the biological effects on different organisms and possible mechanisms of interactions.
Previous studies showed that QDs’ toxicity is correlated to the leakage of heavy metals ions,20 the enhancement of reactive oxygen species (ROS) levels,21 and other causes.22 Several studies have evidenced the toxicity in several cellular models. Pace et al23 showed that QDs with thiol stabilizer induced toxicity in Daphnia magna due to the release of Cd ions. Contradictory results obtained from Priester et al24 demonstrated that QDs themselves were more toxic to planktonic Pseudomonas aeruginosa than Cd ions, suggesting that the release of ions is not an exclusive factor. Moreover, physiochemical properties of QDs such as chemical composition, size, surface charge, and surface coating led to toxicity.25 The stability of QDs is another key factor to their toxicity. Mahendra et al26 found that QDs were potentially safe materials at near-neutral pH but exerted toxicity under acid and alkaline conditions. This was proven to be due to the weathering effect in extreme condition that destabilized QDs followed by release of the Cd and selenite ions rapidly.
In addition, Wahab et al27,28 showed the influence of pH, temperature, and concentration on ZnO NPs’ antibacterial properties, which may be correlated to the small pores on bacterial cell wall that facilitate NP penetration and also the production of ROS and reduced cellular antioxidant capacity.
Recently, great efforts have been devoted to the development of more complex QDs with different ligands on their surface; these ligands change the surface properties of the NPs and, as a consequence, change their interactions with the environment. the impact on toxicity of the coating of QDs has been minimally explored. In particular, the coating can promote or prevent aggregation according to the surface charge and increase or decrease their uptake; it may provide protection to test organisms during aqueous toxicity tests, even though QDs exposed to environmental factors, such as photolysis or oxidation, may lose their protective organic coatings and expose their metal core to aqueous organisms.29,30
In the era of increasing resistance to antibiotics, there is considerable interest in the use of NPs as effective antimicrobial agents and/or to enhance the activity of existing molecules.31–35 QDs and other NPs (Ag and Au) are effective antimicrobial agents36 as previously reported; in particular, QDs can generate ROS, which is responsible for microbial cell death.37 The mechanism of the interaction between NPs and bacteria is not well studied. Dwivedi et al38 reported that ZnO NPs exhibit significant inhibitory activity on bacteria and biofilm formation. NPs act as a potential antimicrobial agent and effectively control biofilm formation by affecting bacterial growth in a dose-dependent manner.38 Moreover, the aim of many research groups is to use antimicrobial peptides conjugated to NPs to enhance their activity. Rocephin is an antibiotic that was conjugated to QDs, providing enhanced antimicrobial activity.39 Furthermore, obtaining a nanosystem with enhanced antibacterial activity has to be correlated to the evaluation of risks to human health and the environment under changed conditions.
To establish if the antimicrobial activity of QDs is enhanced by the functionalization with the antimicrobial peptide indolicidin,33 we evaluated the antibacterial activity of QDs and quantum dots-indolicidin (QDs-Ind) against Staphylococcus aureus (ATCC 6538), Pseudomonas aeruginosa (ATCC 1025), Escherichia coli (ATCC 11229), and Klebsiella pneumoniae (ATCC 10031).
The freshwater planktonic microcrustaceans D. magna are cosmopolitan and a keystone species in freshwater food chains and food web, and they are also an excellent bioindicator species for use in environmental monitoring of pollutants; thus, they are routinely employed as a model organism in toxicology, ecology, ecotoxicology, and evolutionary biology.40 They are more sensitive to NPs compared to other forms of aquatic life; this may be due to increased oral exposure from filter feeding. To better understand and to compare the biological effects of QDs and QDs-Ind, we used two different characterization tests performed on D. magna and Vibrio fisheri to obtain further insights into their behavior in aquatic systems. Salmonella typhimurium mutagenicity test that allows the detection of point mutations in prokaryotic organisms, the comet assay, and ROS detection in D. magna were performed to evaluate genotoxicity and oxidative stress. Thus, this study attempts to evaluate the ecotoxicity of QDs alone and coated with an antibacterial peptide.
Material and methods
Materials
Fluorenylmethoxycarbonyl-protected amino acid derivatives, coupling reagents, and Rink amide p-methylbenzhydrylamine resin were purchased from Calbiochem-Novabiochem (Laufelfingen, Switzerland). Other chemicals were purchased from Sigma–Aldrich, Fluka (Buchs, Switzerland), or LabScan (Stillorgan, Ireland) and were used as received, unless otherwise stated. Amine-functionalized QDs were purchased from Evident Technologies.
Peptide synthesis
Indolicidin (Ac-NH-ILPWKWPWWPWRR-COOH) was synthesized using the standard solid-phase 9-fluorenylmethoxycarbonyl method as previously reported41 on a scale of 100 μmol. Briefly, peptides were obtained using a Wang (0.58 mmol/g) resin by consecutive deprotection (30% piperidine) and coupling (2 equivalents of amino acid, 2 equivalents of HOBT/HBTU, and 4 equivalents of DIPEA). Peptides were fully deprotected and cleaved from the resin with trifluoroacetic acid (TFA)/5% thioanisole/3% ethandithiol/2% anisole as scavengers; for 90 minutes. The crude peptide was purified by RP-HPLC on an LC8 Shimadzu high-performance liquid chromatography system (Shimadzu Corporation, Kyoto, Japan) equipped with a UV lambda-Max Model 481 detector using a Phenomenex (Torrance, CA, USA) C18 column eluted with H2O/0.1% TFA (A) and CH3CN/0.1% TFA (B) from 20% to 80% over 20 minutes at a flow rate of 20 mL/min. Purity and identity were assessed by analytical liquid chromatography–mass spectrometry analyses by using Finnigan Surveyor MSQ single quadrupole electrospray ionization (Finnigan/Thermo Electron Corporation San Jose, CA, USA), column: C18-Phenomenex eluted with H2O/0.1% TFA (A) and CH3CN/0.1% TFA (B) from 20% to 80% over 10 minutes at a flow rate of 0.8 mL/min. The purified peptide (purity higher than 98%) was obtained with good yields (50%–60%).
Functionalization of QDs
A solution of peptide, 1-ethyl-3(3-dimethylamino-propyl)-carbodiimide, hydrochloride, and N-hydroxysuccinimide (in molar ratio of 4:4:1) was prepared in phosphate-buffered saline at pH 7.4; and was left to react for 30 min. QDs were conjugated with the preactivated peptide, in MES buffer at pH 5.5 for 3 hours. The obtained QDs-Ind was purified by gel filtration chromatography (Sephadex G50 columns) to eliminate any free indolicidin. The unconjugated peptide was quantified by exploiting the UV absorbance property of the tryptophan residues. The fluorescence spectra of peptide-QDs and unconjugated QDs were measured in a Cary Eclipse Varian fluorescence spectrophotometer at the same conditions to check the QDs concentration. In all the reported experiments, we used the same mother solution for QDs-Ind: 117 nM in QDs and 500 μM in peptide.
For antimicrobial activity experiments, we reported the data as a function of peptide concentration; thus, the minimal inhibitory concentration (MIC) and minimum bactericidal concentration (MBC) are reported for the indolicidin (eg, when indolicidin is 10 μM, QDs concentration is 2.3 nM). For all other studies, we performed the experiments at a QDs concentration ranging from 0.1 to 10 nM, which corresponds to a peptide concentration ranging from 0.4 to 43 μM.
Characterization of QDs and QDs-Ind
To quantify and confirm peptide conjugation to QDs, we performed a UV/vis characterization using a Cary Eclipse Varian spectrophotometer. We assessed the absorbance of tryptophan residues present in the peptide; the measurement was performed over a wavelength range of 800–250 nm. Extinction coefficient at 280 nm in water was 27,500 M−1·cm−1. The mother solutions for QDs-Ind (117 nM in QDs and 500 μM in peptide) and QDs alone (117 nM) were diluted 20 times to perform UV measurements.
To confirm the UV/vis data, we also performed fluorescence measurements using a Cary Eclipse Varian spectrofluorometer. We assessed the emission of tryptophan residues present in the peptide; the measurement was performed over a wavelength range of 300–400 nm.
Dynamic light scattering and zeta potential (ZP) measurements were performed on colloidal dispersions using a Malvern Nanosizer Nano ZS (Malvern Instruments, Worcestershire, UK), with a He–Ne laser 4 mW source operating at 633 nm and the scattering angle fixed at 173°. The measurements were conducted at 25°C, with a pH varying from 2 to 10. All measurements were performed in triplicate for each sample.
Antimicrobial activity (MIC and MBC determination)
The antimicrobial activity of QDs and QDs- Ind was examined against the Gram-positive bacteria S. aureus and the Gram-negative bacteria E. coli and P. aeruginosa, and Klebsiella according to the methods described by the Clinical and Laboratory Standards Institute.42 Briefly, bacterial strains were grown for 18–24 hours at 37°C. A suspension of colonies was made in Mueller–Hinton broth beginning with a 1×10⁸ CFU/mL concentration that was serially diluted tenfold until a 1×10⁶ CFU/mL concentration was reached. About 50 μL of bacterial suspension was added to a 96-microtiter plate containing different concentration of QDs and QDs- Ind and incubated for 24 hours at 37°C in the presence of 5% CO2. The MIC is defined as the lowest concentration of peptide that completely inhibits growth. MBCs were determined at the end of the incubation period by plating 10 μL samples from a well in which there was no visible growth. The MBC was defined as the lowest concentration of antimicrobial agent that produced the 99.9% killing of initial inoculum In accordance with the methods outlined by the national committee for clinical laboratory standards, 1999. The following methods were used for determining bactericidal activity of antimicrobial agents: approved guideline M26-A (National Committee for Clinical Laboratory Standards, Wayne, PA).
Maintenance of D. magna culture
D. magna was cultured in the laboratory of Environmental Toxicology of Federico II of Naples Department of Biology for several generations. Daphnids were maintained in culture medium M443 under a light:dark photoperiod of 16:8 hours at 20°C±2°C; they were fed daily with algae (Selenastrumcapricornutum). The medium was renewed twice a week. Neonates (<24 hours old) were isolated for exposures. These juvenile daphnids were used in the study for the acute toxicity study, ROS assessment, enzymatic studies, mutagenicity study, and genotoxicity assay.
Toxicity tests: D. magna acute test, Vibrio fisheri toxicity test
Acute toxicity test was performed to determine the acute lethal toxicity of QDs and QDs-Ind on D. magna. Four replicates of five daphnids were exposed to 0.3; 0.6; 1.2; 2.5; 5; and 10 nM of QDs and QDs with indolicidin. All details for the acute toxicity test using daphnids were in accordance with OECD 202.44
Immobilization, which was employed as an end point, was detected for 15 seconds after gentle shaking. Water quality parameters such as pH, temperature, and dissolved oxygen were measured in test media before and after 48 hours of exposure. The experiments were performed in triplicate to ensure accurate results. Effective concentration at 50% (EC50) values and 95% CI were estimated in triplicate to ensure accurate results.
Vibrio fischeri (strain NRRL-B-11177) was also used to evaluate toxicity after 30-minute exposure of our samples in accordance with method ISO 11348-3(2007).
The test evaluates the acute toxicity of a sample using the inhibition of the luminescence naturally emitted by the bacterium as the end point. The luminescence was measured with a Microtox luminometer (Model 500, AZUR Environmental) equipped with a cell incubated at 15°C±1°C at a wavelength of 490 nm. The drop in light emission was measured after a contact time of 30 minutes with the test sample, and the temperature during the exposure was 15°C. Tests were carried out in triplicate with a control. The data were statistically processed by the instrument software and the result was expressed as % inhibition (% I).
Salmonella/microsome tests (Ames test)
The Ames test was carried out on Salmonella typhimurium TA100 strains to assess the induction of mutagenicity in a different organism such as bacteria according to Standard Methods for the Examination of Water and Wastewater.45 A range of concentrations from 0.3 to 10 nM of QDs and QDs- Ind was tested to highlight the presence of direct and indirect point mutations; the corresponding Ind concentrations vary from 0.4 to 43 μM. The TA100 strain responds to base-pair substitution mutations.46 The negative control was distilled water; the positive control was sodium azide for TA100 without S9. All experiments were conducted in duplicate and performed twice. The results were expressed as mutagenicity ratio and were obtained by dividing the average revertants/plate by the spontaneous mutation rate. The results were considered positive if two consecutive dose levels of highest nontoxic doses level produced a response at least twice that of the solvent control and at least two of these consecutive doses showed a dose–response relationship.
Comet assay
Genotoxicity is related to an increase of DNA damage as a consequence of the treatment with increasing concentrations of indolicidin. To evaluate whether QDs and QDs-Ind exerted genotoxicity on D. magna, DNA damage and, in particular, DNA strand breaks were determined using a Comet assay. In fact, in vitro genotoxicity tests have gained increasing popularity as a tool supporting environmental risk assessment in vivo and in vitro.47–49
To confirm DNA damage, the alkaline comet assay was performed on D. magna treated with QDs, indolicidin, and QDs- Ind at 0.3, 0.6, 1.2, 2.5, 5, and 10 nM for 48 hours. The Comet assay on D. magna was performed according to the method previously described.47 The alkaline comet assay detects mainly DNA single strand breaks. Treated organisms were suspended in 500 mL of phosphate-buffered saline solution containing 20 mM ethylenediaminetetraacetic acid (EDTA), and 10% Dimethyl sulfoxide (DMSO), and after this they were subjected to mechanic homogenization. The resulting solution was filtered (Sigma–Aldrich, 100 mm mesh) and transferred into a 1.5 mL Eppendorf tube. About 40 mL of the solution was further gently resuspended in 40 mL of low melting point agarose (1%) and then transferred onto degreased microscope slides, previously dipped in normal melting point agarose (1%). After solidification at 4°C for 5 minutes, a second layer of 80 mL low melting point agarose was added. Slides were placed in a lysis solution (2.5 M NaCl, 100 mM EDTA, 10 mM Tris, 1% Triton X-100, pH 7.5) overnight at 4°C to digest both the plasma and the nuclear membranes. Before electrophoresis, slides were incubated for 30 minutes in a freshly prepared alkaline buffer (300 mM NaOH, 1 mM Na2EDTA, disodium salt, pH >13). The slides were drained and placed in a horizontal electrophoresis tank in the same buffer for 30 minutes by applying an electric field of 25 V and adjusting the current to 300 mA. Finally, the slides were gently washed twice in a neutralization buffer (TrisHCl 0.4 M, pH 7.5) for 5 minutes to remove alkali and detergent and stained with 50 μL DAPI (10 μg/mL) (3 hours).
The slides were examined on a fluorescence microscope (Leica DMLB microscope with digital camera Leica DFC340FX, Nussloch, Germany) and images were analyzed from each slide considering a minimum of 50 randomly selected nuclei. Comet images were captured from the center of the slide; overlapping figures were avoided. Quantitative assessment of DNA damage in selected nuclei was performed using Comet Score 1.5 Image Analysis (TriTek Corporation, Sumerduck, VA, USA) software, which computes the integrated intensity profile for each nucleus.
Detection and quantification of ROS
ROS activity was detected using the general oxidative stress cell-permeant 2′,7′dichlorodihydrofluorescein diacetate (H2DCFDA) dye. This dye passively diffuses into the cells and interacts with endogenous esterases, which cleave the diacetate groups. A H2DCFDA stock solution (25 mM in DMSO) was diluted to a final concentration of 10 mM. After 24 hours of exposure to QDs and indolicidin-QDs, only live D. magna were collected for ROS determination. Daphnids were transferred in 1 mL of 10 mM H2DCFDA for 4 hours at 20°C in the dark. Fluorescence was monitored on a fluorescence spectrophotometer, with an excitation wavelength of 350 nm and an emission wavelength of 600 nm. The increase in fluorescence intensity yielded the ROS quantity.
Antioxidant enzyme analysis
After tissue preparation of D. magna, catalase (CAT reduces H2O2 to water) and superoxide dismutase (SOD, converts O2 to H2O2) activities were measured in supernatants after centrifugation (4°C, 20,800× g for 10 minutes). Twenty exposed and nonexposed daphnids were homogenized in 1 mL of sucrose buffer (0.25 M sucrose, 0.1 M Tris-HCl, pH 8.6) and centrifuged.
Protein concentration was quantified spectrophotometrically at 595 nm according to the Bradford method with bovine serum albumin as standard.50
About 1 mL supernatant was used to determine CAT activities using a commercial catalase assay kit (Sigma–Aldrich) following the manufacturer’s protocol. CAT activities were calculated and expressed as a decrease in absorbance at 240 nm due to H2O2 consumption. SOD activity was determined using an SOD assay kit – WST (Sigma–Aldrich) – according to manufacturer’s instructions. The SOD activity (an inhibition activity) was calculated by measuring the decrease in the color development at 440 nm. The antioxidant enzyme activities were presented as mean ± standard errors from three to five replicates.
Data analysis
The software IBM SPSS Statistics® version 21 (Armonk, NY, USA) was used for statistical analysis. The distribution of TM median values obtained from Comet Assay on untreated samples (controls) was analyzed by Shapiro–Wilk and Kolmogorov–Smirnov tests.50–52 To compare the results obtained from assays on samples subjected to different treatments, Levene’s53 test was first applied to evaluate variance homogeneity. When homoscedasticity was verified, comparison was performed by analysis of variance (ANOVA). In the case of nonhomogeneous variances, Kruskal–Wallis nonparametric test was applied.54
The statistical analysis applied to physiological responses and fitness parameters has been calculated with GraphPad Prism 6 (GraphPad Software, Inc., La Jolla, CA, USA). The significance of differences between average values of different experimental treatments and controls was assessed by ANOVA, considering a significance threshold level always set at 5%. When ANOVA revealed significant differences among treatments, post hoc tests were carried on with Dunnett’s method and Tukey’s test.
Result and discussion
Characterization of QDs and QDs-Ind
To quantify and confirm peptide conjugation to QDs, UV/vis and fluorescence spectrophotometric assessing the tryptophan residues present in the peptide (Figure 1A and B). Both analyses allowed us to confirm the conjugation of the peptide on the QDs and to determine the concentration of the mother solution. In particular, the mother solutions for QDs-Ind were 117 nM in QDs and 500 μM in peptide and for QDs alone were 117 nM.
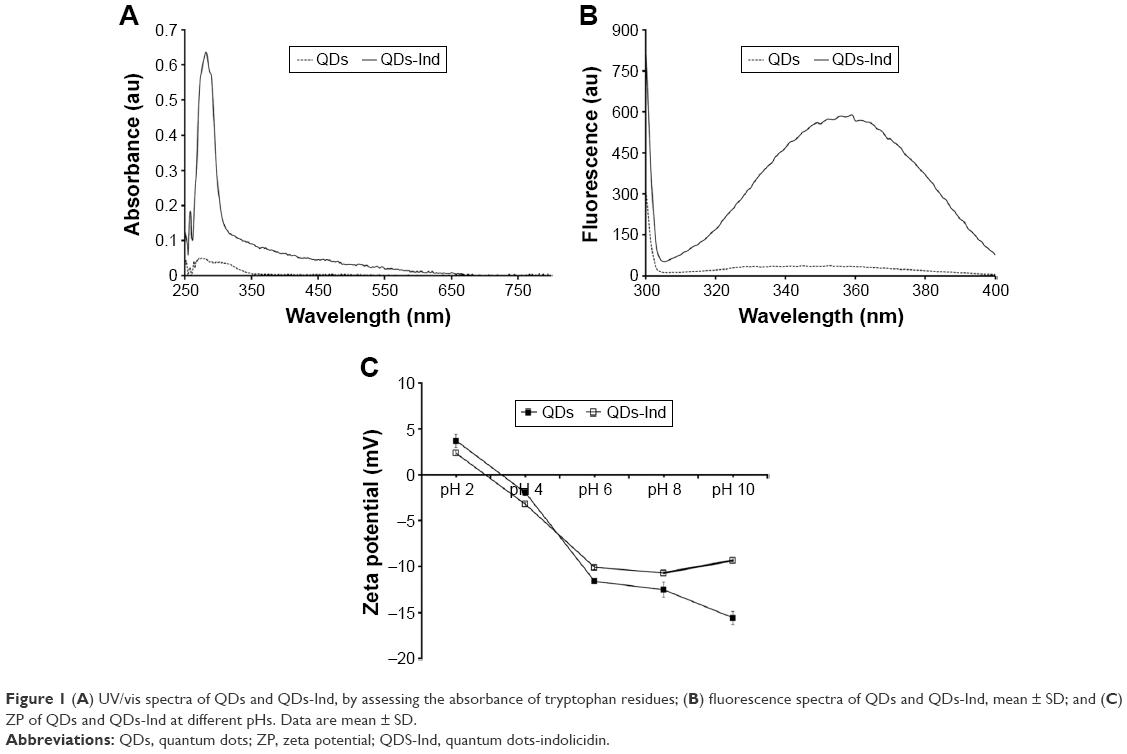 | Figure 1 (A) UV/vis spectra of QDs and QDs-Ind, by assessing the absorbance of tryptophan residues; (B) fluorescence spectra of QDs and QDs-Ind, mean ± SD; and (C) ZP of QDs and QDs-Ind at different pHs. Data are mean ± SD. |
Dynamic light scattering and ZP measurements were performed to determine the size of the NPs and their stability. Table 1 lists the dimensions of the NPs at the concentrations used in the experiments. The ZP measurements performed at a pH range from 2 to 10 showed that the compounds were stable. The experiments were also performed after 24 and 72 hours, showing no change in size and colloidal stability (data not shown).
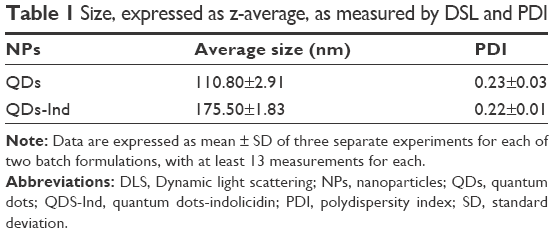 | Table 1 Size, expressed as z-average, as measured by DSL and PDI |
Antibacterial activity
Antibacterial activity of QDs with and without indolicidin against human pathogens (Gram-positive and Gram-negative bacteria) was analyzed calculating MIC and MBC. Determination of MIC values of QDs, QDs-Ind, and indolicidin was carried out using model bacteria strains: the Gram-positive bacteria S. aureus ATCC 6538 and the Gram-negative bacteria E. coli ATCC 11229, P. aeruginosa ATCC 1025, and Klebsiella ATCC 10031. Table 2 reports the MICs obtained. The inhibitory activity was slightly increased with the QDs-Ind compared to QDs and indolicidin alone, indicating that the coating of QDs with indolicidin is important for the overall antibacterial mechanism. It has been previously reported that QDs are generally more active against Gram-negative compared to Gram-positive bacteria, and our results are in line with these observations. The different antibacterial activity has been attributed to the differences in membrane organization and overall molecular composition of the bacterial cell wall and as a consequence of the direct interaction bacteria with the NPs.58 Gram-positive and Gram-negative bacteria are both characterized by an overall negative charge due to the presence of teichoic acids in the former and lipopolysaccharides in the outer membrane of the latter. There was no major difference between bactericidal and inhibitory concentrations of the QDs and QDs-Ind. MBC values showed a similar trend to MIC values. Figure 2 and Table 3 demonstrate the percentage of reduction of bacteria growth. We showed that QDs- Ind demonstrated a percentage of bacteria reduction related to an initial inoculum of 35.1±3.0, 29.3±2.7, and 39.3±4.1, respectively, for E. coli, P. aeruginosa, and K. pneumoniae. Only for S. aureus, we observed a low killing ability of 12.3±1.0% for QDs-Ind, but this was always more significant than that for indolicidin alone and QDs alone.
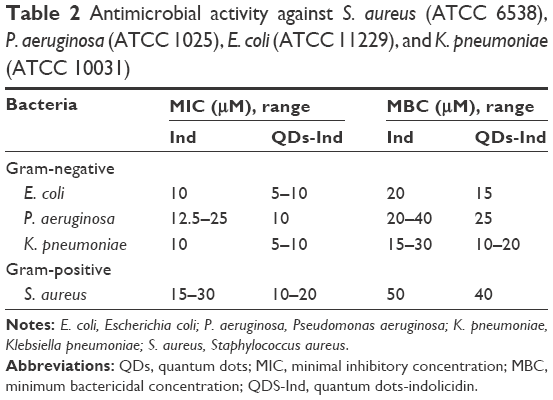 | Table 2 Antimicrobial activity against S. aureus (ATCC 6538), P. aeruginosa (ATCC 1025), E. coli (ATCC 11229), and K. pneumoniae (ATCC 10031) |
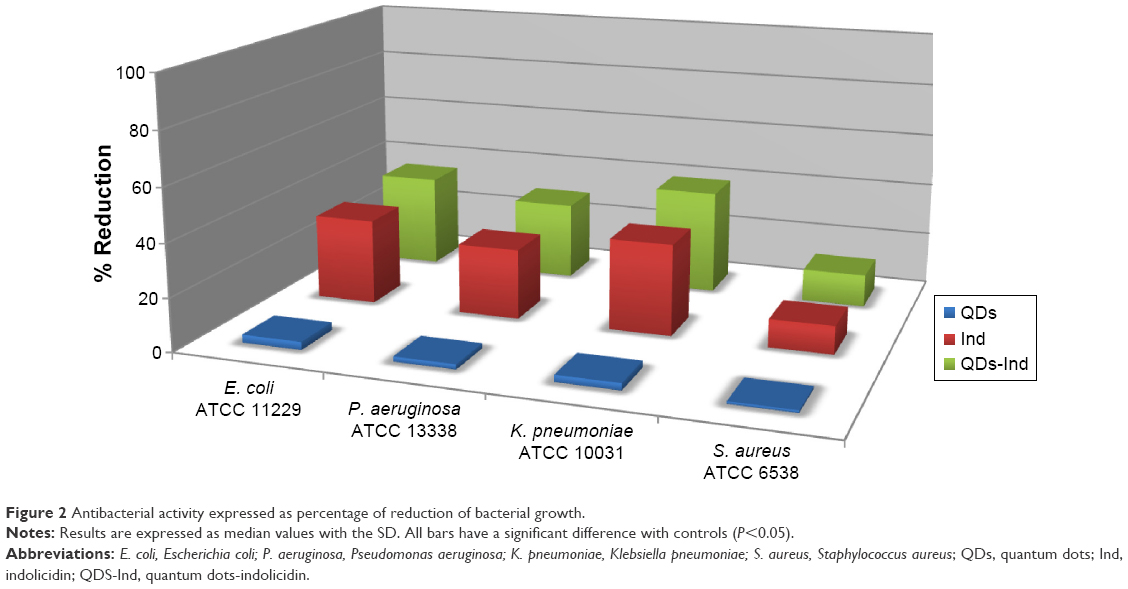 | Figure 2 Antibacterial activity expressed as percentage of reduction of bacterial growth. |
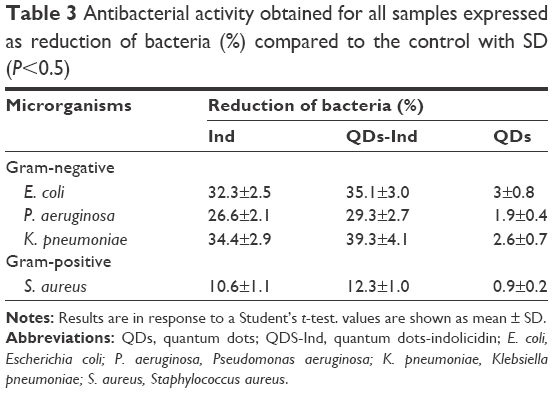 | Table 3 Antibacterial activity obtained for all samples expressed as reduction of bacteria (%) compared to the control with SD (P<0.5) |
Toxicity/genotoxicity studies
Toxicity studies were performed using D. magna. When we exposed daphnids to different concentrations of QDs, acute toxic effects were observed starting from 24 hours of exposure (data not shown) at all assayed concentrations and reached an EC50 of 67% immobility at 48 hours. The 67% decrease in the survival after 48 hours of exposure was obtained at a concentration of 10 nM (Figure 3). Percentage of bacteria reduction related to an initial inoculum, QDs-Ind showed an EC50 not determinable and an EC10 of 2.17 nM with 95% CI between 1.01 and 4.67.
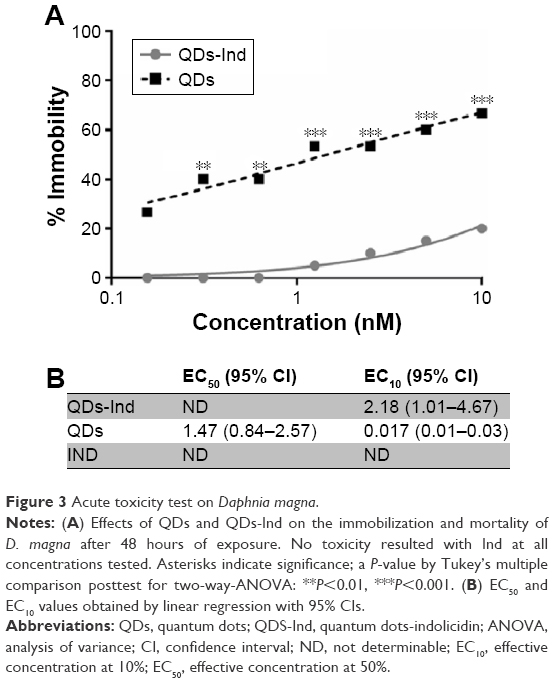 | Figure 3 Acute toxicity test on Daphnia magna. |
At the end of the exposure time, when we compared acute toxicity of QDs with that of QDs-Ind, we observed a decrease of mortality at each concentration tested, ranging from no mortality at lower concentrations to 20% at 10 nM. We did not notice toxicity when we used indolicidin alone at any of the concentrations.
As shown in Figure 4, bacterial luminescence was inhibited in both cases, reaching rates between 35% and 40% at the highest concentrations tested. For QDs-Ind, we noticed a bioluminescence decrease with a dose–response trend, while for QDs the decrease of bioluminescence showed constant values. As for the toxicity of indolicidin, we noticed a lack of bioluminescence inhibition at all concentrations tested (reaching only 9% of inhibition), which corresponds to no significant toxicity. According to previous studies,55 QDs’ internalization and aggregation could affect the metabolic activity of the bacteria, which can cause a decrease in luminescence.
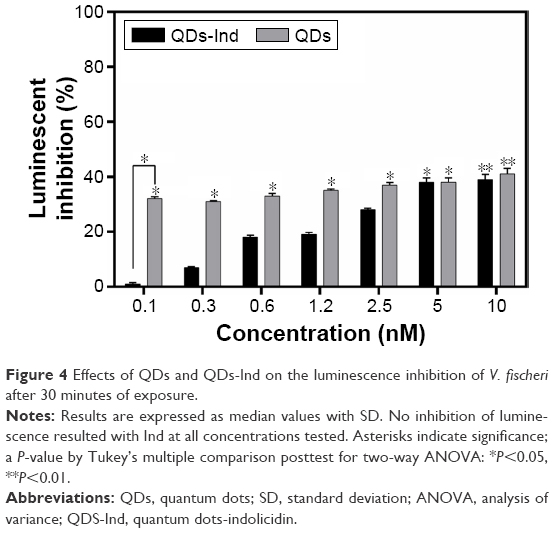 | Figure 4 Effects of QDs and QDs-Ind on the luminescence inhibition of V. fischeri after 30 minutes of exposure. |
None of the samples exhibited mutagenicity in the bacterial test on TA100 strain at the doses used. In fact, when we calculated mutagenic ratio for QDs, QDs-Ind, and indolicidin alone, all showed a value lower than 2, which was calculated from the ratio between the number of S. typhimurium revertants grown in the presence of the tested samples and the number of spontaneously appearing revertants showing no mutagenicity effect (Table 4).
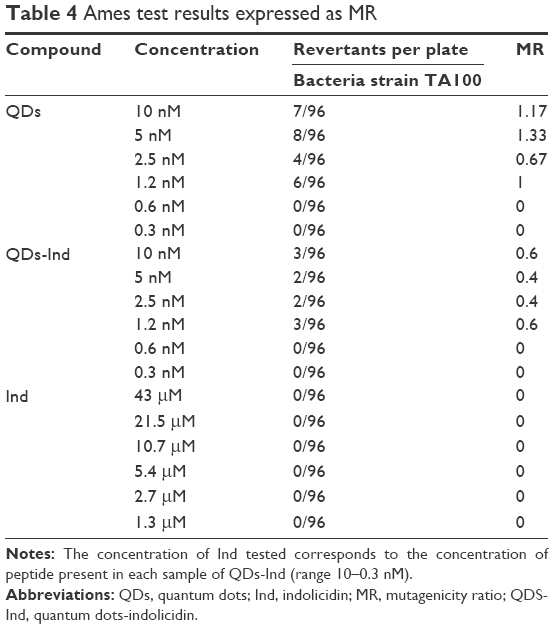 | Table 4 Ames test results expressed as MR |
Oxidative stress and DNA strand breaks were also examined. Oxidative stress is important because it can damage many important biomolecules, including DNA and proteins.56 To address harmful effects of ROS, living cells are equipped with numerous defense mechanisms, including the induction of antioxidant enzymes like SOD, CAT, and others. These enzymes can be also used as biomarkers that suggest oxidative stress. Oxidative stress, as determined by ROS quantification with H2DCFDA and normalized with untreated controls, was significantly induced in Daphnia treated with lower concentration QDs-Ind compared to higher concentrations, showing a completely different trend from genotoxicity as detailed later. On the contrary, ROS production was constant in Daphnia treated with QDs and indolicidin alone. For all samples, the increase was observed even within 24 hours (Figure 5).
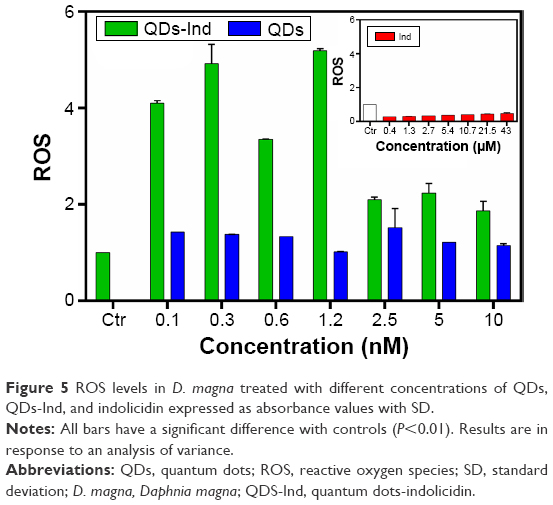 | Figure 5 ROS levels in D. magna treated with different concentrations of QDs, QDs-Ind, and indolicidin expressed as absorbance values with SD. |
Our treatments resulted in significant alterations of SOD activity after 24 hours of exposure. In fact, SOD constitutes the first line of defense against ROS. The enzyme level increases in a concentration-dependent manner in samples treated with QDs and QDs-Ind, from low concentrations to high concentration, showing activation similar to ROS production. The greatest increase in SOD activity was observed at lower concentrations for QDs and for QDs-Ind, showing a similar trend to ROS increase. In contrast, the SOD activity was always the same in samples treated with indolicidin alone at all concentrations tested (Figure 6).
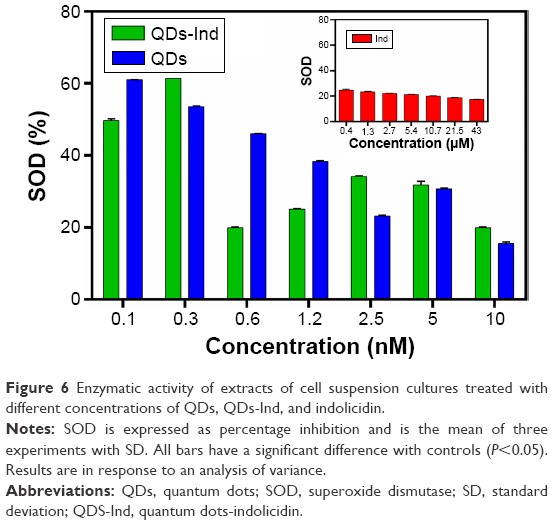 | Figure 6 Enzymatic activity of extracts of cell suspension cultures treated with different concentrations of QDs, QDs-Ind, and indolicidin. |
Indolicidin and QDs-Ind exhibited the capacity to alter CAT content. In fact, there was a significant increase of CAT in both samples at each concentration tested. In addition, QDs alone showed an increase of CAT activation following a dose–response trend (Figure 7).
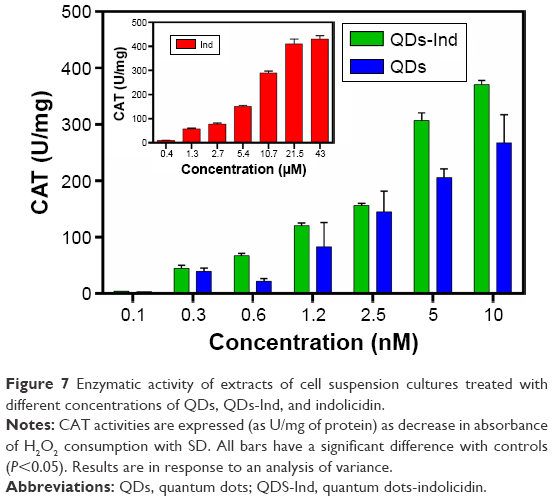 | Figure 7 Enzymatic activity of extracts of cell suspension cultures treated with different concentrations of QDs, QDs-Ind, and indolicidin. |
These activations seem to be dose dependent and serve to prevent accumulation of H2O2 and O2 when cells are exposed to QDs-Ind and indolicidin alone. The increase of CAT activity is inversely proportional to ROS increase.
The balance between ROS and antioxidants is essential for the survival of organisms even if other forms of injury such as DNA damage may also occur.
DNA damage (tail moment) evaluated in D. magna exposed for 48 hours to indolicidin, QDs, and QDs-Ind showed significant genotoxicity with a dose–response trend (Figure 8). Samples with 10, 5, 2.5, 1.2, 0.6, and 0.3 nM of indolicidin alone exhibited a lower DNA damage, not statistically different from control (with 0.3 nM indolicidin). Instead, the data demonstrated that samples treated with QDs were characterized by higher genotoxicity in comparison to untreated control samples. As shown in Figure 6, the presence of QDs-Ind induced a significant decrease of DNA damage at low concentrations (0.3–2.5 nM). Tail moments increased in D. magna exposed to higher doses of QDs-Ind (5–10 nM).
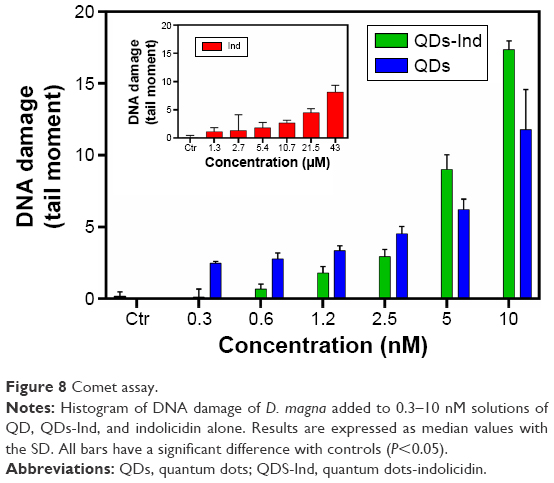 | Figure 8 Comet assay. |
Median values for control samples were significantly lower after treatment (P<0.001 Kruskal–Wallis ANOVA rank model). Nonparametric test was used to evaluate the difference in time-dependent cell responses for different indolicidin concentrations. We found a statistically significant difference between the Tail Moment (TM) of each population and the control (P<0.001, Kruskal–Wallis test,57 each population versus control) except for indolicidin and QDs at 0.3 nM.
A correlation analysis is reported in Table 5 with Pearson’s coefficient. We can conclude that using two different bioindicators we observed a good correlation of results with P<0.05; moreover, the comet results are also significant as shown by the value of R (R=1).
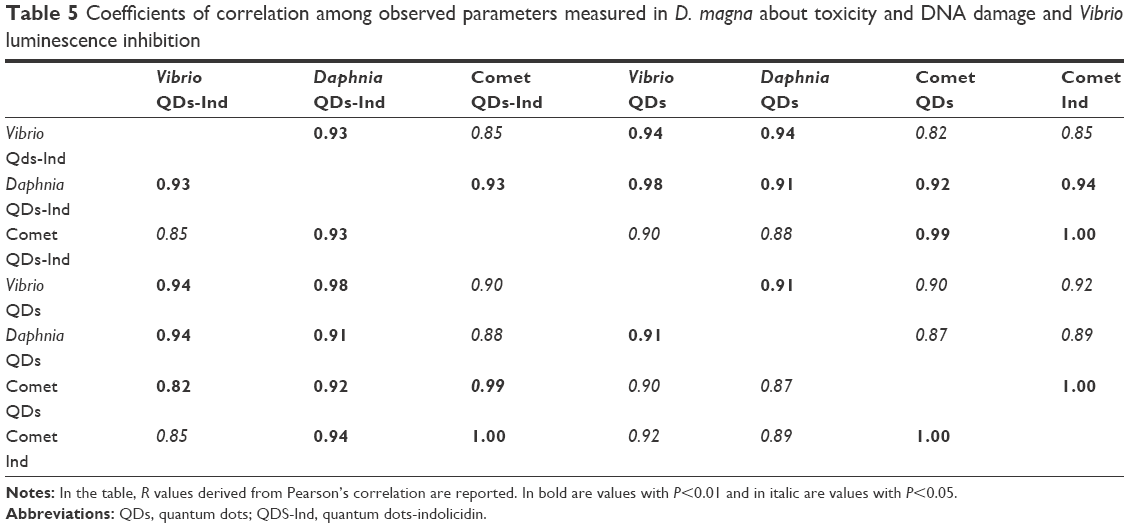 | Table 5 Coefficients of correlation among observed parameters measured in D. magna about toxicity and DNA damage and Vibrio luminescence inhibition |
Conclusion
The aim of this study was to evaluate the ecotoxicity of QDs (coated or uncoated with an antimicrobial peptide). Moreover, we also evaluated the antimicrobial activity of the peptide indolicidin conjugated to NPs such as QDs, which are able to penetrate into cells and reach various organs and tissues.
To meet this objective, we tested the level of antimicrobial activity on Gram-positive and Gram-negative bacteria and designed an ecotoxicological battery of test systems and indicators able to detect different effects using a variety of end points. Such a battery of test systems and indicators would be representative of a wide range of organisms. The systems studied included the immobilization of D. magna, bioluminescence inhibition in the marine bacterium V. fisheri, the mutagenicity activity of S. typhimurium TA100, genotoxicity and analysis of ROS, and antioxidant enzyme activity on D. magna. The development of toxicological models has been an invaluable step toward predictive toxicology, but engineered NPs not following elemental physicochemical properties, especially when functionalized with peptides, represent a new challenge in this field. It was previously reported that QDs could be transfer through biomagnification to higher trophic levels. Moreover, studies in vivo and in vitro have demonstrated that QDs induced ROS and lipid peroxidation, disturbed DNA function, increased mortality, or led to failure of reproduction in same bioindicators. In this work, we demonstrated that when QDs are functionalized with the antimicrobial peptide indolicidin, the ecotoxicity decreases while the antimicrobial activity improves compared to the QDs and indolicidin separately.
Our results showed that the antimicrobial activity increases, which is probably correlated to an increase of hydrophilicity; in fact, hydrophilicity is one of the crucial parameters responsible for activity of AMPs that allows for its initial interaction with the lipid head groups of the microbial phospholipid bilayer.
Our results further demonstrated that the ecotoxicity of QDs decreases when coated with this peptide. In particular, the crustacean D. magna is sensitive to QDs, showing a dose-dependent curve of immobilization with a mortality of 60% after 48 hours of exposure, while immobilization decreases to 20% when we used QDs- Ind.
A similar result was observed from bioluminescence inhibition using V. fisheri, showing lesser inhibition only at higher concentrations. As for the mutagenicity test, no mutagenicity was observed in all samples tested at every concentration. In contrast to the genotoxic tests, the comet assay showed a dose-dependent response, and comet tails were observed for QDs, QDs-Ind, and indolicidin alone, especially at the highest concentrations tested.
The study of ROS production and the enzyme activation in D. magna after 24 hours of exposure underlined the fact that even at 24 hours of exposure, we observed ROS production with QDs- Ind immediately balanced with the enzyme activation with an increase of SOD and CAT.
In conclusion, QDs are toxic for D. magna, while the complex QDs-Ind has a lower toxicity, but both led to oxidative stress and DNA damage. The overall response pattern observed in our experiments followed a dose–response trend. Cells tend to respond to a genotoxic effect, increasing the enzyme activity. D. magna responded to the oxidative stress caused by the addition of QDs, QDs-Ind, and indolicidin by activating their antioxidant enzyme systems. The complex QDs-Ind showed a greater antibacterial activity, demonstrating an increased efficacy of indolicidin when conjugated to QDs.
Future studies should address the impact of specific factors such as surface area on the increase of antimicrobial activity and decrease of biotoxicity with a better control of each contributing factor.
Acknowledgments
This work was supported in part by grant POR CAMPANIA FSE 2007/2013 WISCh, Work Into Shaping Campania’s Home.
Disclosure
The authors report no conflicts of interests in this work.
References
Benn TM, Westerhoff P. Nanoparticle silver released into water from commercially available sock fabrics. Environ Sci Technol. 2008;42(11):4133. | ||
Klaine SJ, Alvarez PJ, Batley GE, et al. Nanomaterials in the environment: behavior, fate, bioavailability, and effects. Environ Toxicol Chem. 2008;27(9):1825. | ||
Jackson BP, Bugge D, Ranville JF, Chen CY. Bioavailability, toxicity, and bioaccumulation of quantum dot nanoparticles to the amphipod Leptocheirus plumulosus. Environ Sci Technol. 2012;46(10):5550. | ||
Farrell P, Nelson K. Trophic level transfer of microplastic: Mytilus edulis (L.) to Carcinus maenas (L.). Environ Pollut. 2013;177:1–3. | ||
Ma S, Lin D. The biophysicochemical interactions at the interfaces between nanoparticles and aquatic organisms: adsorption and internalization. Environ Sci Process Impacts. 2013;15(1):145. | ||
Zhao J, Wang Z, Liu X, Xie X, Zhang K, Xing B. Distribution of CuO nanoparticles in juvenile carp (Cyprinus carpio) and their potential toxicity. J Hazard Mater. 2011;197:304–310. | ||
Franklin NM, Rogers NJ, Apte SC, Batley GE, Gadd GE, Casey PS. Comparative toxicity of nanoparticulate ZnO, bulk ZnO, and ZnCl2 to a freshwater microalga (Pseudokirchneriella subcapitata): the importance of particle solubility. Environ Sci Technol. 2007;41(24):8484. | ||
Michalet X, Pinaud FF, Bentolila LA, et al. Quantum dots for live cells, in vivo imaging, and diagnostics. Science. 2005;307(5709):538. | ||
Rizvi SB, Ghaderi S, Keshtgar M, Seifalian AM. Semiconductor quantum dots as fluorescent probes for in vitro and in vivo bio-molecular and cellular imaging. Nano Rev. 2010;1:5161. | ||
Zhang S, Jiang Y, Chen CS, et al. Aggregation, dissolution, and stability of quantum dots in marine environments: importance of extracellular polymeric substances. Environ Sci Technol. 2012;46(16):8764. | ||
Falanga A, Vitiello MT, Cantisani M, et al. A peptide derived from herpes simplex virus type 1 glycoprotein H: membrane translocation and applications to the delivery of quantum dots. Nanomedicine. 2011;7(6):925. | ||
Colvin VL. The potential environmental impact of engineered nanomaterials. Nat Biotechnol. 2003;21(10):1166. | ||
Khalili Fard J, Jafari S, Eghbal MA. A review of molecular mechanisms involved in toxicity of nanoparticles. Adv Pharm Bull. 2015;5(4):447. | ||
Aye M, Di Giorgio C, Berque-Bestel I, et al. Genotoxic and mutagenic effects of lipid-coated CdSe/ZnS quantum dots. Mutat Res. 2013;750(1–2):129. | ||
Krug HF. Nanosafety research – are we on the right track? Angew Chem Int Ed Engl. 2014;53(46):12304. | ||
Morelli E, Cioni P, Posarelli M, Gabellieri E. Chemical stability of CdSe quantum dots in seawater and their effects on a marine microalga. Aquat Toxicol. 2012;122–123:153–162. | ||
Gagne F, Auclair J, Turcotte P, et al. Ecotoxicity of CdTe quantum dots to freshwater mussels: impacts on immune system, oxidative stress and genotoxicity. Aquat Toxicol. 2008;86(3):333. | ||
Feswick A, Griffitt RJ, Siebein K, Barber DS. Uptake, retention and internalization of quantum dots in Daphnia is influenced by particle surface functionalization. Aquat Toxicol. 2013;130–131:210–218. | ||
Zhang S, Jiang Y, Chen CS, et al. Ameliorating effects of extracellular polymeric substances excreted by Thalassiosira pseudonana on algal toxicity of CdSe quantum dots. Aquat Toxicol. 2013;126:214–223. | ||
Lewinski N, Colvin V, Drezek R. Cytotoxicity of nanoparticles. Small. 2008;4(1):26. | ||
Slaveykova VI, Startchev K, Roberts J. Amine- and carboxyl- quantum dots affect membrane integrity of bacterium Cupriavidus metallidurans CH34. Environ Sci Technol. 2009;43(13):5117. | ||
Chang E, Thekkek N, Yu WW, Colvin VL, Drezek R. Evaluation of quantum dot cytotoxicity based on intracellular uptake. Small. 2006;2(12):1412. | ||
Pace HE, Lesher EK, Ranville JF. Influence of stability on the acute toxicity of CdSe/ZnS nanocrystals to Daphnia magna. Environ Toxicol Chem. 2010;29(6):1338. | ||
Priester JH, Stoimenov PK, Mielke RE, et al. Effects of soluble cadmium salts versus CdSe quantum dots on the growth of planktonic Pseudomonas aeruginosa. Environ Sci Technol. 2009;43(7):2589. | ||
Geys J, Nemmar A, Verbeken E, et al. Acute toxicity and prothrombotic effects of quantum dots: impact of surface charge. Environ Health Perspect. 2008;116(12):1607. | ||
Mahendra S, Zhu H, Colvin VL, Alvarez PJ. Quantum dot weathering results in microbial toxicity. Environ Sci Technol. 2008;42(24):9424. | ||
Wahab R, Khan F, Mishra YK, Musarrat J, Al-Khedhairy AA. Antibacterial studies and statistical design set data of quasi zinc oxide nanostructures. RSC Adv. 2016;6(38):32328. | ||
Wahab R, Khan F, Yang Yb, et al. Zinc oxide quantum dots: multifunctional candidates for arresting C2C12 cancer cells and their role towards caspase 3 and 7 genes. RSC Adv. 2016;6(31):26111. | ||
Kloepfer JA, Mielke RE, Wong MS, Nealson KH, Stucky G, Nadeau JL. Quantum dots as strain- and metabolism-specific microbiological labels. Appl Environ Microbiol. 2003;69(7):4205. | ||
Derfus AM, Chan WCW, Bhatia SN. Probing the cytotoxicity of semiconductor quantum dots. Nano Lett. 2004;4(1):11. | ||
dos Santos CA, Seckler MM, Ingle AP, et al. Silver nanoparticles: therapeutical uses, toxicity, and safety issues. J Pharm Sci. 2014;103(7):1931. | ||
Franci G, Falanga A, Galdiero S, et al. Silver nanoparticles as potential antibacterial agents. Molecules. 2015;20(5):8856. | ||
Galdiero S, Falanga A, Berisio R, Grieco P, Morelli G, Galdiero M. Antimicrobial peptides as an opportunity against bacterial diseases. Curr Med Chem. 2015;22(14):1665. | ||
Galdiero S, Falanga A, Cantisani M, et al. Microbe-host interactions: structure and role of Gram-negative bacterial porins. Curr Protein Pept Sci. 2012;13(8):843. | ||
Rai M, Kon K, Ingle A, Duran N, Galdiero S, Galdiero M. Broad-spectrum bioactivities of silver nanoparticles: the emerging trends and future prospects. Appl Microbiol Biotechnol. 2014;98(5):1951. | ||
Gaikwad S, Ingle A, Gade A, et al. Antiviral activity of mycosynthesized silver nanoparticles against herpes simplex virus and human parainfluenza virus type 3. Int J Nanomedicine. 2013;8:4303. | ||
Schneider R, Wolpert C, Guilloteau H, Balan L, Lambert J, Merlin C. The exposure of bacteria to CdTe-core quantum dots: the importance of surface chemistry on cytotoxicity. Nanotechnology. 2009;20(22):225101. | ||
Dwivedi S, Wahab R, Khan F, Mishra YK, Musarrat J, Al-Khedhairy AA. Reactive oxygen species mediated bacterial biofilm inhibition via zinc oxide nanoparticles and their statistical determination. PLoS One. 2014;9(11):e111289. | ||
Luo Z, Wu Q, Zhang M, Li P, Ding Y. Cooperative antimicrobial activity of CdTe quantum dots with rocephin and fluorescence monitoring for Escherichia coli. J Colloid Interface Sci. 2011;362(1):100. | ||
Altshuler I, Demiri B, Xu S, Constantin A, Yan ND, Cristescu ME. An integrated multi-disciplinary approach for studying multiple stressors in freshwater ecosystems: daphnia as a model organism. Integr Comp Biol. 2011;51(4):623. | ||
Cantisani M, Leone M, Mignogna E, et al. Structure-activity relations of myxinidin, an antibacterial peptide derived from the epidermal mucus of hagfish. Antimicrob Agents Chemother. 2013;57(11):5665. | ||
CLSI. Methods for Dilution Antimicrobial Susceptibility Tests for Bacteria That Grow Aerobically; Approved Standard. 9th ed. Wayne, PA: Clinical and Laboratory standard Institute; 2012. | ||
Elendt BP, Bias WR. Trace nutrient deficiency in Daphnia magna cultured in standard medium for toxicity testing. Effects of the optimization of culture conditions on life history parameters of D. magna. Water Res. 1990;24(9):1157. | ||
OECD. OECD Guidelines for Testing of Chemicals; Test No. 202: Daphnia sp., acute immobilization test. 2004. | ||
APHA. Standard Method for the Examination of Water and Wastewater. Washington, DC: American Public Health Association/American Water Works Association/Water Environmental Federation; 1998. | ||
Maron DM, Ames BN. Revised methods for the Salmonella mutagenicity test. Mutat Res. 1983;113(3–4):173. | ||
Galdiero E, Maselli V, Falanga A, et al. Integrated analysis of the ecotoxicological and genotoxic effects of the antimicrobial peptide melittin on Daphnia magna and Pseudokirchneriella subcapitata. Environ Pollut. 2015;203:145–152. | ||
D’Onofrio G, Tramontano F, Dorio AS, et al. Poly(ADP-ribose) polymerase signaling of topoisomerase 1-dependent DNA damage in carcinoma cells. Biochem Pharmacol. 2011;81(2):194. | ||
Maselli V, Polese G, Rippa D, Ligrone R, Kumar Rastogi R, Fulgione D. Frogs, sentinels of DNA damage induced by pollution in Naples and the neighbouring provinces. Ecotoxicol Environ Saf. 2010;73(7):1525. | ||
Bradford MM. A rapid and sensitive method for the quantitation of microgram quantities of protein utilizing the principle of protein-dye binding. Anal Biochem. 1976;72:248–254. | ||
Shapiro SS, Wilk MB. An analysis of variance test for normality (complete samples). Biometrika. 1965;52(3/4):591–611. | ||
Kolmogoroff A. Confidence limits for an unknown distribution function. Ann Math Statist. 1941;12(4):461–463. | ||
Levene H. Robust tests for equality of variances. In: Olkin I, Ghurye SG, Hoeffding W, Madow WG, Mann HB, editors. Contributions to Probability and Statistics: Essays in Honor of Harold Hotelling. Stanford, CA: Stanford University Press; 1960:278. | ||
Kruskal WH, Wallis WA. Use of ranks in one-criterion variance analysis. J Am Stat Assoc. 1952;47(260):583–621. | ||
Wang L, Zheng H, Long Y, et al. Rapid determination of the toxicity of quantum dots with luminous bacteria. J Hazard Mater. 2010;177(1–3):1134. | ||
Halliwell B, Gutteridge J. Free Radicals in Biology and Medicine. New York, NY: Oxford University Press; 1999:86. | ||
Lovell DP, Omori T. Statistical issues in the use of the comet assay. Mutagenesis. 2008;23(3):171. | ||
Ananth DA, Rameshkumar A, Jeyadevi R, et al. Antibacterial potential of rutin conjugated with thioglycolic acid capped cadmium telluride quantum dots (TGA-CdTe QDs). 2015. Spectrochimica acta part A: molecular and biomolecular spectroscopy. 138:684–692. |
 © 2016 The Author(s). This work is published and licensed by Dove Medical Press Limited. The
full terms of this license are available at https://www.dovepress.com/terms
and incorporate the Creative Commons Attribution
- Non Commercial (unported, 3.0) License.
By accessing the work you hereby accept the Terms. Non-commercial uses of the work are permitted
without any further permission from Dove Medical Press Limited, provided the work is properly
attributed. For permission for commercial use of this work, please see paragraphs 4.2 and 5 of our Terms.
© 2016 The Author(s). This work is published and licensed by Dove Medical Press Limited. The
full terms of this license are available at https://www.dovepress.com/terms
and incorporate the Creative Commons Attribution
- Non Commercial (unported, 3.0) License.
By accessing the work you hereby accept the Terms. Non-commercial uses of the work are permitted
without any further permission from Dove Medical Press Limited, provided the work is properly
attributed. For permission for commercial use of this work, please see paragraphs 4.2 and 5 of our Terms.