Back to Journals » International Journal of Nanomedicine » Volume 9 » Issue 1
An in vitro evaluation of graphene oxide reduced by Ganoderma spp. in human breast cancer cells (MDA-MB-231)
Authors Gurunathan S ![]() , Han JW, Park JH, Kim J
, Han JW, Park JH, Kim J ![]()
Received 17 November 2013
Accepted for publication 27 December 2013
Published 8 April 2014 Volume 2014:9(1) Pages 1783—1797
DOI https://doi.org/10.2147/IJN.S57735
Checked for plagiarism Yes
Review by Single anonymous peer review
Peer reviewer comments 3
Sangiliyandi Gurunathan,1,2 JaeWoong Han,1 Jung Hyun Park,1 Jin Hoi Kim1
1Department of Animal Biotechnology, Konkuk University, Seoul, South Korea; 2GS Institute of Bio and Nanotechnology, Coimbatore, Tamilnadu, India
Background: Recently, graphene and graphene-related materials have attracted much attention due their unique properties, such as their physical, chemical, and biocompatibility properties. This study aimed to determine the cytotoxic effects of graphene oxide (GO) that is reduced biologically using Ganoderma spp. mushroom extracts in MDA-MB-231 human breast cancer cells.
Methods: Herein, we describe a facile and green method for the reduction of GO using extracts of Ganoderma spp. as a reducing agent. GO was reduced without any hazardous chemicals in an aqueous solution, and the reduced GO was characterized using a range of analytical procedures. The Ganoderma extract (GE)-reduced GO (GE-rGO) was characterized by ultraviolet-visible absorption spectroscopy, X-ray diffraction, Fourier-transform infrared spectroscopy, X-ray photoelectron spectroscopy, dynamic light scattering, scanning electron microscopy, Raman spectroscopy, and atomic force microscopy. Furthermore, the toxicity of GE-rGO was evaluated using a sequence of assays such as cell viability, lactate dehydrogenase leakage, and reactive oxygen species generation in human breast cancer cells (MDA-MB-231).
Results: The preliminary characterization of reduction of GO was confirmed by the red-shifting of the absorption peak for GE-rGO to 265 nm from 230 nm. The size of GO and GE-rGO was found to be 1,880 and 3,200 nm, respectively. X-ray diffraction results confirmed that reduction processes of GO and the processes of removing intercalated water molecules and the oxide groups. The surface functionalities and chemical natures of GO and GE-rGO were confirmed using Fourier-transform infrared spectroscopy and X-ray photoelectron spectroscopy. The surface morphologies of the synthesized graphene were analyzed using high-resolution scanning electron microscopy. Raman spectroscopy revealed single- and multilayer properties of GE-rGO. Atomic force microscopy images provided evidence for the formation of graphene. Furthermore, the effect of GO and GE-rGO was examined using a series of assays, such as cell viability, membrane integrity, and reactive oxygen species generation, which are key molecules involved in apoptosis. The results obtained from cell viability and lactate dehydrogenase assay suggest that GO and GE-rGO cause dose-dependent toxicity in the cells. Interestingly, it was found that biologically derived GE-rGO is more toxic to cancer cells than GO.
Conclusion: We describe a simple, green, nontoxic, and cost-effective approach to producing graphene using mushroom extract as a reducing and stabilizing agent. The proposed method could enable synthesis of graphene with potential biological and biomedical applications such as in cancer and angiogenic disorders. To our knowledge, this is the first report using mushroom extract as a reducing agent for the synthesis of graphene. Mushroom extract can be used as a biocatalyst for the production of graphene.
Keywords: reduced graphene oxide, Raman spectroscopy, X-ray diffraction, UV-visible spectroscopy
Introduction
Graphene is a single-atom-thick, two-dimensional sheet of hexagonally arranged carbon atoms packed into a honeycomb lattice, and is of great interest in the fields of materials science, physics, and chemistry.1–3 Due its unique physical, chemical, and biocompatibility properties, graphene has been used in various applications, including biosensing,3 diagnosis,4 antibacterial development,5–8 antiviral material development,9 and cancer targeting.10 Recently, graphene family nanomaterials (GFNs) have been explored in several applications in the field of nanobiotechnology and in biomedical applications due to their unique intrinsic properties.11 Liu et al developed a highly soluble NGO–PEG–SN38 (nano-graphene oxide-polyethylene glycol readily complexes with a water insoluble aromatic molecule SN38) complex that exhibited high cancer cell-killing potency similar to that of the free SN38 molecules in organic solvents.12 Due to increasing demand for graphene materials, researchers in both academic fields and in industry have explored the possibility of using nontoxic and ecofriendly biological materials for reduction and functionalization of graphene oxide (GO). Several research groups have established various methods for the synthesis of graphene and its derivatives, including exfoliation of graphite (Gt),13 flash reduction,14 hydrothermal dehydration,15 mechanical exfoliation,16 epitaxial growth,17 photocatalysis,18 and photodegradation.19 Liu et al20 developed a one-step electrochemical exfoliation of ionic liquid-functionalized Gt for the production of homogeneous graphene, bottom-up organic synthesis.21 Subrahmanyam et al22 synthesized graphene flakes including two to four layers in the inner wall region of the arc chamber using arc discharge between Gt electrodes under a mixed atmosphere of hydrogen and helium in different proportions without using any catalyst. Wang et al23 produced large-scale graphene nanosheets using arc evaporation of a Gt rod in the air. Xu and Suslick24 synthesized polystyrene-functionalized graphene using a sonochemical approach. Reduction of GO by chemical methods seems to be promising, due to its low cost and potential for large-scale production, and it is also appropriate for chemical modification and subsequent processing; however, in chemical methods, the usage of hydrazine and hydrazine derivatives as strong reducing agents for formation of graphene can be toxic or explosive and challenging to handle for larger-scale production.6,9 Earlier, several studies reported the production of graphene using various biological systems, such as bacterial respiration,25 poly(allylamine),26 potassium hydroxide,27 polyvinyl pyrrolidone,28 ascorbic acid,29 sugar,30 and baker’s yeast.31 Recently, we and other researchers developed a greener approach for synthesis of graphene using various bacteria, such as Escherichia coli,7,32 Escherichia fergusonii,33 and Bacillus marisflavi.34
The application of graphene materials is dependent on physicochemical properties such as particulate state, number of layers, surface functional groups, surface charge, and size and shape.35 In addition, the toxicity of graphene materials is one of the crucial factors in biomedical applications. The toxicities of carbon and graphene nanomaterials suggest that they can be used as antimicrobial agents, coatings, or products.36 GO and reduced GO (rGO) nanowalls significantly inhibited the growth of Gram-negative E. coli and Gram-positive Staphylococcus aureus.19 Graphene and graphene derivatives effectively inhibited growth of bacteria through direct interaction between extremely sharp edges of graphene sheets and the cell wall membrane of the bacteria. Liu et al37 demonstrated antibacterial activity of GO–silver (Ag) composites and Ag nanoparticles, wherein GO–Ag composites showed a significant effect than Ag nanoparticles. The dose-dependent antibacterial effects of GO and graphene have been reported in E. coli and Pseudomonas aeruginosa.8,38 The cytotoxic effects of graphene incorporated in titanium dioxide film were investigated against Caenorhabditis elegans nematodes, under solar light-induced stress conditions.39 Zhang et al40 studied the effects of graphene and carbon nanotubes (CNTs) in pheochromocytoma (PC-12) cells and found that the CNTs were more toxic than graphene. Wang et al41 reported that the dose-dependent toxicity of single-layer GO sheets in human lung epithelial cells or fibroblasts were caused by internalization of GO into cytoplasm and into membrane-bound vacuoles. Chang et al42 suggested that GO will not enter A549 cells and shows no obvious toxicity to A549 cells, regardless of the size or dose of GO. Liao et al43 reported that the biocompatibility of graphene-related materials depends on physical and chemical properties as well as on the exposure environment. The treatment of few layer graphene with a dose of 10 μg/mL for 24 hours in neuronal cells showed an increased intracellular generation of reactive oxygen species (ROS) and induction of mitochondrial injury.40 Among various nanomaterials, GFNs have been explored in several biomedical applications due to their unique mechanical properties, such as high elasticity, flexibility, and adaptability for tissue engineering.44–46 Singh et al47 reported that the amine-modified graphene showed neither stimulatory nor inhibitory effects on human platelets.
Recently, different types of fungal biomass or extracts have been used as reducing agents for synthesis of Ag and gold nanoparticles, such as those derived from Verticillium,48 Fusarium oxysporum Schlecht,49 Aspergillus fumigatus,50 Penicillium fellutanum,51 and Volvariella volvacea.52 Highly medicinal mushrooms such as Ganoderma neojaponicum Imazeki have been shown to synthesize nanoparticles extracellularly with a resulting size of 5 nm synthesized nanoparticles.53 Ganoderma spp. have a group of bioactive components which have pharmacological properties.54 Therefore, we have taken advantage of these Ganoderma extracts to be used as reducing and stabilizing agents for the reduction of GO. The primary benefits of using fungal extracts are nontoxicity, availability, and absence of toxic waste from the process of synthesis. In addition, mushrooms contain many pharmaceutically important compounds, which have diverse biological activity and the capacity to secrete a large number of active substances, which play an important role as reducing agents for synthesis of Ag and gold nanoparticles. Therefore, we explored the possibility of using Ganoderma spp. for synthesis of graphene. Herein, we describe a green approach to reducing GO in an aqueous solution using mushroom extracts. Further, the effects of as-prepared Ganoderma extract (GE)-rGO in human breast cancer cells were evaluated.
Materials and methods
Materials
Gt powder, NaOH, KMnO4, NaNO3 anhydrous ethanol, 98% H2SO4, 36% HCl, and 30% hydrogen peroxide (H2O2) aqueous solution were purchased from Sigma-Aldrich (St Louis, MO, USA). Penicillin–streptomycin solution, trypsin– ethylenediaminetetraacetic acid solution, Dulbecco’s Modified Eagle’s Medium (DMEM), and 1% antibiotic–antimycotic solution were obtained from Gibco® (Life Technologies, Carlsbad, CA, USA). Fetal bovine serum, in vitro toxicology assay kit was purchased from Sigma-Aldrich.
Culturing and maintenance of Ganoderma spp.
The cultures of Ganoderma spp. were collected from forest near Pollachi, Tamilnadu, India. Culturing and maintenance were followed as described previously.53–55 Briefly, the mycelia were cultured on potato dextrose agar and incubated at 28°C ±2°C for 7 days. The mycelia were then transferred to glucose yeast malt peptone broth. The inoculated medium was incubated at 28°C ±2°C and agitated at 150 rpm for 10 days. After incubation, the mycelia were harvested and washed with distilled water. The mycelia were freeze-dried and stored at 4°C in air-tight containers prior to use.
Preparation of mycelia hot aqueous extract
The preparation of mushroom extract was carried out according to the method described previously.53–55 In brief, the freeze-dried mycelia were soaked in distilled water at a ratio of 1:20 and double-boiled for 30 minutes, left to cool, and filtered through Whatman filter paper No 4. The hot aqueous extract was then freeze-dried at −50°C ±2°C for 48 hours and stored at 4°C in airtight containers. The freeze-dried hot aqueous extract of the mycelia was used as the reducing and stabilizing agent for the reduction of GO.
Synthesis of GO
Synthesis of GO was followed as described previously.8,32–35 In a typical synthesis process, natural Gt powder (2 g) was added to cooled (0°C) H2SO4 (350 mL), and then KMnO4 (8 g) and NaNO3 (1 g) were added gradually while stirring. The mixture was transferred to a 40°C water bath and stirred for 60 minutes. Deionized water (250 mL) was slowly added and the temperature was increased to 98°C. The mixture was maintained at 98°C for a further 30 minutes and the reaction was terminated by the addition of deionized water (500 mL) and 30% H2O2 solution (40 mL). The color of the mixture changed to brilliant yellow, indicating the oxidation of pristine Gt to Gt oxide. The mixture was then filtered and washed with diluted HCl to remove metal ions. Finally, the product was washed repeatedly with distilled water until pH 7.0 was achieved and the synthesized Gt oxide was further sonicated by ultrasonication for 15–30 minutes.
Reduction of GO by GE
Reduction of GO was performed as described previously.8,32–35 In typical synthesis, a mixed aqueous solution containing GO (1 mg/mL) and GE (1 mg/mL) was ultrasonicated for 15 minutes and the mixture was maintained at 40°C for 24 hours. The change of color from yellow-brown to black took place after 24 hours, whereas no color change was observed either in the solution kept without GO or in culture filtrate alone. The mixture was then cooled to room temperature and ultrasonicated for a further 10 minutes. Finally, a homogeneous GE-rGO suspension was obtained without aggregation. After the reduction process, the stable black dispersion was sonicated for 5 minutes to disperse the fungal extract from graphene materials and then centrifuged at 10,000 rpm for 10 minutes to remove fungal extract as a supernatant liquid.
Characterization
Characterization of GO and GE-rGO were carried out according to methods described previously.32–35 Ultraviolet-visible (UV-vis) spectra were recorded using a WPA Biowave II spectrophotometer (Biochrom, Cambridge, UK). The particle sizes of the GO and GE-rGO dispersions were measured using a Zetasizer Nano ZS90 instrument (Malvern Instruments, Malvern, UK). X-ray diffraction (XRD) analyses were performed in a Bruker D8 DISCOVER X-ray diffractometer (Bruker AXS GmBH, Karlsruhe, Germany). The X-ray source was 3 kW with a Cu target, and high-resolution XRD patterns were measured using a scintillation counter (λ =1.5406 Å). The XRD was run at 40 kV and 40 mA, and samples were recorded at 2¸ values between 5° and 80°. The dried powder of GO and GE-rGO was diluted with potassium bromide and recorded Fourier transform infrared spectroscopy (FTIR) (PerkinElmer, Waltham, MA, USA) and spectrum within the range of 500–4,000 cm−1. The chemical bonding of carbon was investigated using X-ray photoelectron spectroscopy (XPS). A JSM-6700F semi-in-lens field emission scanning electron microscope was used to acquire scanning electron microscopy (SEM) images. The solid samples were transferred to a carbon tape held in an SEM sample holder, and then the analyses were performed at an average working distance of 6 mm. Raman spectra of GO and GE-rGO were measured using a WITEC Alpha300 laser with a wavelength of 532 nm. Calibration was initially performed using an internal silicon reference at 500 cm−1 and gave a peak position resolution of less than 1 cm−1. The spectra were measured from 500 to 4,500 cm−1. All samples were deposited onto glass slides in powdered form without using any solvent. Surface images were measured using tapping-mode atomic force microscopy (SPA 400; Seiko Instruments Inc., Chiba, Japan) operating at room temperature. Height and phase images were recorded simultaneously using nanoprobe cantilevers (SI-DF20; Seiko Instruments Inc.).
Cell culture and exposure to GE, GO, and GE-rGO
Cell culture and treatment were followed according to methods described previously.34 MDA-MB-231 human breast cancer cells were kindly provided by Kyung Jin Lee, Institute for Life Sciences, ASAN Medical Center, University of Ulsan College of Medicine, Seoul, South Korea. MDA-MB-231 breast cancer cell lines were grown adherently and maintained in DMEM containing 10% fetal calf serum; and 1% antibiotic solution containing penicillin, and streptomycin at 37°C in 5% CO2. All experiments were performed in six-well plates, unless stated otherwise. Cells were seeded onto the plates at a density of 1×10⁶ cells per well and incubated for 24 hours prior to the experiments. The cells were washed with phosphate-buffered saline ([PBS] pH 7.4) and incubated in fresh medium containing different concentrations of GO and GE-rGO dissolved in water. GO or GE-rGO suspensions were freshly prepared before the cells were exposed, and were diluted to appropriate concentrations from 0 to 150 μg/mL with the culture medium, then immediately applied to the cells. Cells that were not treated with GO or GE-rGO served as controls in each experiment. Similarly, another control experiment was also performed with various concentrations of GE without GO or GE-rGO.
Cell viability assay
WST-8 assay was followed as described previously.34,43 Typically, 1×10⁴ cells were seeded in a 96-well plate and cultured in DMEM supplemented with 10% fetal bovine serum at 37°C under 5% CO2. After 24 hours, the cells were washed twice with 100 μL of serum-free DMEM and incubated with 100 μL of different concentrations of GO or GE-rGO suspensions in serum-free DMEM. After 24 hours’ exposure, the cells were washed twice with serum-free DMEM and 15 μL of WST-8 solution was added to each well containing 100 μL of serum-free DMEM. After a 1 hour incubation at 37°C under 5% CO2, 80 μL of the mixture was transferred to another 96-well plate, because residual GO or GE-rGO can affect the absorbance values at 450 nm. The absorbance of the mixture solutions was measured at 450 nm using a microplate reader. The cell-free control experiments were performed to see if the GO and GE-rGO reacted directly with the WST-8 reagents. Typically, 100 μL of GO or GE-rGO suspensions with different concentrations (0–150 μg/mL) were added to a 96-well plate and 10 μL of WST-8 reagent solution was added to each well; the mixture solution was incubated at 37°C under 5% CO2 for 1 hour. After incubation, the GO or GE-rGO were centrifuged and 50 μL of supernatant was transferred to another 96-well plate. The optical density was measured at 450 nm.
Membrane integrity
Cell membrane integrity of MDA-MB-231 human breast cancer cells was evaluated by determining the activity of lactate dehydrogenase (LDH) leaking out of the cell, according to the manufacturer’s instructions (TOX7 in vitro toxicology assay kit; Sigma-Aldrich) and also as per a method described previously.34 Briefly, cells were exposed to various concentrations of GO and GE-rGO (0–150 μg/mL) for 24 hours and then 100 μL per well of each cell-free supernatant was transferred in triplicate into wells in a 96-well plate, and 100 μL of LDH assay reaction mixture was added to each well. After 3 hours of incubation under standard conditions, the optical density of the color generated was determined at a wavelength of 490 nm using a microplate reader.
Determination of ROS
ROS were estimated according to methods described previously.34 Intracellular ROS were measured based on the intracellular peroxide dependent oxidation of 2′,7′-dichlorodihydrofluorescein diacetate ([DCFH-DA]; Molecular Probes®; Life Technologies) to form the fluorescent compound 2′,7′-dichlorofluorescein, as previously described. Cells were seeded onto 24-well plates at a density of 5×10⁴ cells per well and cultured for 24 hours. After washing twice with PBS, fresh medium containing 100 μg/mL concentrations of GO or GE-rGO was added and the cells incubated for 24 hours, after which 20 μM of DCFH-DA was add to the cells, and incubation continued for 30 minutes at 37°C. The cells were rinsed with PBS, 2 mL of PBS was added to each well, and fluorescence intensity was determined with a spectrofluorometer (Gemini EM) with excitation at 485 nm and emission at 530 nm. For control, 20 μM of DCFH-DA was added to the cells, and the cells were grown for 24 hours without graphene. To determine the effect of N-acetylcystein (NAC) in the presence of graphene, the cells were incubated with 5 mM NAC for 1 hour prior to exposing them to graphene materials or 1 mM H2O2 for 24 hours. DCFH-DA (20 μM) was then added and the cells were incubated for 30 minutes at 37°C before changes in 2′,7′-dichlorofluorescein fluorescence were measured.
Results and discussion
Synthesis and characterization of GO and GE-rGO
Twenty milligrams of mushroom extract powder was added to 20 mL of deionized water and then sonicated for 30 minutes to obtain a homogeneous dispersion. Then, 1 mg/mL of GO was added to 20 mL of GE dispersion (1 mg/mL), and the mixture was kept at 37°C for 24 hours. After reduction, homogeneous black dispersion was obtained (Figure 1, inset), which has been stable for more than 6 months without precipitation. A distinctive color change from brown to black indicates the partial restoration of the π network between the sheets due to removal of the oxygen-containing bonds resulting in electronic conjugation within reduced sheets31–35,39,56,57 and also confirms the reduction of GO. Further, the reduction of GO was proved using UV-vis absorption spectroscopy; the absorption spectra showed that the peak of the GO suspension was around 230 nm, while the absorption peaks of the reduced suspensions shifted into wavelengths of around 260 nm, corresponding to deoxygenation of the GO suspension under the reduction processes.39 After completion of the deoxidization process, the peak was red-shifted to 265 nm and, at the same time, the absorbance in the whole spectral region was increased dramatically (Figure 1). The UV-vis spectrum of the GO solution revealed a characteristic absorption band at 230 nm corresponding to π-π* transitions of the aromatic C=C bond and n-π* transitions of the C=O bond in GO, respectively. After reduction of GO by GE, the peak at 230 nm shifted to 265 nm, which suggests that electronic conjugation was restored (Figure 1). This result also suggests that GO was successfully reduced by GE and that the aromatic structure of graphene may have been restored.31–35 Similar findings were observed at 270.9 nm for Colocasia esculenta leaf aqueous extract-reduced GO and at 268 nm for both Mesua ferrea Linn leaf aqueous extract-reduced GO and Clonorchis sinensis peel aqueous extracts-reduced GO.58 These data indicate that the electronic conjugation was restored. We also examined the absorption spectrum of GE extract, which showed one peak between 550 and 650 nm, which is completely different from the absorption spectra of GO and GE-rGO.
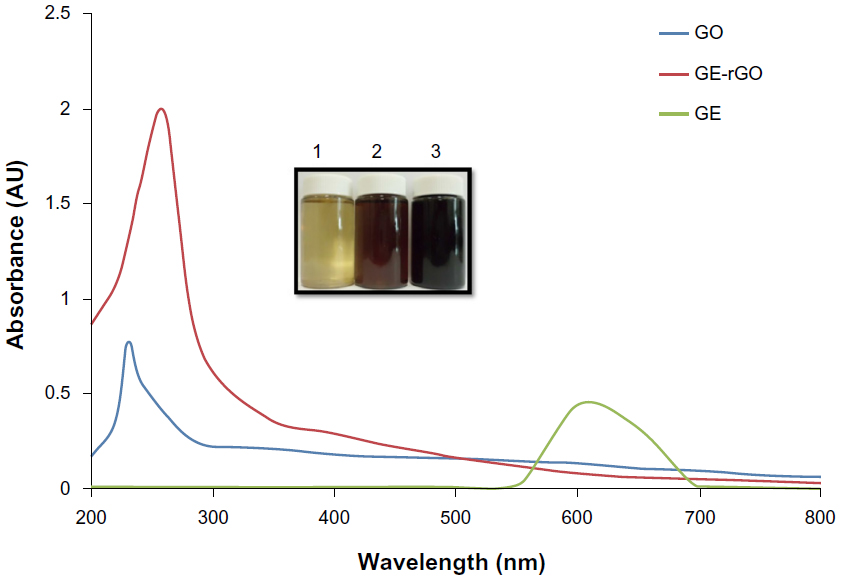 | Figure 1 Synthesis and characterization of GE-rGO by ultraviolet-visible spectroscopy. |
XRD analyses of GO and GE-rGO
The crystal structures of GO and GE-rGO were confirmed using XRD analysis.31–35 Figure 2A and B show the XRD spectra of GO and GE-rGO, respectively. The characteristic peak of GO appeared at 2θ =11.8 nm, corresponding to a d-spacing of 0.74 nm due to the formation of hydroxyl and epoxy and carboxyl groups (Figure 3). In contrast to GO, the GE-rGO showed no peaks at 11.8°, suggesting that most of the oxygen functional groups of GO were removed, while the presence of an intense diffraction peak at around 26.5° suggests that the typical π stacking of the GO was functionalized by GE. This also indicates that the GE played an important role in deoxygenation of GO. The higher interlayer spacing value of exfoliated GO was due to the introduction of numerous oxygenated functional groups on the carbon sheets.6,8,18,19,32 After the exfoliated GO was reduced by GE, a new diffraction peak was observed (2θ =26.5°; d-spacing =0.34 nm). This new and sharp peak at 2θ =26.5° indicates a highly organized crystal structure with an interlayer spacing of 0.34 nm (Figure 2B). Our results are in agreement with earlier results.12,59
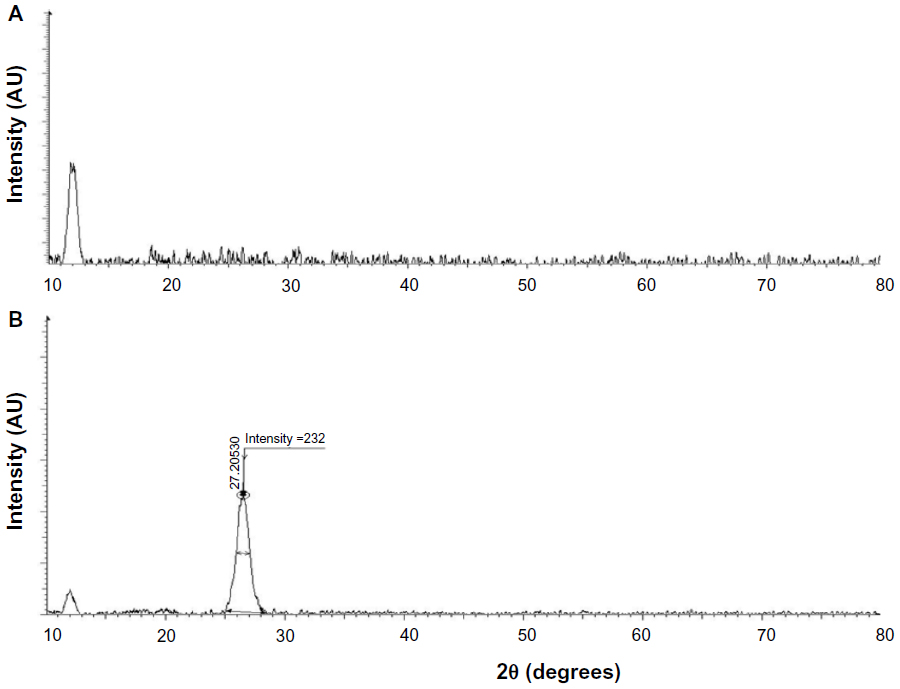 | Figure 2 XRD patterns of GO and GE-rGO. |
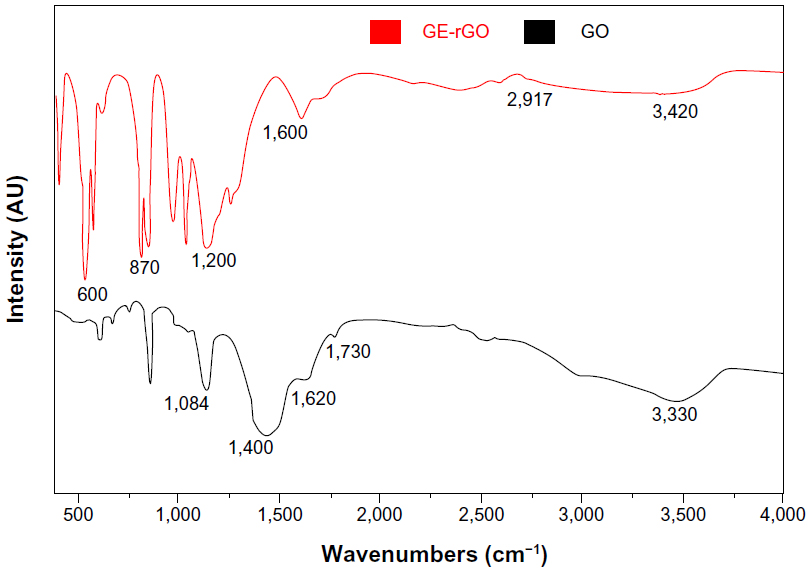 | Figure 3 Fourier transform infrared spectroscopy spectra of GO and GE-rGO. |
FTIR spectra of GO and GE-rGO
Figure 3 shows FTIR spectra of the GO and GE-rGO. Strong absorption peaks were observed at 3,330, 1,730, 1,620, 1,400, and 1,084 cm−1, due to the vibration and deformation bands of O–H and C=O stretching vibrations from carbonyl groups, C=C configurable vibrations from the aromatics, C–OH stretching vibrations, C–O vibrations from epoxy groups, and C–O vibrations from alkoxy groups, respectively;32,35 however, most of the peaks related to the oxygen-containing functional groups were removed in the FTIR spectrum of GE-rGO, suggesting that these oxygen-containing functional groups were removed in the process of reduction using mushroom extracts. Interestingly, some new peaks also appeared in the spectra of GE-rGO at 1,200 and 1,600 cm−1, attributed to the skeletal vibration of the graphene sheets. In addition, as shown in Figure 3, GO had very strong peaks at 3,330 cm−1 (O–H), attributed to the water molecules, whereas, in the GE-rGO sample, the intensities of the bands associated with the oxygen functional groups were significantly decreased.32,35,56–60
XPS analysis of GO and GE-rGO
XPS is a valuable technique for determining the elemental composition, empirical formula, chemical state, and electronic state of elements.31 XPS was used to investigate chemical analysis of GO and GE-rGO. The binding energy of 285.0 eV was designated to the C–C, C=C, and C-H bonds on the surface of the sheets. Figure 4A shows the C1s XPS spectrum of GO, which had two large peaks at 284.6 eV, corresponding to sp2 carbon components, and at 286.7 eV, corresponding to C–O single-bond components of hydroxyl and epoxide.6,9,31 The peaks corresponding to those oxygen functional groups in the spectrum of GE-rGO were significantly decreased after reduction by mushroom extract.31 The spectrum of GE-rGO indicates that the mushroom extracts removed a significant number of oxygen components from GO. Furthermore, the results showed a significant decrease of oxygenated carbon-related signals at 286–289 eV after reduction (Figure 4B), revealing that most of the epoxide, hydroxyl, and carboxyl functional groups were removed after the reduction. Akhavan and Ghaderi performed the reduction of chemically exfoliated GO with E. coli bacteria in mixed-acid fermentation with an anaerobic condition at different times. They showed that, as the exposure time increased (from 0 to 48 hours), the oxygen-containing functional groups of the GO decreased by 60%, indicating a relative chemical reduction of the sheets by interaction with the bacteria.7 Khanra et al, using baker’s yeast as a reducing agent, demonstrated successful reduction of GO, in which most of the oxygen functionalities were removed efficiently and the majority of the conjugated graphene networks were restored after the reduction.31 Taking these results together, the biological material is another alternative source for the preparation of graphene.
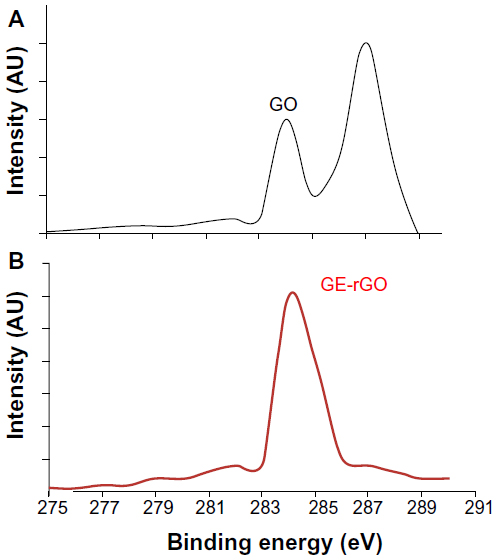 | Figure 4 X-ray photoelectron spectroscopy analysis of GO (A) and GE-rGO (B). |
Size distribution analysis of GO and GE-rGO by dynamic light scattering
The lateral size distributions of GO and GE-rGO were evaluated using dynamic light scattering (DLS).8,32–34,38 DLS measurements were performed in an aqueous solution to elucidate the size of GE-rGO after reduction of GO with a low concentration (250 μg/mL) of GE-rGO. The average hydrodynamic diameter of GO was found to be 1,880±20 nm, whereas the average hydrodynamic diameter of GE-rGO showed a size of 3,200±50 nm (Figure 5A and B). This obvious change in the size distribution indicated that GO was functionalized on the surfaces, with the resulting rGO leading to an increased Brownian motion rate after the reduction process.60 Since the particles in the DLS analysis were assumed to be spherical, and could only be used to reflect the trend of changes in the size of graphene, the DLS results can reveal only the size differences between GO and rGO.38,60 Stankovich et al13 reported that functionalized graphene nanoplates treated with isocyanate produce a DLS peak of 560±60 nm, which is not their average dimension but rather the effective hydrodynamic diameter of an equivalent sphere described by the tumbling of the platelets.
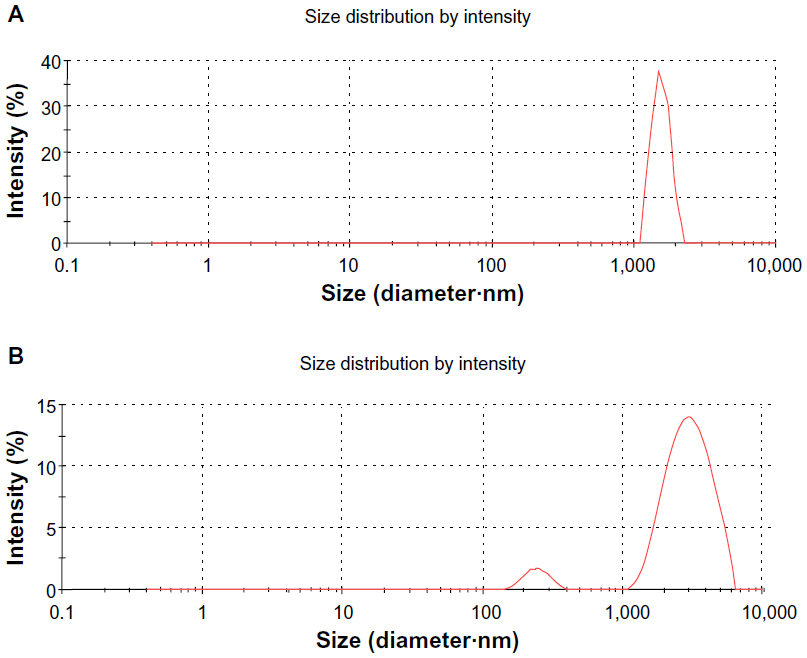 | Figure 5 DLS characterizations of GO and GE-rGO. |
Morphological analyses of GO and GE-rGO by SEM
In order to understand the lateral sizes of GO and GE-rGO, the dispersions were dropped onto aluminum foil, and dozens of SEM images were taken randomly for each sample. The morphology of SEM pictures of GO and GE-rGO are presented in Figure 6A and B. SEM images showed GO as multilayered, wavy, folded flakes (Figure 6A). GE-rGO images revealed that the reduced GO material consisted of several layers stacked on top of one another like sheets of paper, with silky, wrinkled, and flower-like curling morphology. The SEM images of GE-rGO revealed that most of the GO was efficiently reduced to ultrathin sheets with wavy and porous structures of graphene (Figure 6B). This biologically synthesized graphene showed similar agreement with earlier graphene sheets that were prepared from Gt powder through oxidation followed by rapid thermal expansion in nitrogen atmosphere.61 The graphene sheets were found to possess a curled morphology consisting of a thin, wrinkled, paper-like structure, with fewer layers (approximately four layers) and a large specific surface area.61 This difference in morphology between the folded, stacked structure of GO and the folded structures of reduced graphene suggests that the GE reduction process played a significant role in the transformation of GO to graphene.
 | Figure 6 SEM images of GO and GE-rGO. |
Raman spectra of GO and GE-rGO
Raman spectroscopy is a valuable, nondestructive technique by which to characterize ordered and disordered crystal structures of carbon.62 Raman spectroscopy is a rapid way to obtain information about the structure and quality of carbon materials.63 The typical features of carbon in Raman spectra are the G-band around 1,582 cm−1 and the D-band around 1,350 cm−1. The G-band is usually assigned to the E2g phonon of C sp2 atoms, while the D-band is a breathing mode of κ-point phonons of A1g symmetry.64 The Raman spectrum of the GO displayed a strong G-band at 1,608 cm−1 and a D-band at 1,355 cm−1 (Figure 7A). In the Raman spectrum of GE-rGO, the G-band was broadened and shifted upward to 1,587 cm−1. At the same time, the intensity of the D-band at 1,351 cm−1 was substantially increased (Figure 7B). These phenomena could be attributed to the significant decrease of the size of the in-plane sp2 domains due to oxidation and ultrasonic exfoliation and the partially ordered Gt crystal structure of graphene nanosheets.13 The data obtained from Raman spectra of GE-rGO provided evidence for a structural change due to the process of reduction by Ganoderma spp. extracts; the G-peak and D-peak were both widened and were shifted to approximately 1,587 cm−1 and 1,351 cm−1, respectively (Figure 7A and B). Interestingly, the D/G intensity ratio of GE-rGO (2.1) was higher than that of GO (1.8), indicating the introduction of sp3 defects after functionalization and incomplete recovery of the structure of graphene.65 However, the increase in the D/G intensity ratio, compared to pristine Gt, indicates a decrease in the size of the in-plane sp2 domains and a partially ordered crystal structure of the GE-rGO.64 Variations in the relative intensities of the G-peak and D-peak indicate a change in the electronic conjugation state. This change suggests an increase in the number of sp2 domains following reduction of GO.63 The results of the present study agree with those of previous reports that used various biological molecules, such as vitamin C, reducing sugars, melatonin, yeast, bacteria, and phytoextracts, for synthesis of graphene.8,31,32,56,58,66
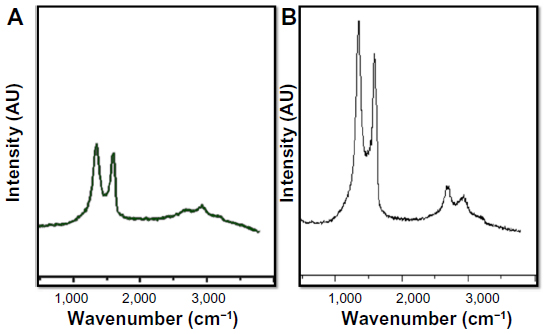 | Figure 7 Raman spectroscopy analyses of GO and GE-rGO samples. |
Surface and height profile of GO and GE-rGO by atomic force microscopy
Further characterization of GO and GE-rGO was carried out using atomic force microscopy (AFM) to measure the surface and height profiles. Figure 8A and B show typical AFM images of GO and GE-rGO dispersions in water, after their deposition on a freshly cleaned glass surface. The average thickness of as-prepared GE-rGO, measured from the height profile of the AFM image, was about 45.97 nm, whereas GO showed a thickness of about 32.58 nm: that is, the thickness of GE-rGO was greater than that of GO. Our findings suggest that the reducing properties of mushroom extract could account for the increasing of the thickness of GE-rGO through removal of oxygen-containing functional groups in GO. Similarly, Stankovich et al13 reported that GO sheets are thicker due to the presence of covalently bound oxygen and the displacement of the sp3 hybridized carbon atoms slightly above and below the original graphene plane. Zhu et al16 reported that the average thickness of as-prepared graphene nanosheets was increased when compared to well-exfoliated GO sheets, which was due to the capping reagent’s important role in increasing the thickness. Melatonin-reduced GO showed greater thickness than GO, which was due to the adsorption of reductant entities.66
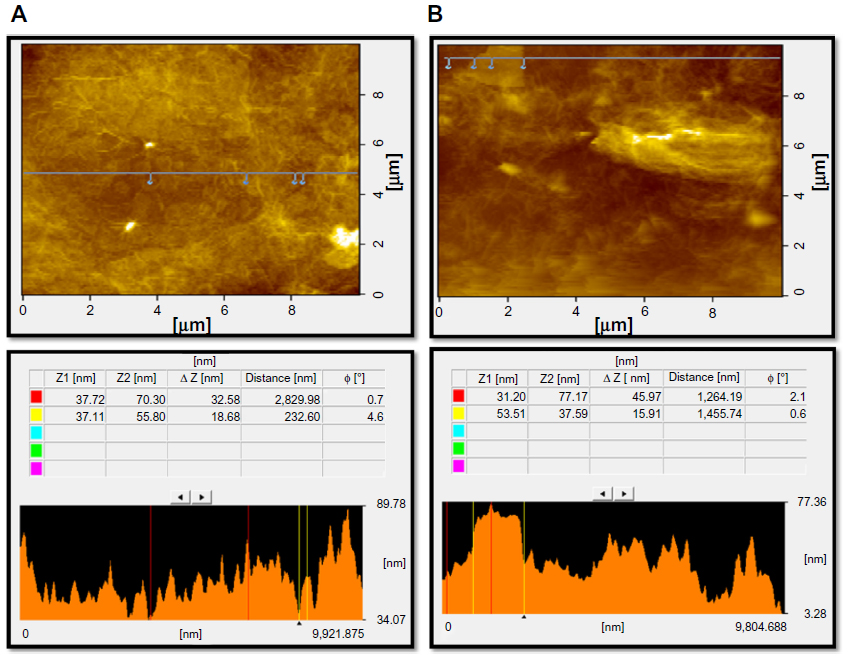 | Figure 8 Surface and thickness analysis of GO (A) and GE-rGO (B) by atomic force microscopy.
|
Effects of GE, GO, and GE-rGO on MDA-MB-231 human breast cancer cells
In this experiment, we evaluated the impacts of GE, GO, and GE-rGO on the viability, LDH leakage, and ROS generation in breast cancer cells. The functions of graphene materials are different due to their physicochemical characteristics. In order to confirm the inhibitory effect of GE, we first treated cells with various concentrations of extracts of Ganoderma spp. (0–1,000 μg/mL) for 24 hours. The results suggested that the MDA-MB-231 cells treated with GE had no significant effect on cell viability (Figure 9) and that GE neither inhibited nor promoted the cell viability in tested concentrations. Further, we examined the cytotoxic effects of GO and GE-mediated GE-rGO on MDA-MB-231 human breast cancer cells using WST-8, which did not react with graphene materials.43 As shown in Figure 10A, the GO-treated groups exhibited low cytotoxicity at concentrations of 50 μg/mL and lower, whereas, in GE-rGO treated cells, the cell viability rate decreased correspondingly dependant on concentrations and the effect was significantly higher than in GO-treated groups. These results suggest that the effect was dose dependent both in GO and GE-rGO. Incubation with GO for 24 hours displayed dramatic cell death (40%) at the highest concentration, 150 μg/mL (P<0.05), compared with controls, whereas treatment with GE-rGO significantly reduced the cell viability by up to 60% at the concentration of 75 μg/mL (P<0.05). Further, we examined the impact of GO and GE-rGO on cells at a longer exposure time (48 hours). Interestingly, GE-rGO-treated cells showed a more prominent inhibitory effect than GO-treated (Figure 10B). Wang et al41 observed that GO was indeed internalized into the cells, located mainly inside cytoplasm such as lysosomes, mitochondrion, and endoplasm, which was one of the reasons for cell death. Li et al67 demonstrated that pristine graphene induces cytotoxicity through the mechanism of maintaining the level of mitochondrial membrane potential in the cells and the generation of ROS, then causing apoptosis by the activation of the mitochondrial pathway. Akhavan et al68 estimated cell viability using concentration- and size-dependent graphene sheets and nanoplatelets. They found significant cell destruction by 1.0 μg/mL of rGO nanoplatelets with average lateral dimensions of 11 nm, while the rGO sheets with average lateral dimensions of 3.8 μm could exhibit a significant cytotoxic effect only at a high concentration (100 μg/mL) after a 1 hour exposure in human mesenchymal stem cells.68 Akhavan et al concluded that concentration and size play an important role in toxicity of graphene materials in human mesenchymal stem cells.68 Jaworski et al69 reported that cell viability was significantly reduced using a concentration of 100 μg/mL, resulting in a survival rate of 54% in U87 cells and 60% in the U118 line. Akhavan and Ghaderi suggested that the cytotoxicity of the non-aggregated reduced GO sheets was due to extremely sharp edges and charge transfer between the cells and graphene materials.6 Wang et al proposed a mechanism for graphene-induced cell death, in which graphene interacts with the cell surface and sends a signal that leads to downregulation, causing cells to detach, float, and shrink; or graphene enters into cytoplasm and the nucleus, disturbing the cell metabolism and inducing cell apoptosis and death.41
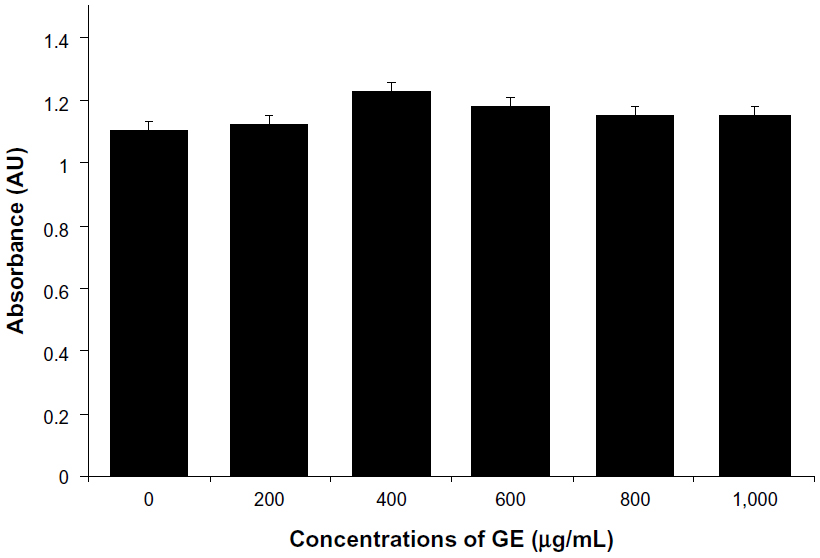 | Figure 9 Effect of GE on cell viability of MDA-MB-231 human breast cancer cells. |
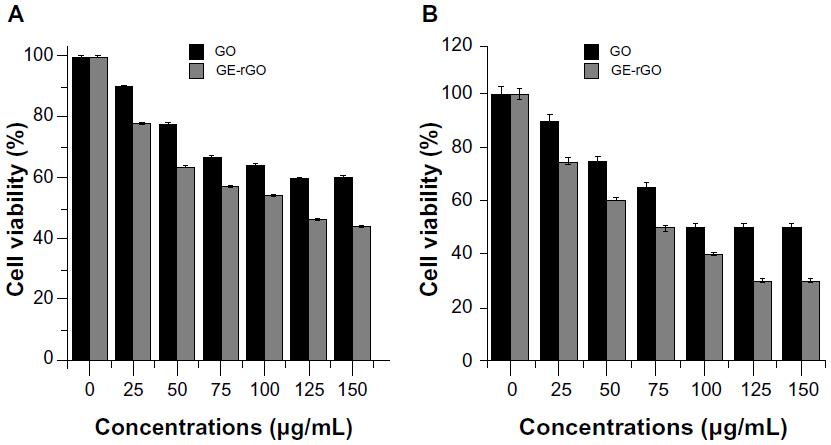 | Figure 10 Effects of GO and GE-rGO on cell viability of MDA-MB-231 human breast cancer cells. |
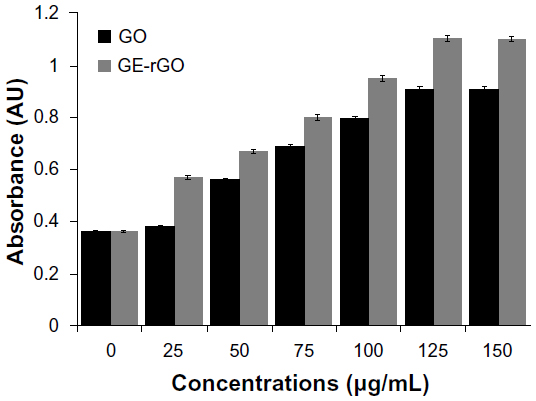
GE-rGO activates the leakage of LDH
The impact of GO and GE-rGO on LDH leakage in human breast cancer cells was evaluated using an LDH leakage assay. Intracellular LDH released into the culture medium was also used as an indicator of cytotoxicity. Cells were exposed to 0–150 μg/mL of GO and GE-rGO for 24 hours. Both GO and GE-rGO induced cell death in a dose-dependent manner after 24 hours’ incubation, as determined by WST-8 assay. After 24 hours of treating cells with GO and GE-rGO, cytotoxic effects occurred at a given concentration between 25 and 150 μg/mL. As we expected, 24 hours of treatment with 25–150 μg/mL of GE-rGO led to significantly (P<0.05) higher LDH activity in the cell culture medium than in untreated and GO-treated cells (Figure 11). It is evident that the GE-rGO shows higher leakage of LDH to the medium occurred at higher concentrations (100 and 150 μg/mL). Jaworski et al69 suggested that membrane integrity was significantly disrupted in U87 cells, even with a lower concentration of graphene platelets.
 | Figure 11 Effects of GO and GE-rGO on lactate dehydrogenase activity in MDA-MB-231 human breast cancer cells. |
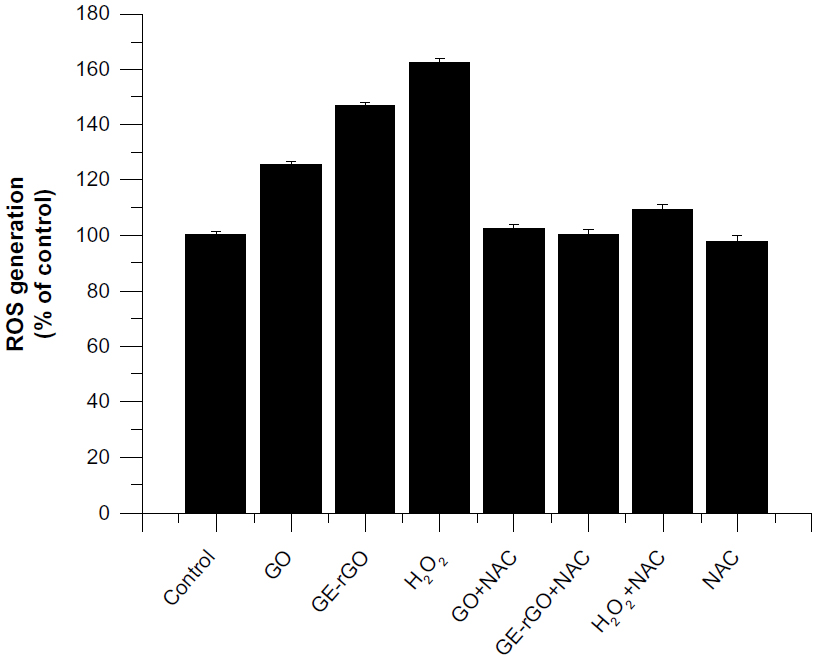
GE-rGO induces oxidative stress
ROS generation and the induction of oxidative stress seem to be the most possible mechanisms of toxic effects of inhaled nanoparticles.70 ROS are induced upon exposure of cells to various environmental free radicals, and toxicity is thereby increased. In order to see the material effects of GO and GE-rGO, cells were treated with a lower concentration (100 μg/mL) and ROS generation was quantified. The results suggest that both GO and GE-rGO induce ROS: GO increased ROS by 20% compared to control, whereas GE-rGO and H2O2 increased ROS by 40% and 60%, respectively, when compared to control (Figure 12). The increased ROS induced by GO and GE-rGO on cancer cells decreased when the cells were treated with 5 mM of NAC.8 Taken together, these results indicate that cell death is mediated by ROS production, which might alter the balance of cellular redox status in the cells.8 Akhavan and Ghaderi6 suggested that the toxicity of bacteria death caused by nanowalls was due to sharpening of the edges of the nanowalls, and possibly by stronger contact interaction with the cell membrane and/or better charge transfer between the bacteria and the reduced nanowalls.6,8 These results provide evidence that GO and GE-rGO induce oxidative stress in cancer cells, which could be due to a strong interaction of cells with reduced rGO that eventually leads to loss of glutathione content in the cells. Sarkar et al71 demonstrated that single walled carbon nano tube (SWCNT) induces ROS in a dose-dependent manner in lung epithelial cells and human keratinocytes. The same group reported that SWCNT-treated BJ Foreskin cells showed significant increase in ROS at concentrations of 6 μg/mL in a dose- and time-dependent manner.71 Li et al67 showed that pristine graphene exposure induced intracellular ROS generation in a time- and dose-dependent manner and also demonstrated that loss of viability depends on sizes (l-GO, m-GO, and s-GO), concentrations, and exposure times of cells with graphene materials.42 The high surface areas of graphene-family nanomaterials (GFNs) induce ROS production, antioxidant deactivation, and ROS quenching.72,73 Biologically synthesized graphene induces dose-dependent ROS generation in human breast cancer cells.33 Duch et al74 observed that GO causes persistent lung injury due to increased rates of mitochondrial respiration, activation of inflammatory responses, the generation of ROS, and induction of apoptosis. Earlier studies have suggested generation of ROS one of the important mechanisms of cytotoxicity of graphene.40,42 Many studies suggest that the mechanisms of toxicity is by direct-contact interaction of extremely sharp edges of graphene nanowalls with wall membrane, Akhavan et al6 proposed mechanisms of toxicity of graphene materials and the other mechanism involves the potential for graphene to block the delivery of nutrients to cancer cells by adhering to cell membranes through cell membrane surface receptors.69,75 Taking the literature and the present study into account, we suggest that ROS generation could be one of the important mechanisms of cell death, both in bacteria and eukaryotic cells.
 | Figure 12 Effects of GO and GE-rGO on generation of ROS in MDA-MB-231 human breast cancer cells. |
Conclusion
Due to the unique and interesting properties of graphene, its use has been explored in various biomedical and biotechnological applications, such as in biosensors, therapeutics, tissue engineering, and electronics. Herein, we described a simple, nontoxic, cost-effective, and eco-friendly biological approach for the reduction of GO using GE. This simple strategy achieves synthesis of homogeneous graphene using biological material as a reducing and stabilizing agent. The as-prepared graphene was characterized using various analytical techniques. The reduction of GO was confirmed by UV-vis spectroscopy. The crystalline nature, chemical analysis, structural and surface morphology, and thickness of graphene were determined using various analytical techniques. Furthermore, the cell viability, LDH leakage, and ROS assays suggested that GO and GE-rGO induce dose- and time-dependent cell death in MDA-MB-231 human breast cancer cells. Interestingly, GE-rGO showed a more significant effect than GO. The results suggest that this green approach could provide an easy method for the production of graphene in bulk quantities, and that GE-reduced GO sheets can be used as biocompatible and efficient agents in nanomedicine-based cancer therapies without the need to use toxic reagents such as hydrazine. To our knowledge, this is the first report describing the use of Ganoderma spp. extracts as a reducing agent for the preparation of graphene.
Acknowledgment
This paper was supported by the KU-Research Professor Program of Konkuk University. Dr Sangiliyandi Gurunathan was supported by Konkuk University KU-Full-time Professorship. This work was supported by the Woo Jang-Choon project (PJ007849) and the next generation of Biogreen 21 (PJ009107) from the Rural Development Administration (RDA), Republic of Korea.
Disclosure
The authors report no conflicts of interest in this work.
References
Novoselov KS, Geim AK, Morozov SV, et al. Electric field effect in atomically thin carbon films. Science. 2004;306(5696):666–669. | |
Geim Ak, Novoselov KS. The rise of graphene. Nat Mater. 2007;6(3):183–191. | |
Akhavan O, Ghaderi E, Rahighi R. Toward single-DNA electrochemical biosensing by graphene nanowalls. ACS Nano. 2012;6(4):2904–2916. | |
Mohanty N, Berry V. Graphene-based single-bacterium resolution biodevice and DNA transistor: interfacing graphene derivatives with nanoscale and microscale biocomponents. Nano Lett. 2008;8(12):4469–4476. | |
Hu W, Peng C, Luo W, et al. Graphene-based antibacterial paper. ACS Nano. 2010;4(7):4317–4323. | |
Akhavan O, Ghaderi E. Toxicity of graphene and graphene oxide nanowalls against bacteria. ACS Nano. 2010;4(10):5731–5736. | |
Akhavan O, Ghaderi E. Escherichia coli bacteria reduce graphene oxide to bactericidal graphene in a self-limiting manner. Carbon. 2012;50(5):1853–1860. | |
Gurunathan S, Han JW, Dayem AA, Eppakayala V, Kim JH. Oxidative stress-mediated antibacterial activity of graphene oxide and reduced graphene oxide in Pseudomonas aeruginosa. Int J Nanomedicine. 2012;7:5901–5914. | |
Akhavan O, Choobtashani M, Ghaderi E. Protein degradation and RNA efflux of viruses photocatalyzed by graphene–tungsten oxide composite under visible light irradiation. J Phys Chem C Nanomater Interfaces. 2012;116(17):9653–9659. | |
Yang K, Zhang S, Zhang G, Sun X, Lee ST, Liu Z. Graphene in mice: ultrahigh in vivo tumor uptake and efficient photothermal therapy. Nano Lett. 2010;10(9):3318–3323. | |
Liu Z, Robinson JT, Sun X, Dai H. PEGylated nanographene oxide for delivery of water-insoluble cancer drugs. J Am Chem Soc. 2008;130(33):10876–10877. | |
Krishna KV?, Ménard-Moyon C, Verma S, Bianco A. Graphene-based nanomaterials for nanobiotechnology and biomedical applications. Nanomedicine (Lond). 2013;8:1669–1688. | |
Stankovich S, Dikin DA, Piner RD, et al. Synthesis of graphene-based nanosheets via chemical reduction of exfoliated graphite oxide. Carbon. 2007;45(7):1558–1565. | |
Cote LJ, Cruz-Silva R, Huang J. Flash reduction and patterning of graphite oxide and its polymer composite. J Am Chem Soc. 2009;131(31):11027–11032. | |
Zhou M, Zhai Y, Dong S. Electrochemical sensing and biosensing platform based on chemically reduced graphene oxide. Anal Chem. 2009;81(14):5603–5613. | |
Dreyer DR, Park S, Bielawski CW, Ruoff RS. The chemistry of graphene oxide. Chem Soc Rev. 2010;39:228–240. | |
Hass J, de Heer WA, Conrad EH. The growth and morphology of epitaxial multilayer graphene. J Phys Condens Matter. 2008;20(32):323202. | |
Akhavan O, Ghaderi EJ. Photocatalytic reduction of graphene oxide nanosheets on TiO2 thin film for photoinactivation of bacteria in solar light irradiation. J Phys Chem C Nanomater Interfaces. 2009;113(47):20214–20220. | |
Akhavan O, Abdolahad M, Esfandiar A, Mohatashamifar M. Photodegradation of graphene oxide sheets by TiO2 nanoparticles after a photocatalytic reduction. J Phys Chem C Nanomater Interfaces. 2010;114(30):12955–12959. | |
Liu N, Liu Q, Huang Y, et al. Organic photovoltaic devices based on a novel acceptor material: graphene. Adv Mater. 2008;20(20):3924–3930. | |
Simpson CD, Brand JD, Berresheim AJ, Przybilla L, Räder HJ, Müllen K. Synthesis of a giant 222 carbon graphite sheet. Chemistry. 2002;8(6):1424–1429. | |
Subrahmanyam KS, Panchakarla LS, Govindaraj A, Rao CNR. Simple method of preparing graphene flakes by an arc-discharge method. J Phys Chem C Nanomater Interfaces. 2009;113(11):4257–4259. | |
Wang Z, Li N, Shi Z, Gu Z. Low-cost and large-scale synthesis of graphene nanosheets by arc discharge in air. Nanotechnology. 2010;21(17):175602. | |
Xu H, Suslick KS. Sonochemical preparation of functionalized graphenes. J Am Chem Soc. 2011;133(24):9148–9151. | |
Salas EC, Sun Z, Lüttge A, Tour JM. Reduction of graphene oxide via bacterial respiration. ACS Nano. 2010;4(8):4852–4856. | |
Min K, Han TH, Kim J, et al. A facile route to fabricate stable reduced graphene oxide dispersions in various media and their transparent conductive thin films. J Colloid Interface Sci. 2012;383(1):36–42. | |
Fan X, Peng W, Li Y, et al. Deoxygenation of exfoliated graphite oxide under alkaline conditions: a green route to graphene preparation. Adv Mater. 2008;20(23):4490–4493. | |
Tang LA, Lee WC, Shi H, et al. Highly wrinkled cross-linked graphene oxide membranes for biological and charge-storage applications. Small. 2012;8(3):423–431. | |
Zhang J, Yang H, Shen G, Cheng P, Zhang J, Guo S. Reduction of graphene oxide via L-ascorbic acid. Chem Commun (Camb). 2010;46(7):1112–1114. | |
Zhu C, Guo S, Fang Y, Dong S. Reducing sugar: new functional molecules for the green synthesis of graphene nanosheets. ACS Nano. 2010;4(4):2429–2437. | |
Khanra P, Kuila T, Kim NH, Bae SH, Yu DS, Lee JH. Simultaneous bio-functionalization and reduction of graphene oxide by baker’s yeast. Chem Eng J. 2012;183(15):526–533. | |
Gurunathan S, Han JW, Eppakayala V, Kim JH. Microbial reduction of graphene oxide by Escherichia coli: a green chemistry approach. Colloids Surf B Biointerfaces. 2013;102(1):772–777. | |
Gurunathan S, Han JW, Eppakayala V, Jeyaraj M, Kim JH. An environmentally friendly approach to the reduction of graphene oxide by Escherichia fergusoni. J Nanosci Nanotechnol. 2013;13(3):2091–2098. | |
Gurunathan S, Han JW, Eppakayala V, Kim JH. Green synthesis of graphene and its cytotoxic effects in human breast cancer cells. Int J Nanomedicine. 2013;8(1):1015–1027. | |
Gurunathan S, Han J, Kim JH. Humanin: a novel functional molecule for the green synthesis of graphene. Colloids Surf B Biointerfaces. 2013;111C:376–383 | |
Mao X, Li H. Chiral imaging in living cells with functionalized graphene oxide. J Mater Chem B Mater Biol Med. 2013;1:4267–4272. | |
Liu L, Liu J, Wang Y, Yan X, Sun DD. Facile synthesis of monodispersed silver nanoparticles on graphene oxide sheets with enhanced antibacterial activity. New J Chem. 2011;35(7):1418–1423. | |
Liu S, Zeng TH, Hofmann M, et al. Antibacterial activity of graphite, graphite oxide, graphene oxide, and reduced graphene oxide: membrane and oxidative stress. ACS Nano. 2011;5(9):6971–6980. | |
Akhavan O, Ghaderi E, Rahimi K. Adverse effects of graphene incorporated in TiO2 photocatalyst on minuscule animals under solar light irradiation. J Mater Chem. 2012;22:23260–23266. | |
Zhang Y, Ali SF, Dervishi E, et al. Cytotoxicity effects of graphene and single-wall carbon nanotubes in neural phaeochromocytoma-derived PC12 cells. ACS Nano. 2010;4(6)3181–3186. | |
Wang K, Ruan J, Song H, et al. Biocompatibility of graphene oxide. Nanoscale Res Lett. 2011;6:8. | |
Chang Y, Yang ST, Liu JH, et al. In vitro toxicity evaluation of graphene oxide on A549 cells. Toxicol Lett. 2011;200(3):201–210. | |
Liao KH, Lin YS, Macosko CW, Haynes CL. Cytotoxicity of graphene oxide and graphene in human erythrocytes and skin fibroblasts. ACS Appl Mater Interfaces. 2011;3(7):2607–2615. | |
Frank IW, Tanenbaum DM, van der Zande AM, McEuen PL. Mechanical properties of suspended graphene sheets. J Vaccum Science Technology B. 2007;25:2558. | |
Lee C, Wei X, Kysar JW, Hone J. Measurement of the elastic properties and intrinsic strength of monolayer graphene. Science. 2008;321(5887):385–388. | |
Lee Y, Bae S, Jang H, et al. Wafer-scale synthesis and transfer of graphene films. Nano Lett. 2010;10(2):490–493. | |
Singh SK, Singh MK, Kulkarni PP, Sonkar VK, Grácio JJ, Dash D. Amine-modified graphene: thrombo-protective safer alternative to graphene oxide for biomedical applications. ACS Nano. 2012;6(3):2731–2740. | |
Mukherjee P, Ahmad A, Mandal D, et al. Fungus mediated synthesis of silver nanoparticles and their immobilization in the mycelial matrix: a novel biological approach to nanoparticle synthesis. Nano Lett. 2001;1(10):515–519. | |
Ahmad A, Mukherjee P, Senapati S, et al. Extracellular biosynthesis of silver nanoparticles using the fungus Fusarium oxysporum. Colloids Surf B Biointerfaces. 2003;28(4):313–318. | |
Bhainsa KC, D’Souza SF. Extracellular biosynthesis of silver nanoparticles using the fungus Aspergillus fumigates. Colloids Surf B Biointerfaces. 2006;47(2):160–164. | |
Kathiresan K, Manivannan S, Nabeel AM, Dhivya B. Studies on silver nanoparticles synthesized by a marine fungus, Penicillium fellutanum isolated from coastal mangrove sediment. Colloids Surf B Biointerfaces. 2009;71(1):133–137. | |
Philip D. Biosynthesis of Au, Ag and Au-Ag nanoparticles using edible mushroom extract. Spectrochim Acta A Mol Biomol Spectrosc. 2009;73(2):374–381. | |
Gurunathan S, Raman J, Abd Malek SN, John PA, Vikineswary S. Green synthesis of silver nanoparticles using Ganoderma neo-japonicum Imazeki: a potential cytotoxic agent against breast cancer cells. Int J Nanomedicine. 2013;8:4399–4413. | |
Zhou XW, Su KQ, Zhang YM. Applied modern biotechnology for cultivation of Ganoderma and development of their products. Appl Microbiol Biotechnol. 2012;93(3):941–963. | |
Lu QY, Jin YS, Zhang Q, et al. Ganoderma lucidum extracts inhibit growth and induce actin polymerization in bladder cancer cells in vitro. Cancer Lett. 2004;216(1):9–20. | |
Fernández-Merino MJ, Guardia L, Paredes JI, et al. Vitamin C is an ideal substitute for hydrazine in the reduction of graphene oxide suspensions. J Phys Chem C Nanomater Interfaces. 2010;114(14):6426–6432. | |
Li D, Müller MB, Gilje S, Kaner RB, Wallace GG. Processable aqueous dispersions of graphene nanosheets. Nat Nanotechnol. 2008;3(2):101–105. | |
Thakur S, Karak N. Green reduction of graphene oxide by aqueous phytoextracts. Carbon. 2012;50(14):5331–5339. | |
Dreyer DR, Park S, Bielawski C, Ruoff RS. The chemistry of graphene oxide. Chem Soc Rev. 2009;39:228–240. | |
Wang Z, Nelson JK, Hillborg H, Zhao S, Schadler LS. Graphene oxide filled nanocomposite with novel electrical and dielectric properties. Adv Mater. 2012;24(23):3134–3137. | |
Lian P, Zhu X, Liang S, Li Z, Yang W, Wang H. Large reversible capacity of high quality graphene sheets as an anode material for lithium-ion batteries. Electrochim Acta. 2010;55(12)3909–3914. | |
Wang G, Yang J, Park J, et al. Facile synthesis and characterization of graphene nanosheets. J Phys Chem C Nanomater Interfaces. 2008;112(22):8192–8195. | |
Niyogi S, Bekyarova E, Itkis ME, et al. Spectroscopy of covalently functionalized graphene. Nano Lett. 2010;10(10):4061–4066. | |
Ferrari AC, Meyer JC, Scardaci V, et al. Raman spectrum of graphene and graphene layers. Phys Rev Lett. 2006;97(18):187401. | |
McAllister MJ, Li JL, Adamson DH, et al. Single sheet functionalized graphene by oxidation and thermal expansion of graphite. Chem Mater. 2007;19(18):4396–4404. | |
Esfandiar A, Akhavan O, Irajizad A. Melatonin as a powerful bio-antioxidant for reduction of graphene oxide. J Mater Chem. 2011;21:10907–10914. | |
Li Y, Liu Y, Fu Y, et al. The triggering of apoptosis in macrophages by pristine graphene through the MAPK and TGF-beta signaling pathways. Biomaterials. 2012;33(2):402–411. | |
Akhavan O, Ghaderi E, Akhavan A. Size-dependent genotoxicity of graphene nanoplatelets in human stem cells. Biomaterials. 2012;33(32):8017–8025. | |
Jaworski S, Sawosz E, Grodzik M, et al. In vitro evaluation of the effects of graphene platelets on glioblastoma multiforme cells. Int J Nanomedicine. 2013;8:413–420. | |
Nel A, Xia T, Mädler L, Li N. Toxic potential of materials at the nanolevel. Science. 2006;311(5761):622–627. | |
Sarkar S, Sharma C, Yog R, et al. Analysis of stress responsive genes induced by single-walled carbon nanotubes in BJ Foreskin cells. J Nanosci Nanotechnol. 2007;7(2):584–592. | |
Fenoglio I, Tomatis M, Lison D, et al. Reactivity of carbon nanotubes: free radical generation or scavenging activity? Free Radic Biol Med. 2006;40(7):1227–1233. | |
Liu X, Gurel V, Morris D, et al. Bioavailability of nickel in single-wall carbon nanotubes. Adv Mater. 2007;19(19):2790–2796. | |
Duch MC, Budinger GR, Liang YT, et al. Minimizing oxidation and stable nanoscale dispersion improves the biocompatibility of graphene in the lung. Nano Lett. 2011;11(12):5201–5207. | |
Guo L, Von Dem Bussche A, Buechner M, Yan A, Kane AB, Hurt RH. Adsorption of essential micronutrients by carbon nanotubes and the implications for nanotoxicity testing. Small. 2008;4(6):721–727. |
 © 2014 The Author(s). This work is published and licensed by Dove Medical Press Limited. The
full terms of this license are available at https://www.dovepress.com/terms
and incorporate the Creative Commons Attribution
- Non Commercial (unported, 3.0) License.
By accessing the work you hereby accept the Terms. Non-commercial uses of the work are permitted
without any further permission from Dove Medical Press Limited, provided the work is properly
attributed. For permission for commercial use of this work, please see paragraphs 4.2 and 5 of our Terms.
© 2014 The Author(s). This work is published and licensed by Dove Medical Press Limited. The
full terms of this license are available at https://www.dovepress.com/terms
and incorporate the Creative Commons Attribution
- Non Commercial (unported, 3.0) License.
By accessing the work you hereby accept the Terms. Non-commercial uses of the work are permitted
without any further permission from Dove Medical Press Limited, provided the work is properly
attributed. For permission for commercial use of this work, please see paragraphs 4.2 and 5 of our Terms.