Back to Journals » Medical Devices: Evidence and Research » Volume 12
An in vitro acoustic analysis and comparison of popular stethoscopes
Authors Weiss D ![]() , Erie C, Butera III J
, Erie C, Butera III J ![]() , Copt R, Yeaw G, Harpster M, Hughes J, Salem DN
, Copt R, Yeaw G, Harpster M, Hughes J, Salem DN
Received 1 September 2018
Accepted for publication 8 November 2018
Published 15 January 2019 Volume 2019:12 Pages 41—52
DOI https://doi.org/10.2147/MDER.S186076
Checked for plagiarism Yes
Review by Single anonymous peer review
Peer reviewer comments 2
Editor who approved publication: Dr Scott Fraser
Video abstract presented by Joseph Butera III.
Views: 781
Daniel Weiss,1,2 Christine Erie,1,2 Joseph Butera III,2 Ryan Copt,2 Glenn Yeaw,2 Mark Harpster,2 James Hughes,2,3 Deeb N Salem4
1Department of Medicine, Charles E. Schmidt College of Medicine, Florida Atlantic University, Boca Raton, FL, USA; 2Bongiovi Medical & Health Technologies, Inc., Port St Lucie, FL, USA; 3Department of Surgery, University of Mississippi Medical Center, Jackson, MS, USA; 4Department of Medicine, Tufts Medical Center, Boston, MA, USA
Purpose: To compare the performance of various commercially available stethoscopes using standard acoustic engineering criteria, under recording studio conditions.
Materials and methods: Eighteen stethoscopes (11 acoustic, 7 electronic) were analyzed using standard acoustic analysis techniques under professional recording studio conditions. An organic phantom that accurately simulated chest cavity acoustics was developed. Test sounds were played via a microphone embedded within it and auscultated at its surface by the stethoscopes. Recordings were made through each stethoscope’s binaurals and/or downloaded (electronic models). Recordings were analyzed using standard studio techniques and software, including assessing ambient noise (AMB) rejection. Frequency ranges were divided into those corresponding to various standard biological sounds (cardiac, respiratory, and gastrointestinal).
Results: Loudness and AMB rejection: Overall, electronic stethoscopes, when set to a maximum volume, exhibited greater values of perceived loudness compared to acoustic stethoscopes. Significant variation was seen in AMB rejection capability. Frequency detection: Marked variation was also seen, with some stethoscopes performing better for different ranges (eg, cardiac) vs others (eg, gastrointestinal).
Conclusion: The acoustic properties of stethoscopes varied considerably in loudness, AMB rejection, and frequency response. Stethoscope choice should take into account clinical conditions to be auscultated and the noise level of the environment.
Keywords: stethoscope, analysis, acoustic, noise, signal
Introduction
The essential concept of a medical stethoscope has remained unchanged since its invention by René Laennec in 1816. The form of the stethoscope using flexible binaural tubes greatly improved the practicality of the instrument in the 1850s. While advances in materials, electronics, and construction methods have refined the design, no groundbreaking changes have been made since then. In parallel, as new imaging technologies appear, reliance on the human ear as a diagnostic device is decreasing. However, when imaging is not possible or is unavailable, auscultation can provide a wealth of information in a noninvasive and immediate manner.
Choosing the optimal stethoscope is vital for accurate auscultation and patient care. For a stethoscope to function well, it must auscultate clinically relevant sounds and reject unwanted sounds (eg, environmental noise, nonrelevant biological sounds [BIO]). Additionally, the frequency range of clinically relevant BIO varies, making one stethoscope ideal for a specific specialty and less ideal for another.1 The stethoscope guides available focus on choosing a stethoscope on the basis of chest piece material, tubing durability, and ear piece comfort.2 Often, the decision to buy a particular stethoscope is influenced by its appearance rather than its acoustic properties and capability.3 Price may be a factor, with stethoscopes ranging from under US $100–1,000. Digital stethoscopes may be better suited to situations where amplification of the sound is important, or where storage and transmission of auscultated sounds (such as in telemedicine) are required. This study compared the performance of the various leading commercially available stethoscopes using standard acoustic engineering criteria, under recording studio conditions. To maintain uniformity and control of testing conditions, performance was assessed using a biological phantom with acoustic properties similar to those of the human thorax.
Materials and methods
Acoustic phantom creation
To accurately analyze and compare various stethoscopes in vitro, care was taken to simulate and normalize the entire auscultation system. As no “gold standard” exists to compare stethoscopes against each other, an organic phantom that accurately simulated chest cavity acoustics was created (Figure 1). The organic phantom consisted of a lightweight plastic container (Ziploc Tupperware; SC Johnson, Racine, WI, USA) comprising an open cell foam (Carry Cases Plus, Paterson, NJ, USA), an acoustically transparent plastic grid (3D printed at the lab), castor oil (Mineral oil; CVS, Woonsocket, RI, USA), and a 0.5 cm layer of ballistics gel (Perma-Gel Personal Ballistic Gel Test Kit; Perma-Gel, Inc.; Albany, OR, USA) as the “skin.” Food-grade castor oil was chosen because its sound wave propagation speed (1,490 m/s) is similar to that of the body.4 A 5 W transducer (DAEX25QLP; Dayton Audio, Springboro, OH, USA) driven by a 100 W Class A amplifier (RA300; Alesis, Cumberland, RI, USA) was embedded within the organic phantom to reproduce test sounds of varying frequency ranges corresponding to specific bodily sounds.
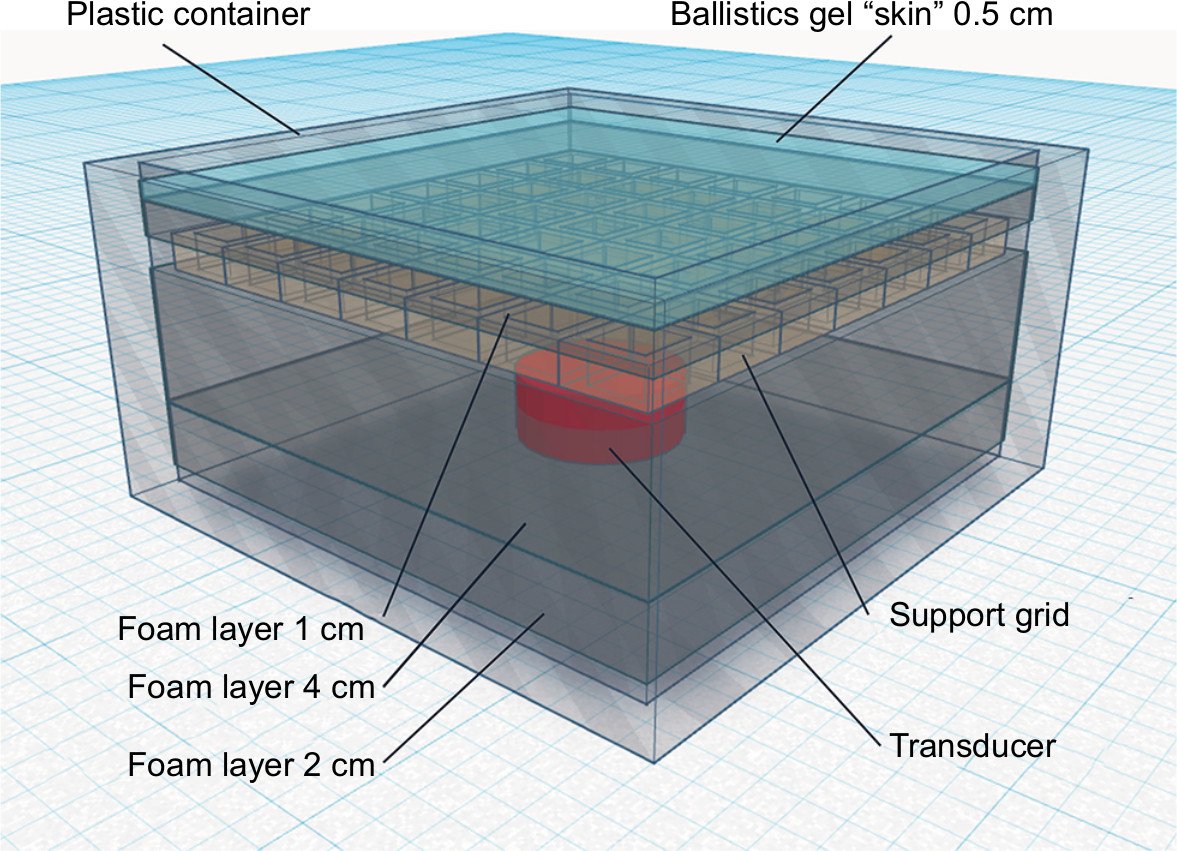 | Figure 1 Phantom container system. Notes: A simulation was constructed using materials to mimic the biological structure and sounds reproduced by an organic chest cavity. Layers of foam were used to support and stabilize the transducer. The castor oil used shared similar sound wave propagation properties just like the human body. |
The stethoscopes evaluated in this study were auscultated at the phantom’s gel surface (Figure 2). The stethoscope head was placed on the surface of the phantom with a standardized weight of 227 gm corresponding to the typical pressure applied by a hand when auscultating a chest.
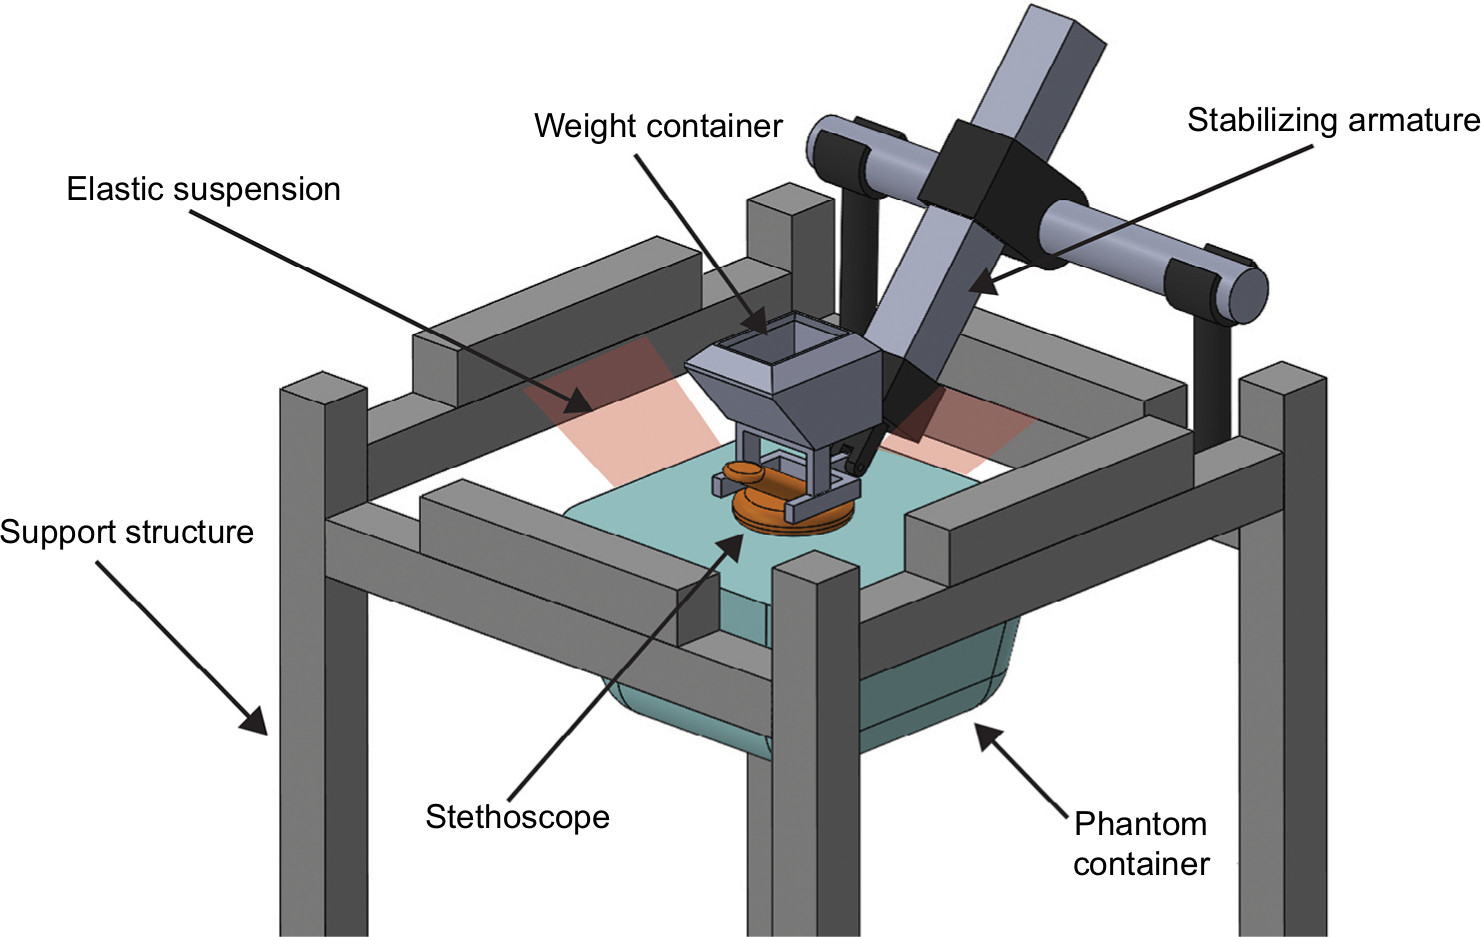 | Figure 2 Experimental setup. Note: To minimize frequency interference, a shock-absorbing structure suspended the phantom container using wide elastic bands. |
The pressure of the chest piece on the phantom must be normalized within a study cohort to ensure electrical impedance of the transducer system is equal for all test subjects. A weight of 227 g was calibrated for each stethoscope by placing a digital scale beneath the chest piece, and then filling the container with an appropriate number of copper balls to equal the total target weight for the study.
A total of 18 stethoscopes were evaluated (Table 1). Of those, 11 were acoustic and 7 were electronic stethoscopes. Acoustic stethoscope modes include diaphragm (D) mode or bell (B) mode, while electronic stethoscope modes can vary among D, B, wide (W), high (H), and low (L) modes. Each stethoscope was recorded in all of its available modes.
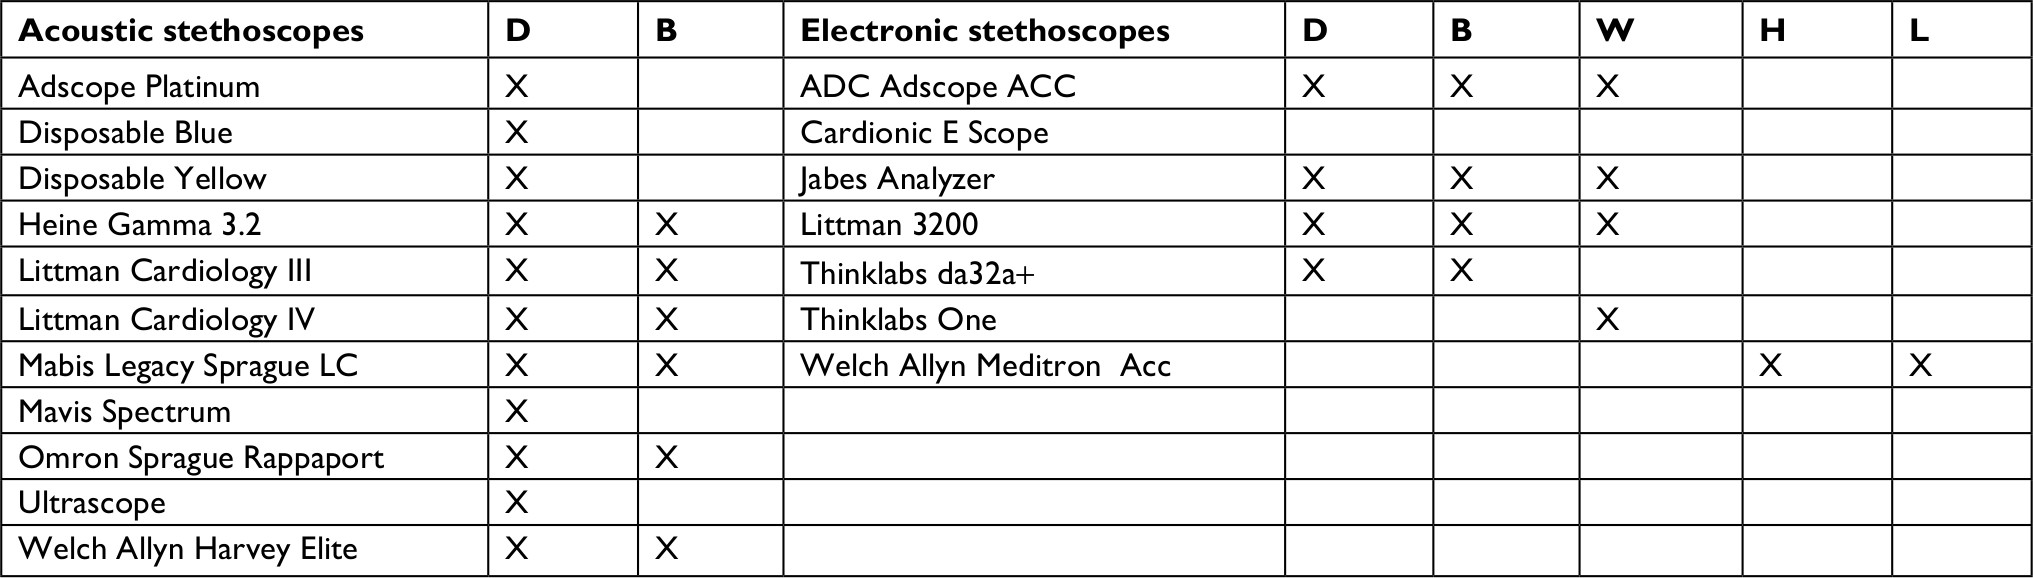 | Table 1 Stethoscope models evaluated Notes: The acoustic and electronic stethoscopes are listed, with each mode tested indicated by an “X.” D stands for diaphragm mode; B stands for bell mode, while electronic stethoscope modes can vary among diaphragm, bell, wide (W), High (H) and Low (L) modes. |
With a system created to mimic a true chordate body, the final consideration was to ensure that wave propagation and transmission is possible across all relevant frequency ranges. Frequency ranges are provided in Table 2. Figure 3 shows the recorded frequency responses for each stethoscope. It is clear that there is a significant transfer of all relevant frequencies through the system. Since this paper seeks only to assess the relative differences in response between various stethoscopes, it is not necessary that there be a flat frequency response through the phantom. Rather, it is only necessary that the shape of the phantom’s frequency response curve remains consistent between individual stethoscope tests.
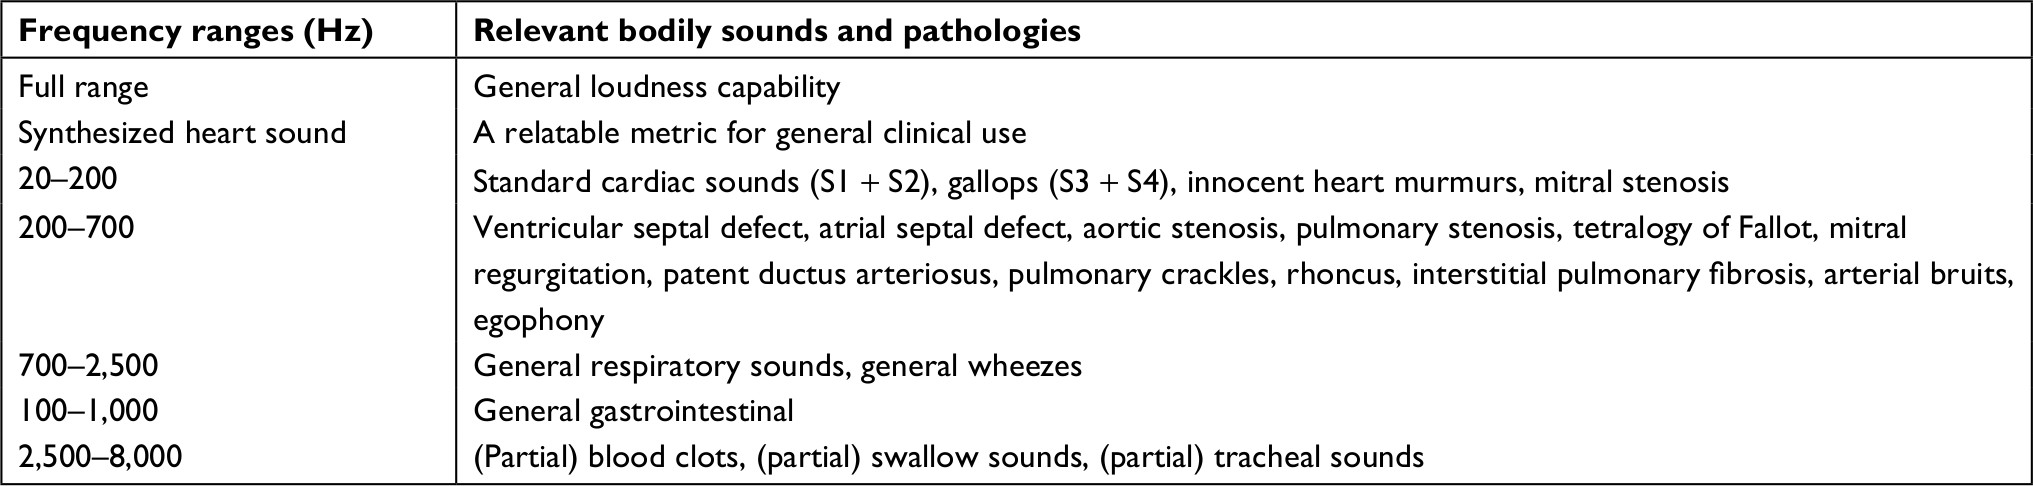 | Table 2 Clinically relevant frequency ranges Note: Frequency ranges listed with corresponding relevant bodily sounds and clinical pathologies. |
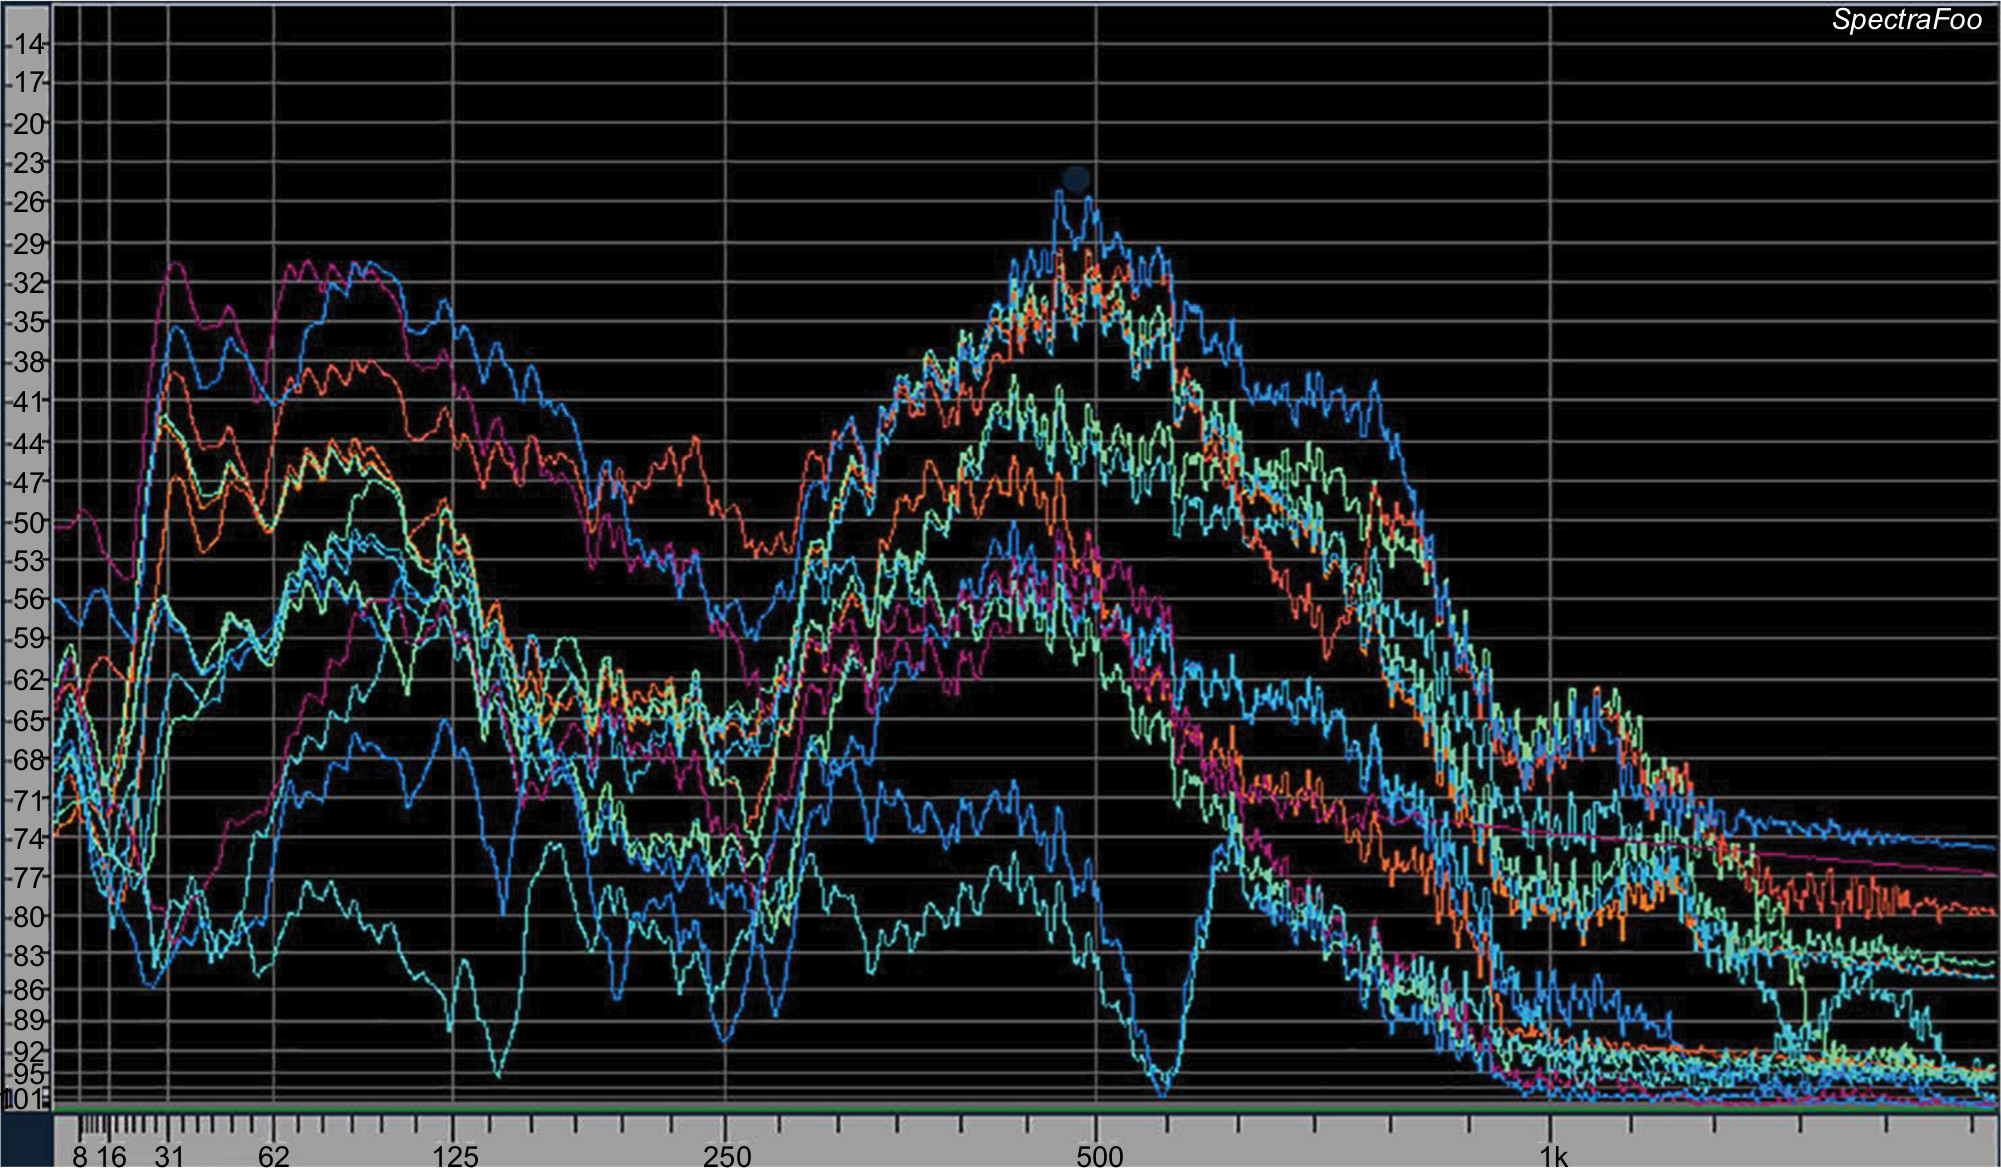 | Figure 3 Frequency responses for each stethoscope. Note: The phantom is capable of transmitting the full range of audible frequencies. |
Test sounds
Assessment of the harmonics within the phantom system included a 20 Hz–20 kHz sine wave sweep reproduced by the embedded transducer and recorded at the surface of the phantom. All stethoscopes evaluated in this study were tested with calibrated audio levels to ensure that each stethoscope received the same acoustic energy at the auscultation point.
Pink noise (acoustical energy distributed uniformly by an octave throughout the audio spectrum) is useful for determining the broadband performance of an acoustic system for human use. To assess a stethoscope’s frequency response of BIO, pink noise was reproduced through the transducer and auscultated at the phantom’s surface under quiet conditions. To assess a stethoscope’s ability to reject ambient noise (AMB), a separate recording was then created by reproducing pink noise through loudspeakers in the room at 80 dB sound pressure level. While auscultating at the phantom’s surface, no sound was reproduced through the phantom’s embedded transducer.
Microphones (TC-30; Earthworks, Glimanton, NH, USA) were attached to both binaurals and simultaneously recorded. All recordings were made using studio quality transformerless mic preamps (C84; Seventh Circle Audio, Oakland, CA, USA) and analog-to-digital conversion method (Aurora 8; Lynx Studio Technology, Inc., Costa Mesa, CA, USA). Audio recording and playback were accomplished using Sonar X2 professional recording software (Cakewalk, Inc., Boston, MA, USA).
All recordings obtained were uncompressed with a 48 kHz sample rate and 24-bit word length. This format was supposed to be of sufficient resolution for the frequency ranges reproduced by the stethoscopes in the study. Electronic stethoscopes were recorded using binaural microphones to simulate human use, as well as their own electrical output to represent a machine interface, if available. All electronic stethoscopes were recorded at the maximum volume.
Data analysis
Loudness and pink noise measurements
Pink noise results were analyzed for ITU BS 1170-3 perceived loudness using Adobe Audition CS6 (Adobe Systems, Inc., San Jose, CA, USA). These measurements are represented in Loudness Units relative to digital Full Scale (LUFS). This unit takes into account the nonlinear frequency response of human hearing. It should be noted that a 10 dB or LUFS decrease or increase in volume correlates with halving or doubling of perceived loudness, respectively.
AMB rejection
The degree of AMB rejection was derived by subtracting the LUFS value of AMB from the LUFS value of BIO (ΔLUFS) (Figure 4). The loudness of any sample auscultated from the phantom is arbitrary and does not have a numerical reference. The AMB rejection amount of a stethoscope should only be compared to the rejection amount of other stethoscopes in this study. No AMB rejection (0 ΔLUFS) would indicate that the stethoscope system detects 80 dB sound pressure level of broadband noise in the atmosphere at the same level as the test signal presented in the phantom.
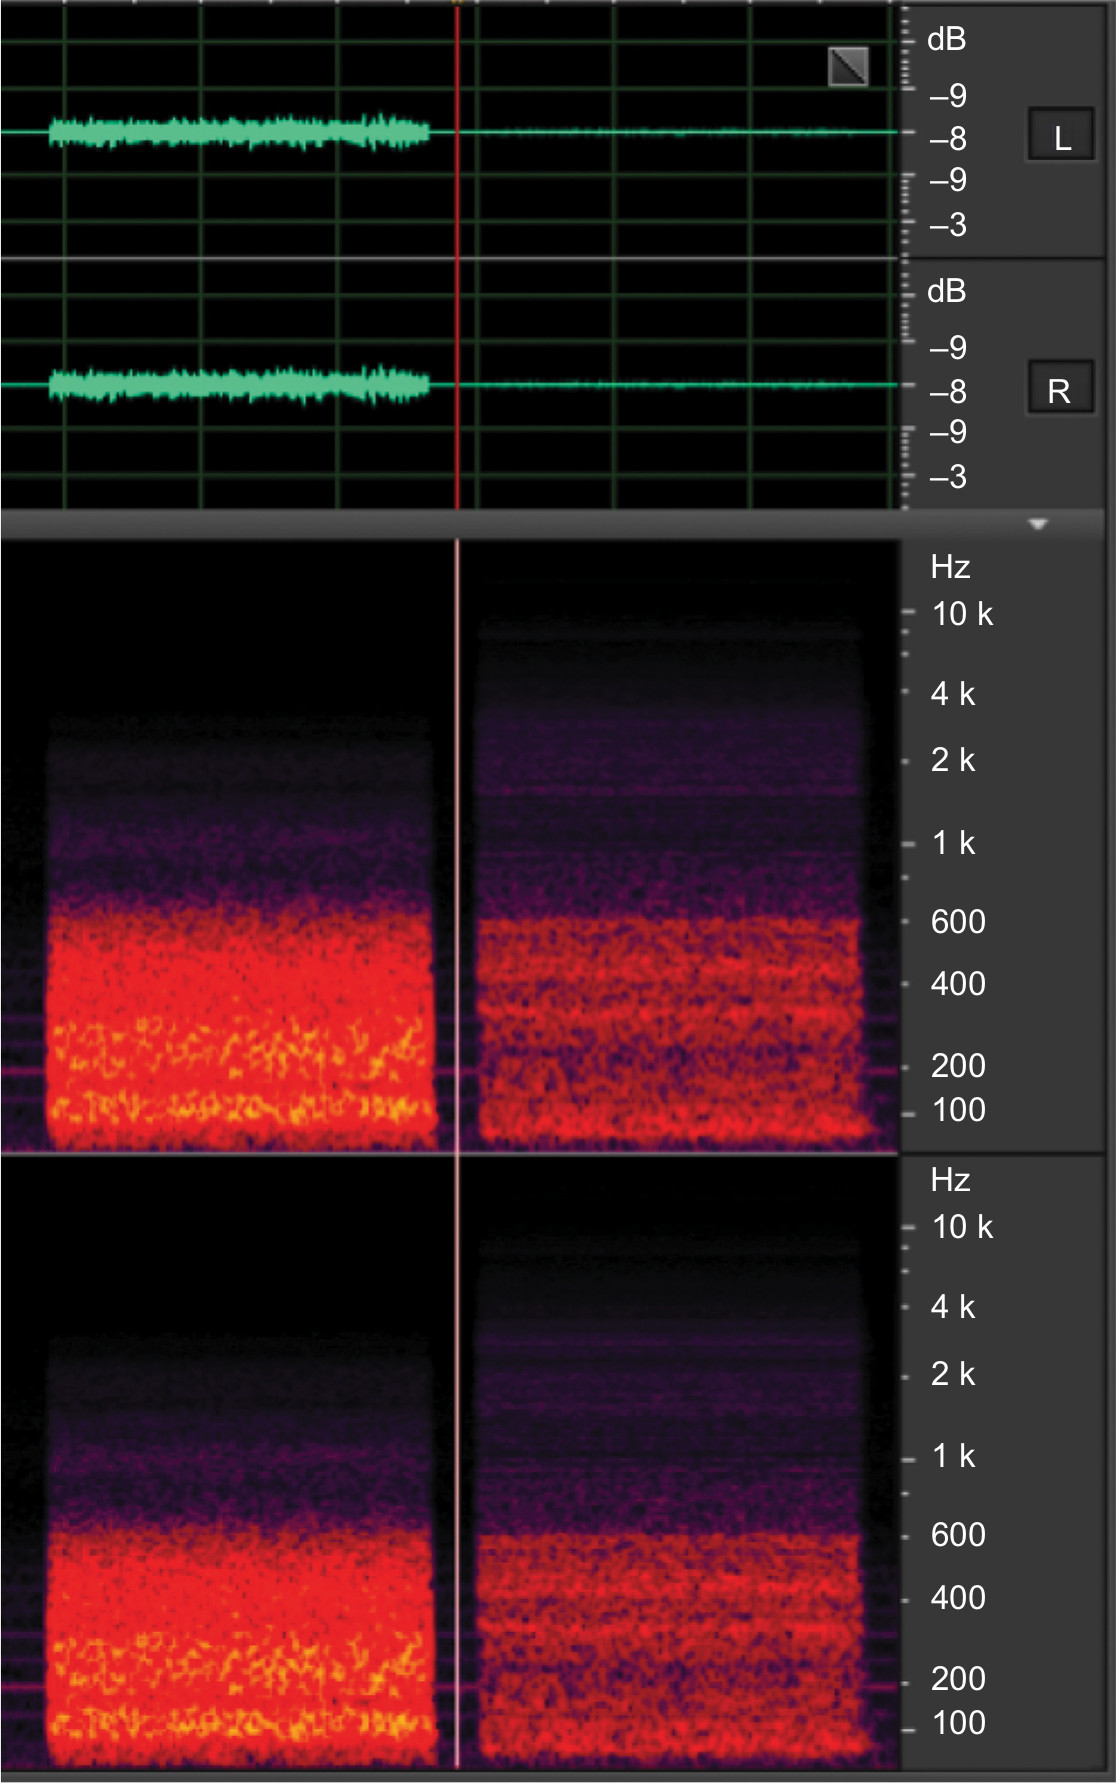 | Figure 4 AMB rejection. Note: The spectrogram depicts pink noise signals auscultated (left column) using a Thinklabs stethoscope and the AMB detected (right column) by microphones attached to both binaurals. Abbreviations: AMB, ambient noise; L, left; R, right. |
Clinically relevant frequency ranges
The full spectrum pink noise samples were divided into frequency ranges derived from the literature5–24 to assess the performance of each stethoscope for specific clinical conditions (Table 2). To accomplish this, BIO and AMB recordings were duplicated and then band-pass filtered into each range. LUFS measurements were taken of each sample.
While the spectrographic analysis is useful for an extensive analysis into the specifics of a stethoscope’s frequency response, researchers focused on frequency band loudness measurements as a more useful metric for correlation with clinical utility.
Results
Overall perceived loudness and AMB rejection
Overall, electronic stethoscopes, when set to a maximum volume, exhibited greater values of perceived loudness compared to acoustic stethoscopes. The three loudest electronic stethoscopes were the Thinklabs ds32a+ (–20.66 LUFS in B mode), the Jabes Analyzer (–23.91 LUFS in B mode), and the Littmann 3200 (−22.30 LUFS in B mode). Of the electronic stethoscopes evaluated, the Littmann 3200 exhibited the most AMB rejection (21.40 ΔLUFS).
The loudest acoustic stethoscopes were the Welch Allyn Harvey Elite (–39.02 LUFS in B mode), the Littmann Cardiology III (–36.52 LUFS in D mode), and the Heine Gamma 3.2 (−38.55 LUFS in B mode). Of the acoustic stethoscopes analyzed in this study, the Heine Gamma had the best AMB rejection (8.00 ΔLUFS).
Frequency range-specific results
Gastrointestinal sounds (97–1,034 Hz)
Among the acoustic stethoscopes, Littman Cardiology IV (45.982 LUFS in B mode), Mabis Spectrum (44.51 LUFS in D mode), and Littman Cardiology III (41.95 LUFS in D mode) demonstrated the highest perceived loudness to sounds within the frequency range correlating to gastrointestinal sounds (Figure 5). Overall, the electronic stethoscopes examined were more sensitive to sounds in the 97–1,034 Hz frequency range than most of the acoustic stethoscopes. Many of the electronic stethoscope models similarly perceived loudness values in this frequency range (39.486–32.6). The electronic stethoscopes which demonstrated the most perceived loudness included the Jabes Analyzer (39.486 in D mode), ADC Adscope Acc (39.466 in D mode), and the ADC Adscope Acc (39.408 in W mode).
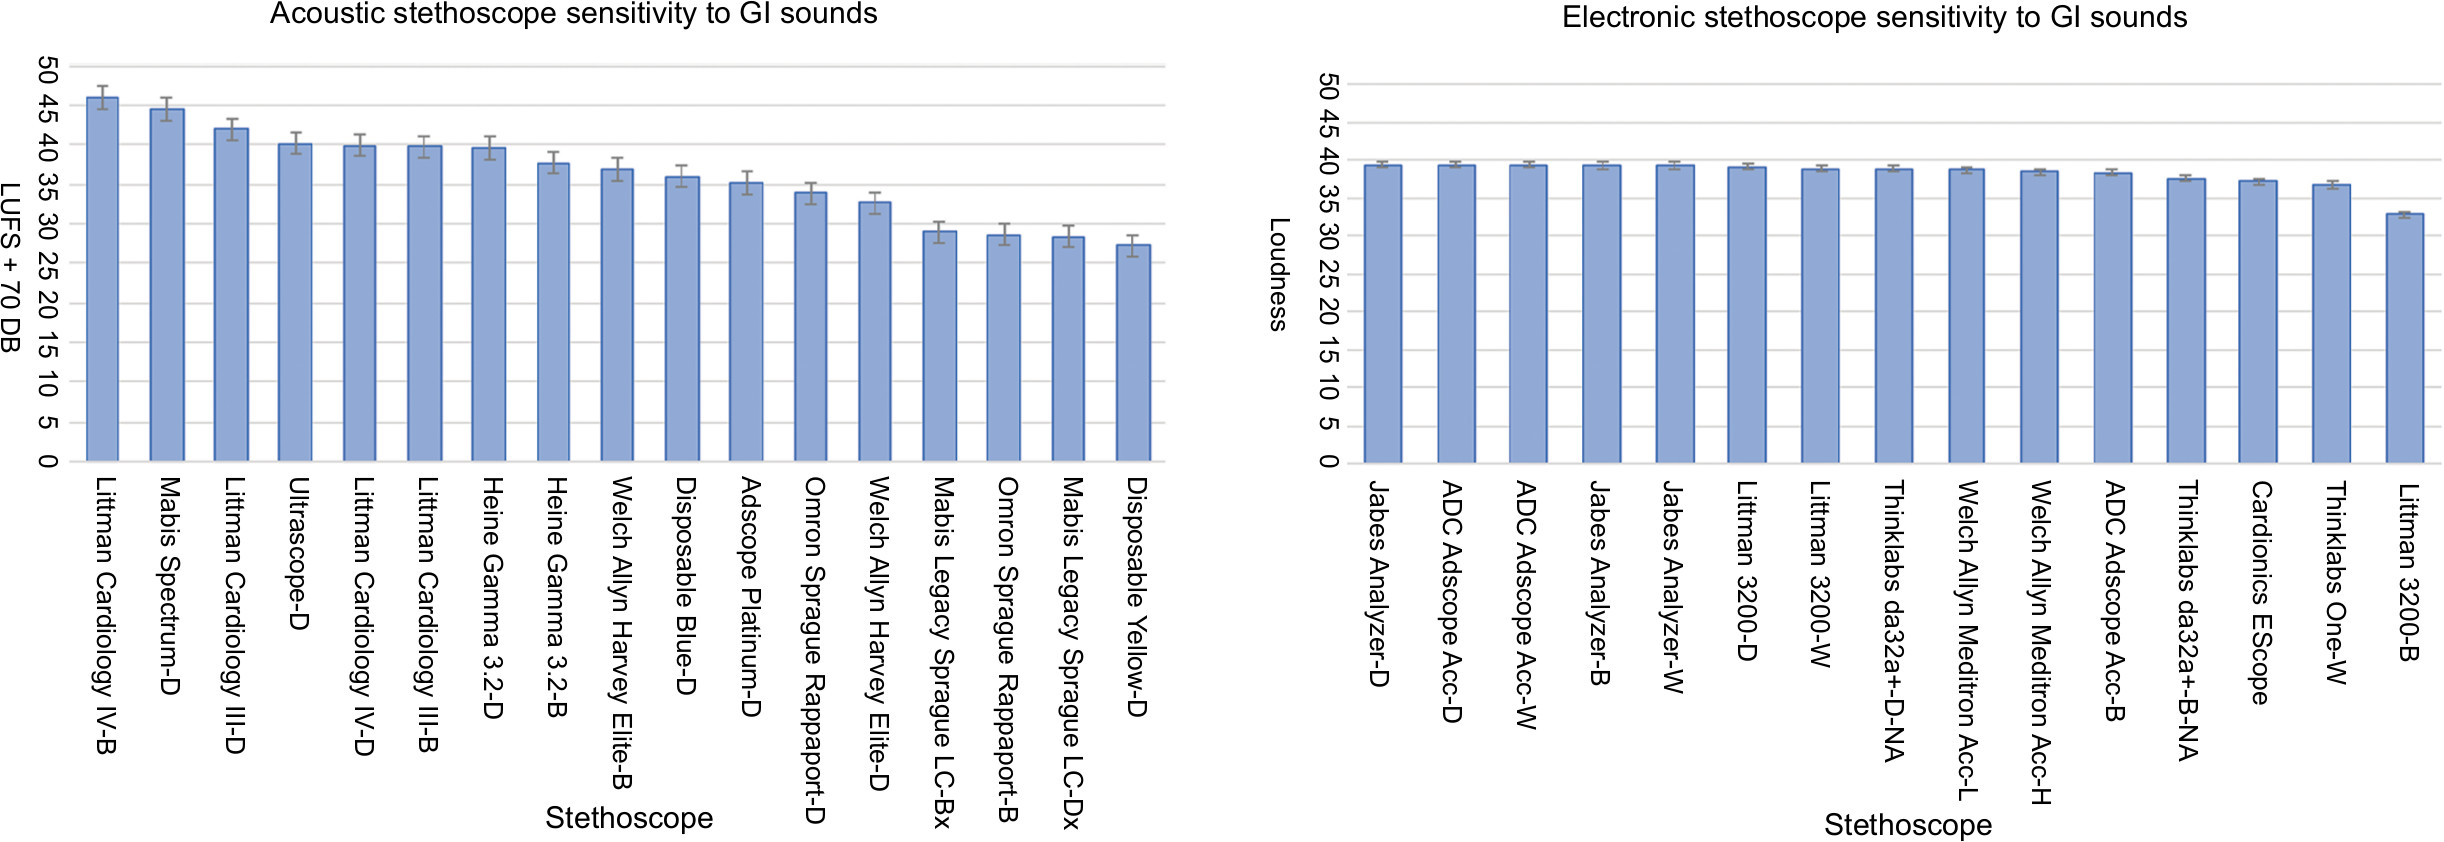 | Figure 5 Sensitivity to GI sounds. Note: The perceived loudness of acoustic stethoscopes (left) and electronic stethoscopes (right) to frequency range 97–1,034 Hz was measured to compare their sensitivity to general GI sounds. Abbreviations: GI, gastrointestinal; LUFS, Loudness Units relative to digital Full Scale. |
The Littman 3200, in all three of its modes, exhibited the most noise rejection (Figure 6) of all stethoscopes. Overall, the noise rejection capability of the acoustic stethoscopes was superior to the electronic stethoscope noise rejection. Among the acoustic stethoscopes, the Welch Allyn Harvey Elite (16.816 LUFS in B mode) has the best noise rejection followed closely by the Littmann Cardiology III (16.44 LUFS in B mode) and the Heine Gamma 3.2 (16.202 LUFS in D mode). Stethoscopes with relatively poor AMB rejection at frequency 97–1,034 Hz include the Omron Sprague Rappaport (1.776 LUFS in B mode), ADC Adscope Acc (2.824 in B mode), and Welch Allyn Meditron Acc (–3.884 in H mode and –11.968 in L mode).
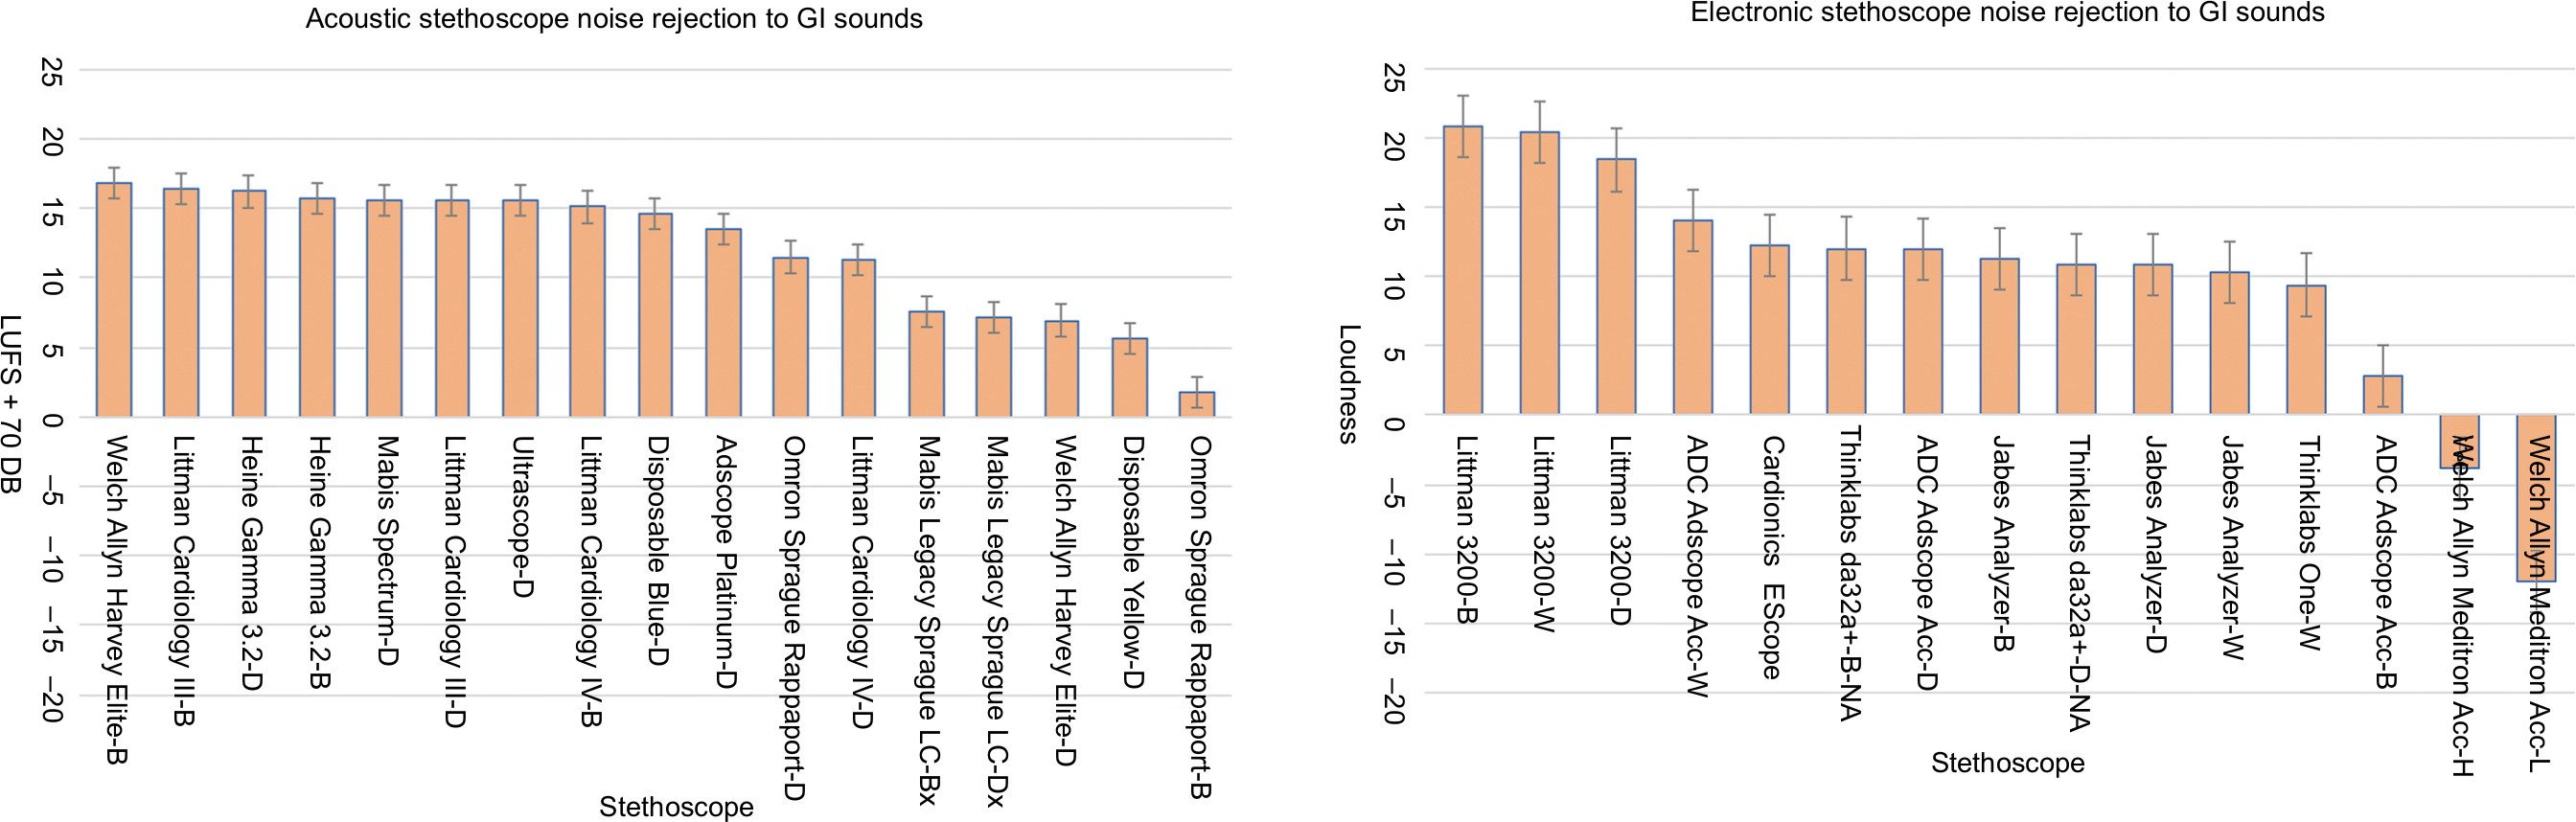 | Figure 6 Noise rejection of GI sounds. Note: Noise rejection of GI sounds. Acoustic (left) and electronic (right) stethoscope noise rejection was measured at frequency ranges (97–1,034 Hz) of GI sounds. Abbreviations: GI, gastrointestinal; LUFS, Loudness Units relative to digital Full Scale. |
Cardiac sounds (22–281 Hz: S1–S4 murmurs, mitral stenosis [MS])
Within the 22–281 Hz frequency range, the acoustic stethoscopes Mabis Spectrum (in 44.948 LUFS in D mode), Littman Cardiology IV (42.168 LUFS in B mode, 42.048 LUFS in D mode), and Littman Cardiology III (41.55 LUFS in D mode) had the highest loudness values. Of the electronic stethoscopes, the Littman 3200 (39.416 in the B mode), Thinklabs One (38.29 in W mode), and Welch Allyn Meditron Acc (37.456 in H mode) exhibited the highest perceived loudness (Figure 7).
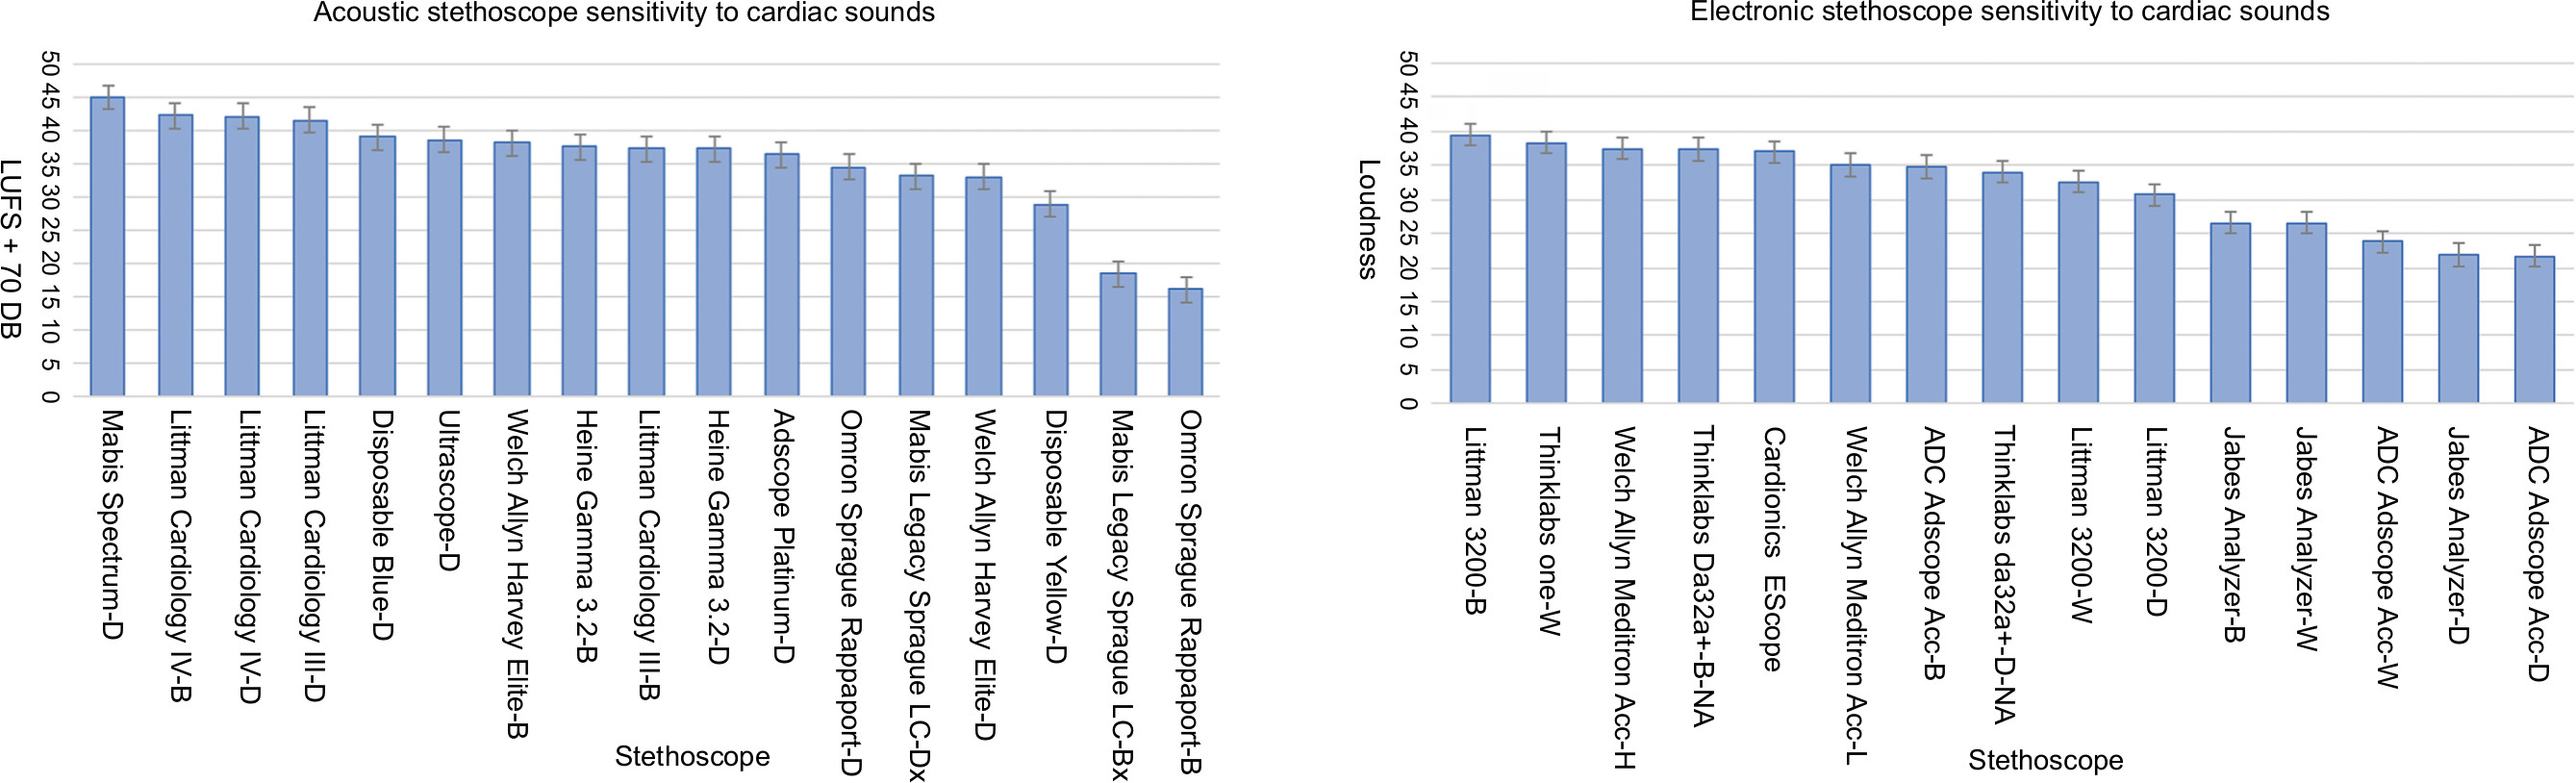 | Figure 7 Sensitivity to cardiac sounds 22–281 Hz. Note: The perceived loudness of acoustic stethoscopes (left) and electronic stethoscopes (right) to frequency range 22–281 Hz was measured to compare their sensitivity to cardiac sounds. Abbreviation: LUFS, Loudness Units relative to digital Full Scale. |
Of all stethoscopes evaluated, the Littman 3200 rejected the most noise within the frequency range associated with S1–S4, innocent murmurs, and MS cardiac sounds. However, many of the electronic stethoscopes exhibited poor noise rejection. Of the electronic stethoscopes, the Welch Allyn Meditron Acc (–19.004 in L mode) rejected the least noise. The Omron Sprague Rappaport (–18.198 in B mode) and the Mabis Legacy Sprague LC (–12.704 in B mode) are acoustic stethoscopes which exhibited poor noise rejection (Figure 8).
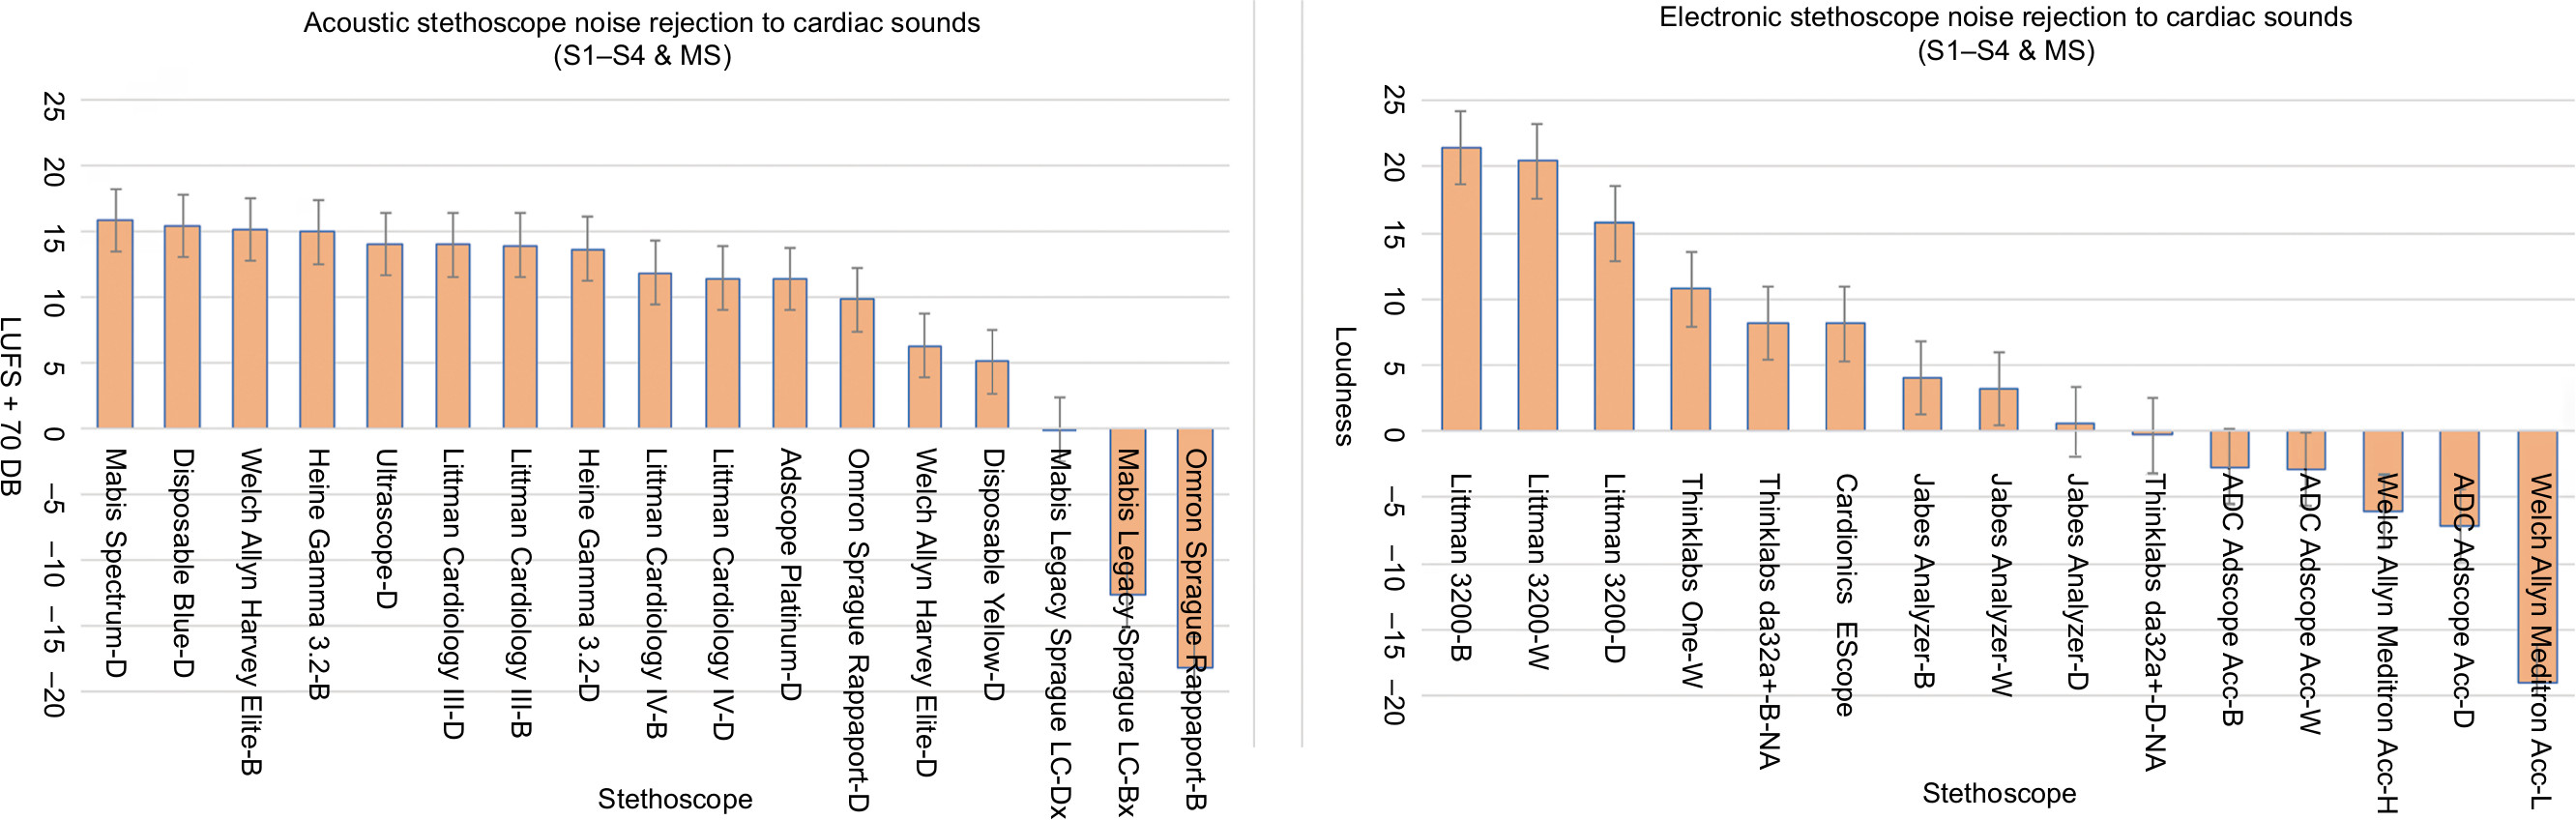 | Figure 8 Noise rejection of cardiac sounds 22–281 Hz. Note: Acoustic (left) and electronic (right) stethoscope noise rejection was measured at frequency ranges (22–281 Hz) of cardiac sounds such as S1–S4, innocent murmurs, and MS. Abbreviations: LUFS, Loudness Units relative to digital Full Scale; MS, mitral stenosis. |
Cardiac sounds (205–775 Hz: ventricular septal defect [VSD], atrial septal defect [ASD], aortic stenosis [AS], and pulmonic stenosis [PS])
Among acoustic and electronic stethoscopes, the Littman Cardiology IV (44.324 LUFS in B mode) exhibited the most perceived loudness of sounds within frequencies 205–775 Hz. In this frequency range, many of the electronic stethoscopes show a similar performance, with the Jabes Analyzer (39.404 in D mode) showing the most sensitivity to cardiac pathology sounds such as VSD, ASD, AS, and PS. Although the Littman 3200 (38.87) in D mode is sensitive, the same stethoscope (22.376) in B mode is not as sensitive in this frequency range (Figure 9).
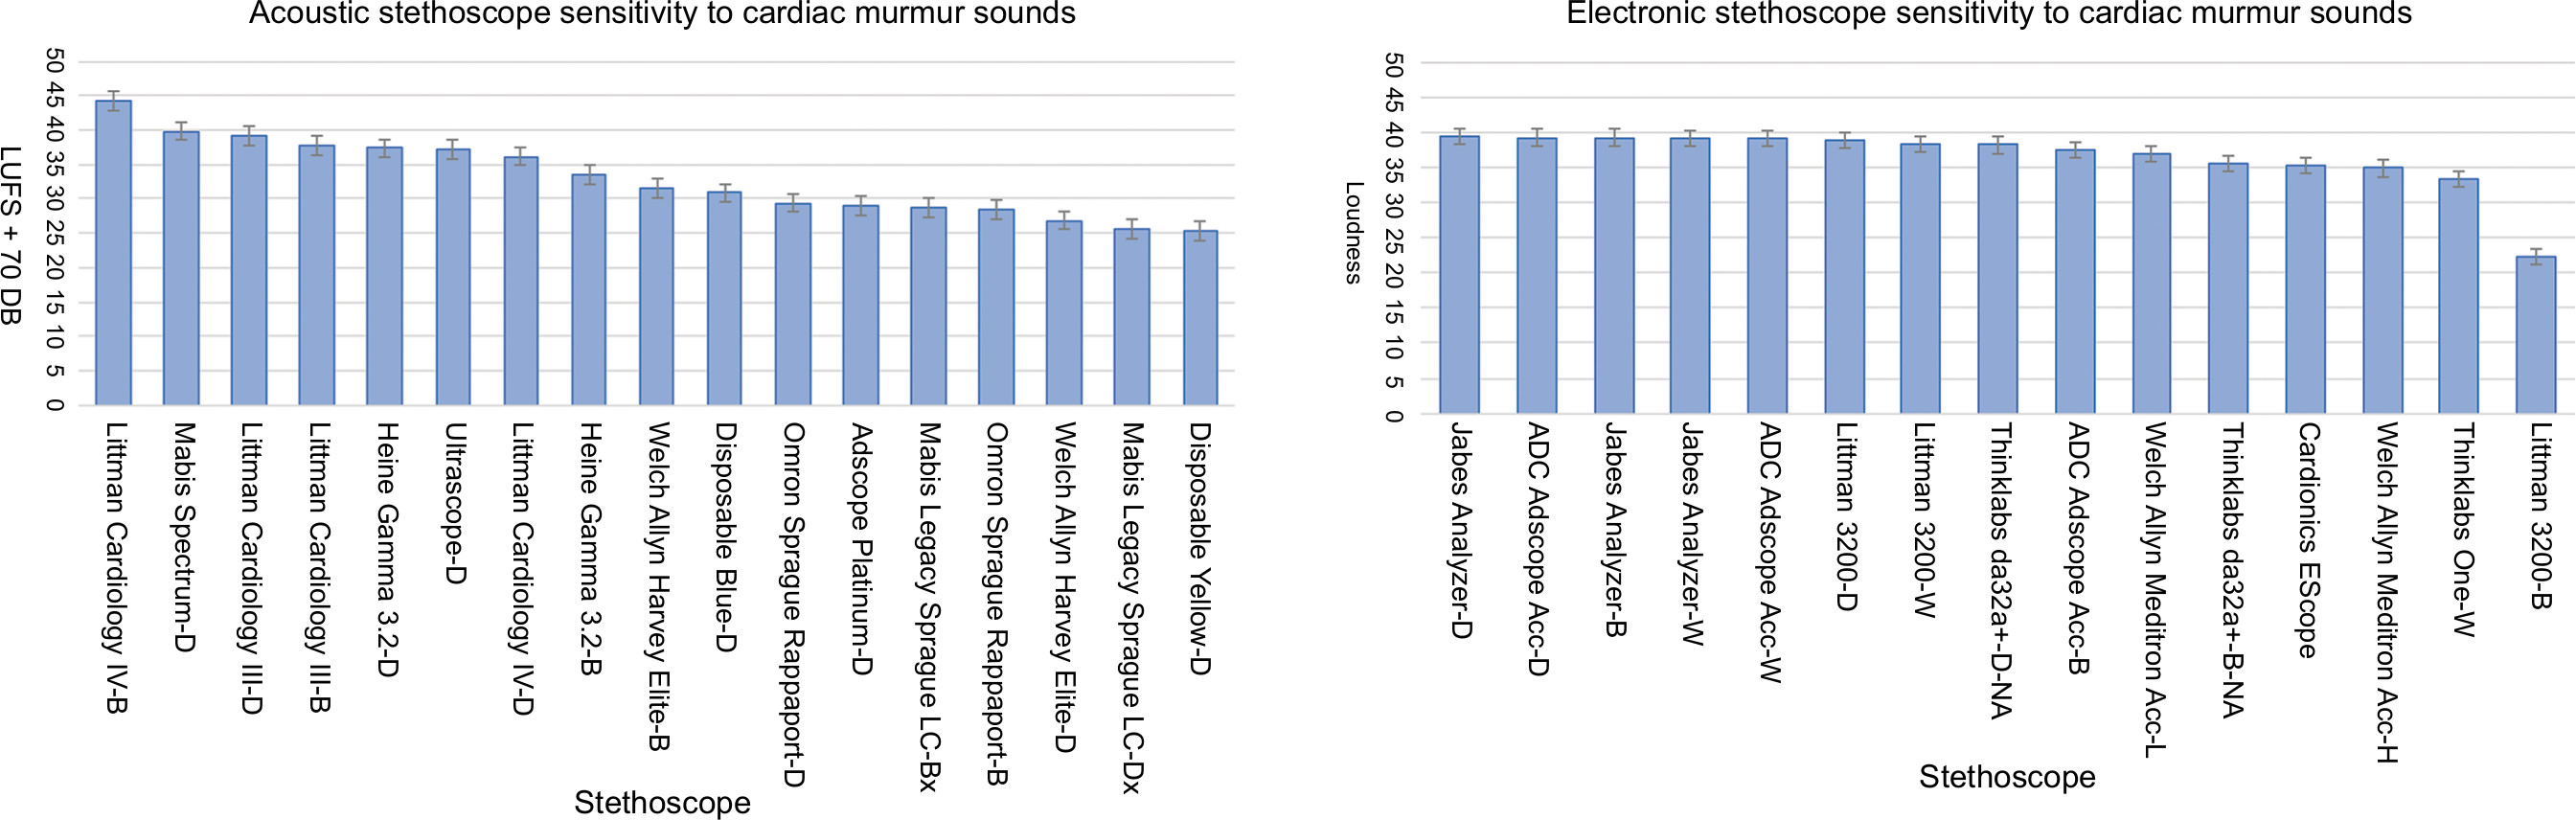 | Figure 9 Sensitivity to cardiac murmur sounds 205–775 Hz. Note: The perceived loudness of acoustic (left) and electronic stethoscopes (right) to frequency range 205–775 Hz was measured to compare their sensitivity to cardiac murmur sounds. Abbreviation: LUFS, Loudness Units relative to digital Full Scale. |
Of acoustic stethoscopes evaluated, the Heine Gamma 3.2 (16.504 in D mode) rejected the most noise, while the Welch Allyn Harvey Elite (4.338 in D mode) rejected the least noise in the frequency range associated with VSD, ASD, AS, and PS. The Littman 3200 is the electronic stethoscope which exhibited the most noise rejection (20.328 in W mode) and Welch Allyn Meditron Acc (–3.978 in H mode, –8.952 in L mode) exhibited the least noise rejection at this frequency range (Figure 10).
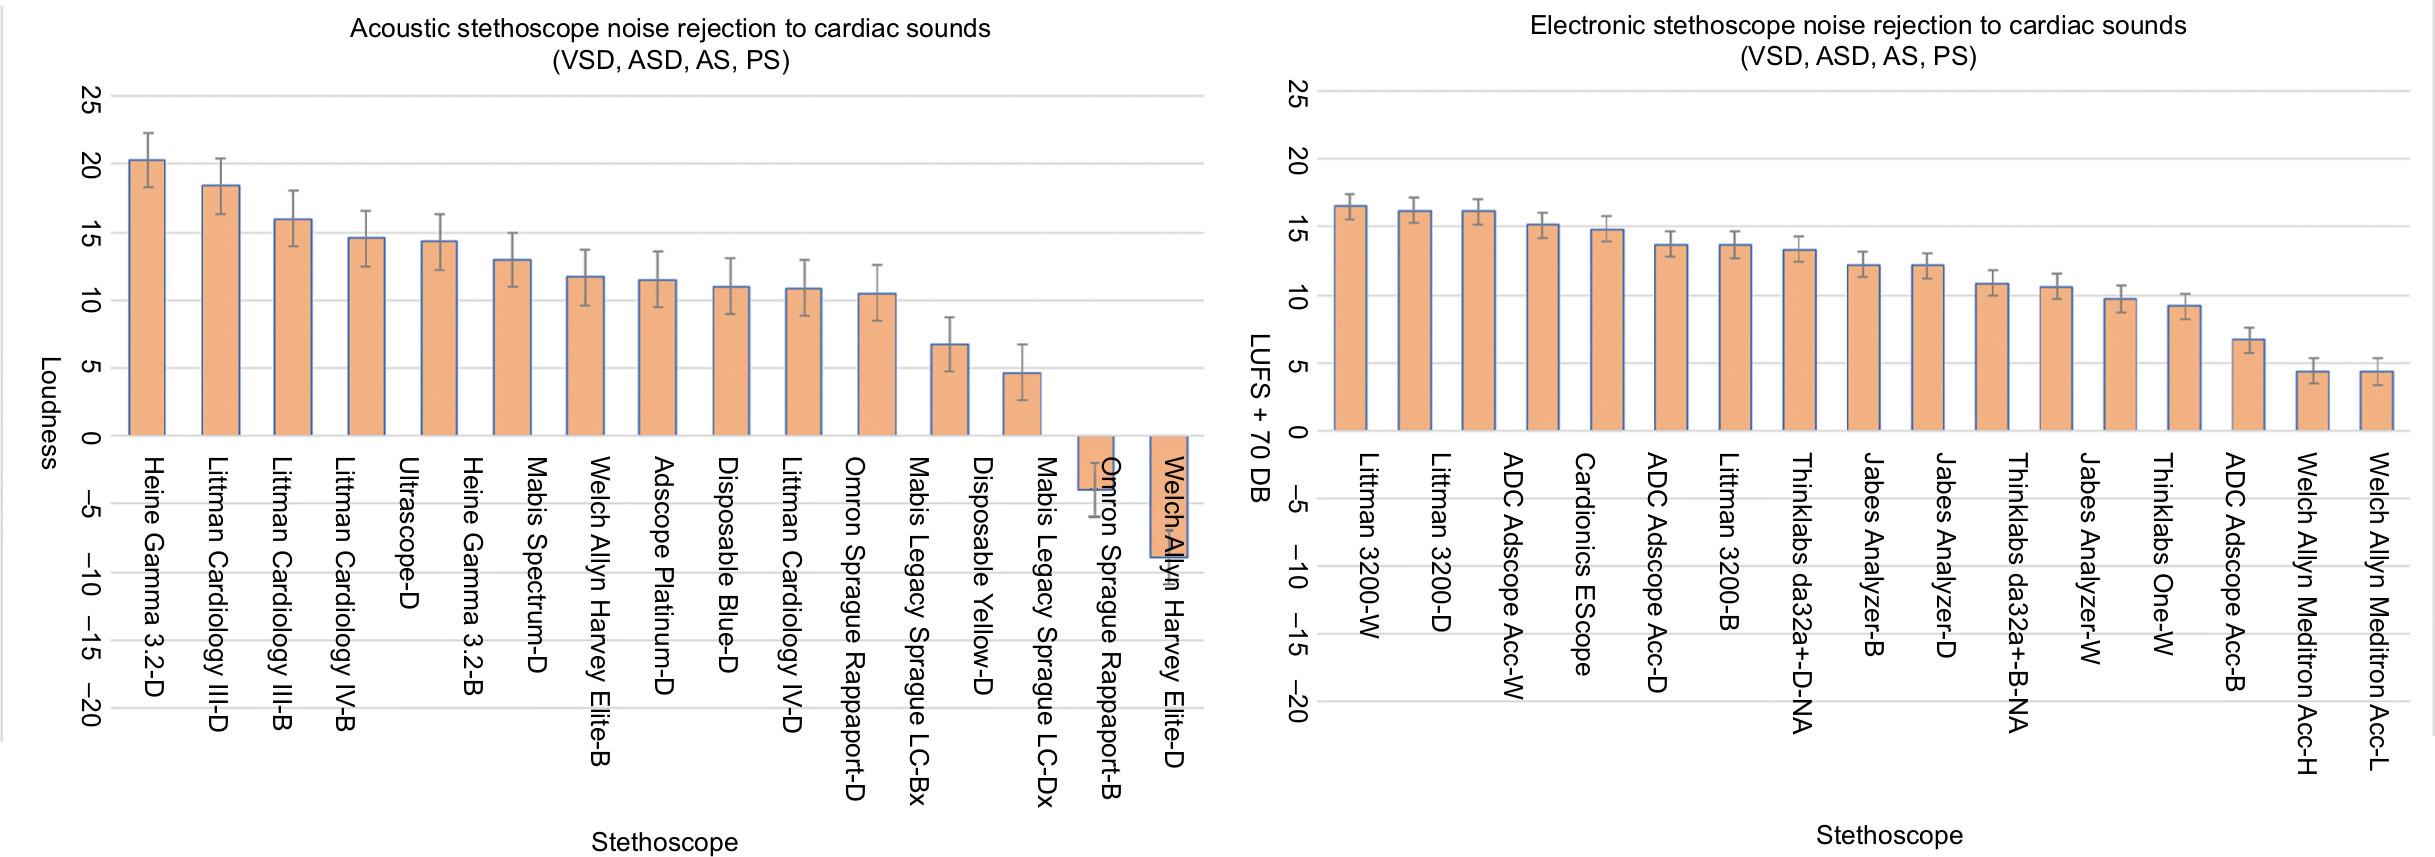 | Figure 10 Noise rejection of cardiac sounds 205–775 Hz. Note: Acoustic (left) and electronic (right) stethoscope noise rejection was measured at frequency ranges (205–775 Hz) of cardiac sounds such as VSD, ASD, AS, and PS. Abbreviations: AS, aortic stenosis; ASD, atrial septal defect; LUFS, Loudness Units relative to digital Full Scale; PS, pulmonic stenosis; VSD, ventricular septal defect. |
Respiratory sounds (689–2,584 Hz)
Among the acoustic stethoscopes, respiratory sounds with a frequency range 689–2,584 Hz could be heard best by the Mabis Spectrum (22.938 in D mode) and the Littman Cardiology IV (22.504 in B mode). The Welch Allyn Meditron Acc (29.245 in L mode) and the ADC Adscope Acc (29.006 in W mode, 29.096 in D mode) are the electronic stethoscopes which exhibited the most perceived loudness (Figure 11).
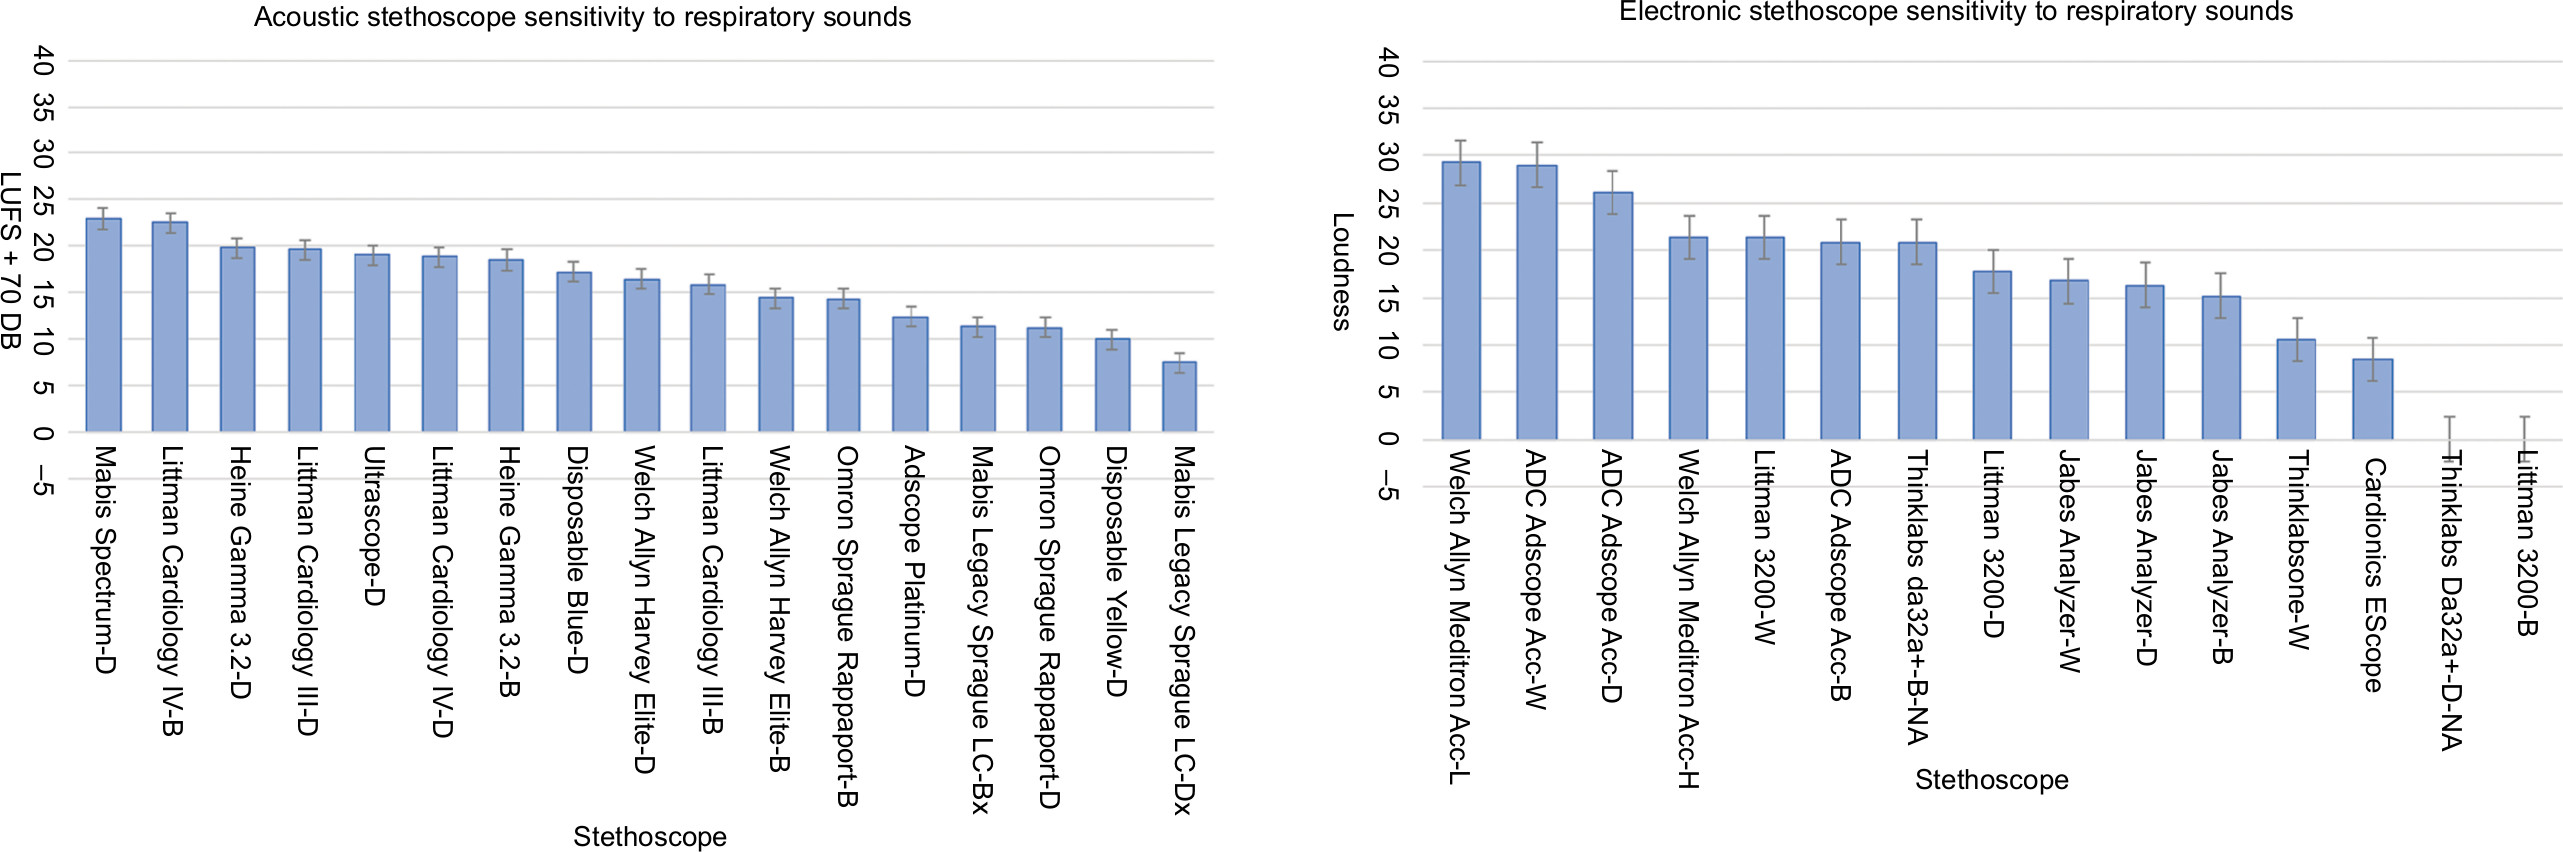 | Figure 11 Sensitivity to respiratory sounds. Note: The perceived loudness of acoustic (left) and electronic stethoscopes (right) to frequency range 689–2,584 Hz was measured to compare their sensitivity to respiratory sounds. Abbreviation: LUFS, Loudness Units relative to digital Full Scale. |
Most electronic and acoustic stethoscopes exhibit poor AMB rejection when auscultating respiratory sounds. Of all stethoscopes examined, the Littman 3200 exhibited the most noise rejection (14.162 in W mode and 9.452 in D mode). The acoustic stethoscope which rejected the most noise was the Mabis Spectrum (6.382 in D mode; Figure 12).
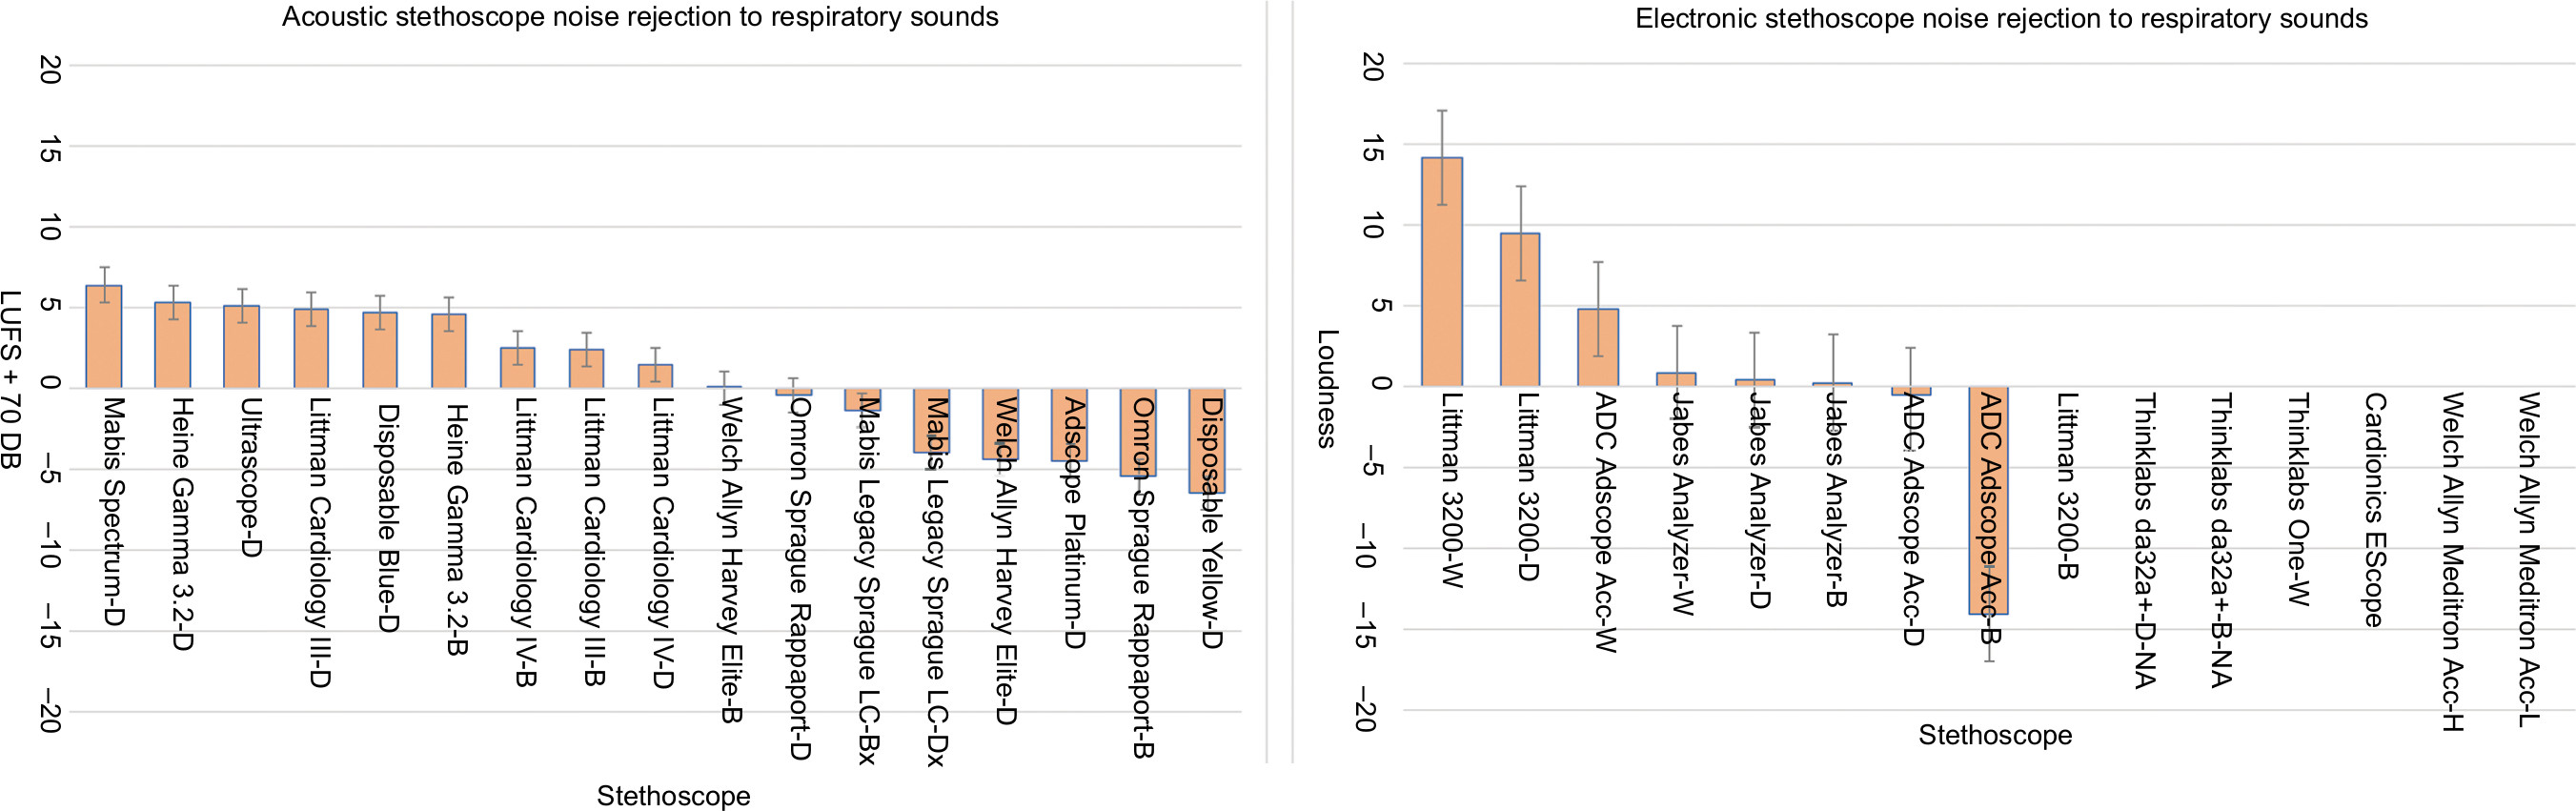 | Figure 12 Noise rejection of respiratory sounds. Note: Acoustic (left) and electronic (right) stethoscope noise rejection was measured at frequency ranges (689–2,584 Hz) of respiratory sounds. Abbreviation: LUFS, Loudness Units relative to digital Full Scale. |
Tracheal sounds and swallow sounds (2500–8,000 Hz)
All stethoscopes demonstrate a large amount of attenuation in this range. The software used to measure LUFS outputs a null result for all models due to this attenuation. It should also be noted that only very loud sounds (gastrointestinal, swallow, and tracheal sounds) may be audible in this range on some stethoscopes.
Discussion
This study has demonstrated a considerable variation among commercially available stethoscopes, both in terms of capturing clinically relevant sounds and in the ability to reject AMB. The Jabes Analyzer electronic stethoscope, for example, had excellent frequency response but poorer AMB rejection. While the Littman 3200 electronic stethoscope exhibited exceptional AMB rejection, it was not among the most sensitive stethoscopes.
Among the acoustic stethoscopes examined, the Mabis Spectrum and the Littman Cardiology IV were the most sensitive stethoscopes when auscultating frequency ranges associated with gastrointestinal, cardiovascular, and respiratory sounds. The perceived loudness of the electronic stethoscopes examined varied. Gastrointestinal sounds and cardiovascular murmurs were most audible when auscultating with the Jabes Analyzer and the ADC Adscope. The Welch Allyn Meditron also exhibited exceptional sensitivity to respiratory sounds.
Consistently, for all frequency ranges examined, the Littman 3200 is the electronic stethoscope which exhibited the most noise rejection. On the contrary, the Welch Allyn Meditron poorly rejected AMB, which may be due to its requirement of firm auscultating pressure to achieve normal performance. Of the acoustic stethoscopes, Omron Sprague poorly rejected AMB among all frequency ranges. Noise rejection analysis showed that there was no single top performing acoustic stethoscope. The Heine Gamma 3.2, Mabis Spectrum, Littman Cardiology III, and the Welch Allyn Harvey Elite were all capable of considerable AMB rejection.
Conclusion
An in vitro analysis of a variety of stethoscopes, both acoustic and electronic, has demonstrated considerable variation in stethoscope performance. A clinician should interpret these results for the frequency range relevant to their field of practice or for their envisioned operating environment (eg, noisy emergency room vs quiet office setting) to help facilitate stethoscope selection. The Littmann Cardiology IV and low-cost Mabis Spectrum were consistently the top two performers across all assessed parameters, thus possibly making both a reasonable choice for most acoustic stethoscope applications. The Littmann 3200 was an outstanding performer in the electronic category especially for low frequencies. However, it should be noted that all electronic stethoscopes had very similar performance below 1,000 Hz.
The data generated in this study demonstrate the need for new stethoscope technology that is better suited for capturing higher frequency (2,500–8,000 Hz) information. Advances in material science, mechanical design, digital signal processing, and data analysis should facilitate the development of groundbreaking stethoscope technology that breathes new life into the art of auscultation.
Disclosure
Daniel Weiss, Joseph Butera III, Ryan Copt, Glenn Yeaw, Mark Harpster, and James Hughes are employees of Bongiovi Medical & Health Technologies, Inc. Deeb N Salem is a grant recipient from Bongiovi Medical & Health Technologies, Inc. Christine Erie reports no conflict of interest in this work.
References
Choi S, Jiang Z. Cardiac sound murmurs classification with autoregressive spectral analysis and multi-support vector machine technique. Comput Biol Med. 2010;40(1):8–20. | ||
Beaumont CE. Choosing the best stethoscope. Nursing. 2007;37 Suppl Med:12–13. | ||
Johnston FD. AN acoustical study of the stethoscope. Arch Intern Med. 1940;65(2):328–339. | ||
Ortega R, Téllez A, Leija L, Vera A. Measurement of ultrasonic properties of muscle and blood biological phantoms. Phys Procedia. 2010;3(1):627–634. | ||
Sarbandi RR, Doyle JD, Navidbakhsh M, Hassani K, Torabiyan H. A color spectrographic phonocardiography (CSP) applied to the detection and characterization of heart murmurs: preliminary results. Biomed Eng Online. 2011;10:42. | ||
Kim D, Tavel ME. Assessment of severity of aortic stenosis through time–frequency analysis of murmur. Chest. 2003;124(5):1638–1644. | ||
Akbari MA, Hassani K, Doyle JD, et al. Digital subtraction phonocardiography (DSP) applied to the detection and characterization of heart murmurs. Biomed Eng Online. 2011;10:109. | ||
Noponen AL, Lukkarinen S, Angerla A, Sepponen R. Phono-spectrographic analysis of heart murmur in children. BMC Pediatr. 2007;7:23. | ||
Sung PH, Thompson WR, Wang JN, Wang JF, Jang LS. Computer-assisted auscultation: patent ductus arteriosus detection based on auditory time–frequency analysis. J Med Biol Eng. 2015;35(1):76–85. | ||
Reichert S, Gass R, Brandt C, Andrès E. Analysis of respiratory sounds: state of the art. Clin Med Circ Respirat Pulm Med. 2008;2:45–58. | ||
Pochekutova IA, Korenbaum VI. Diagnosis of hidden bronchial obstruction using computer-assessed tracheal forced expiratory noise time. Respirology. 2013;18(3):501–506. | ||
Bahoura M, Lu X. Separation of crackles from vesicular sounds using wavelet packet transform. In: IEEE International Conference on Acoustics, Speech and Signal Processing, 2006. | ||
Elphick HE, Ritson S, Rodgers H, Everard ML. When a “wheeze” is not a wheeze: acoustic analysis of breath sounds in infants. Eur Respir J. 2000;16(4):593–597. | ||
Oliveira A, Marques A. Respiratory sounds in healthy people: a systematic review. Respir Med. 2014;108(4):550–570. | ||
Hayashi N. Detection of pneumothorax visualized by computer analysis of bilateral respiratory sounds. Yonago Acta Med. 2011;54(4):75–82. | ||
Fiz JA, Jané R, Lozano M, Gómez R, Ruiz J. Detecting unilateral phrenic paralysis by acoustic respiratory analysis. PLoS ONE. 2014;9(4):e93595–e93599. | ||
Vyshedskiy A, Bezares F, Paciej R, Ebril M, Shane J, Murphy R. Transmission of crackles in patients with interstitial pulmonary fibrosis, congestive heart failure, and pneumonia. Chest. 2005;128(3):1468–1474. | ||
Ching SS, Tan YK. Spectral analysis of bowel sounds in intestinal obstruction using an electronic stethoscope. World J Gastroenterol. 2012;18(33):4585–4592. | ||
Ranta R, Louis-Dorr V, Heinrich C, Wolf D, Guillemin F. Digestive activity evaluation by multichannel abdominal sounds analysis. IEEE Trans Biomed Eng. 2010;57(6):1507–1519. | ||
Dumas J, Hill KM, Adrezin RS, et al. Feasibility of an electronic stethoscope system for monitoring neonatal bowel sounds. Conn Med. 2013;77(8):467–471. | ||
Craine BL, Silpa ML, O’Toole CJ. Two-dimensional positional mapping of gastrointestinal sounds in control and functional bowel syndrome patients. Dig Dis Sci. 2002;47(6):1290–1296. | ||
Cichero JA, Murdoch BE. Acoustic signature of the normal swallow: characterization by age, gender, and bolus volume. Ann Otol Rhinol Laryngol. 2002;111(7 Pt 1):623–632. | ||
Hubbert L, Sundbom P, Loebe M, Peterzén B, Granfeldt H, Ahn H. Acoustic analysis of a mechanical circulatory support. Artif Organs. 2014;38(7):593–598. | ||
Tavel ME, Bates JR. The cervical bruit: sound spectral analysis related to severity of carotid arterial disease. Clin Cardiol. 2006;29(10):462–465. |
 © 2019 The Author(s). This work is published and licensed by Dove Medical Press Limited. The
full terms of this license are available at https://www.dovepress.com/terms
and incorporate the Creative Commons Attribution
- Non Commercial (unported, 3.0) License.
By accessing the work you hereby accept the Terms. Non-commercial uses of the work are permitted
without any further permission from Dove Medical Press Limited, provided the work is properly
attributed. For permission for commercial use of this work, please see paragraphs 4.2 and 5 of our Terms.
© 2019 The Author(s). This work is published and licensed by Dove Medical Press Limited. The
full terms of this license are available at https://www.dovepress.com/terms
and incorporate the Creative Commons Attribution
- Non Commercial (unported, 3.0) License.
By accessing the work you hereby accept the Terms. Non-commercial uses of the work are permitted
without any further permission from Dove Medical Press Limited, provided the work is properly
attributed. For permission for commercial use of this work, please see paragraphs 4.2 and 5 of our Terms.