Back to Journals » Risk Management and Healthcare Policy » Volume 13
An Extensive Search Trends-Based Analysis of Public Attention on Social Media in the Early Outbreak of COVID-19 in China
Received 8 April 2020
Accepted for publication 8 August 2020
Published 26 August 2020 Volume 2020:13 Pages 1353—1364
DOI https://doi.org/10.2147/RMHP.S257473
Checked for plagiarism Yes
Review by Single anonymous peer review
Peer reviewer comments 3
Editor who approved publication: Professor Marco Carotenuto
Tiantian Xie,1 Tao Tan,2 Jun Li3,4
1Centre De Recherche Sur Les Liens Sociaux (CERLIS), Paris Descartes University, Paris, France; 2Institute of New Rural Development, South China Agricultural University, Guangzhou, People’s Republic of China; 3School of International Relations, Sun Yat-Sen University, Guangzhou, People’s Republic of China; 4School of Management, Curtin University, Perth, WA, Australia
Correspondence: Tiantian Xie Tel +33-651-837-168
Email [email protected]
Background: A novel coronavirus (COVID-19) caused pneumonia broke out at the end of 2019 in Wuhan, China. Many cases were subsequently reported in other cities, which has aroused strong reverberations on the Internet and social media around the world.
Objective: The aim of this study was to investigate the reaction of global Internet users to the outbreak of COVID-19 by evaluating the possibility of using Internet monitoring as an instrument in handling communicable diseases and responding to public health emergencies.
Methods: The disease-related data were retrieved from China’s National Health Commission (CNHC) and World Health Organization (WHO) from January 10 to February 29, 2020. Daily Google Trends (GT) and daily Baidu Attention Index (BAI) for the keyword “Coronavirus” were collected from their official websites. Rumors which occurred in the course of this outbreak were mined from Chinese National Platform to Refute Rumors (CNPRR) and Tencent Platform to Refute Rumors (TPRR). Kendall’s Tau-B rank test was applied to check the bivariate correlation among the two indexes mentioned above, epidemic trends, and rumors.
Results: After the outbreak of COVID-19, both daily BAI and daily GT increased rapidly and remained at a high level, this process lasted about 10 days. When major events occurred, daily BAI, daily GT, and the number of rumors simultaneously reached new peaks. Our study indicates that these indexes and rumors are statistically related to disease-related indicators. Information symmetry was also found to help significantly eliminate the false news and to prevent rumors from spreading across social media through the epidemic outbreak.
Conclusion: Compared to traditional methods, Internet monitoring could be particularly efficient and economical in the prevention and control of epidemic and rumors by reflecting public attention and attitude, especially in the early period of an outbreak.
Keywords: public attention, COVID-19, internet monitoring, search index
Introduction
Since December 2019, several cases of pneumonia of unknown causes have been reported in Wuhan.1 Within just a few months, the novel coronavirus has developed into a global pandemic. As of March 31, 2020, over 809,000 confirmed cases were reported worldwide, of which 81,518 were identified in China. Immediately after the outbreak in Wuhan, several exported cases were confirmed in South Korea, Japan, Thailand, Iran, and the EU due to the high transmissivity of the COVID-19.2 The most common symptoms of this epidemic were onset of fever, generalized weakness, and dry cough, with clinical presentations greatly resembling viral pneumonia. The incubation period of the virus in the human body is generally 3–7 days (within 14 days).3 This new type of coronavirus is not as fatal as people thought based on the current data. At present, the mortality of COVID-19 in China is 3.67% according to the situation report by China’s National Health Commission (CNHC),4 compared with 9.6% for SARS and 34.4% for MERS reported by the World Health Organization (WHO).5,6
The COVID-19 pandemic has generated a huge impact on social media behaviors across the world internet community, in particular at the early outbreak in China when global attention was focused on the situation in Wuhan and Hubei province, the epicenter of the epidemic outbreak. China has exhibited fast Internet growth in recent years. According to the latest version of the China Internet Development Statistical Report published by China Internet Network Information Center (CNNIC),7 there were 854 million Internet users (61.2% of the total population) and 847 million cell phone users as of June 2019. Meanwhile, social media has become the primary source for the vast majority of internet users in accessing news and acquiring real-time information in China and across the world. Due to the expansion of Wi-Fi coverage, the maturity of Fourth generation (4G) networks and the popular growth of Fifth generation (5G) networks, Chinese Internet users spent on average 27.9 hours per week online. At the global level, there are 38 billion netizens (over 50% of the whole population) according to the latest Internet Trends Report by Mary Meeker; the Internet penetration is 48% in Asia Pacific, 78% in Europe, 32% in Africa and the Middle East, 62% in Latin America and the Caribbean, and 89% in North America.8
With the increase in global Internet penetration, people are used to obtaining information and expressing their opinions online. Participation and attention of Internet users can to some extent represent the public reactions and attitudes to an event. As the leverage of the world’s netizens is increasing, public opinion plays an important role in the appeal and participation of many public emergencies, for instance, people spontaneously started using social media to express their dissatisfaction and organize protest marches in France’s Yellow vests movement in 2019.9 In recent years, Internet search trends have been widely used in scientific researches in European and American countries. There were many previous researches based around these data, for instance, forecasting of tourism demand,10 prediction of unemployment,11 monitoring of public health and major mental illness.12–14 Monitoring public reactions through Internet and major social media platforms (Twitter and Facebook) has become a popular topic, especially in the prevention and control of some infectious diseases, such as Measles,15 Ebola,16 and other diseases.17–19 Similar to the situation in the regions mentioned above, researchers in many Asian countries have also verified that Internet search trends and social media data could be considered as an important and effective way for the assessment of public attention, risk perception, and behavioral responses to the epidemic outbreaks, since the outbreak of SARS in 200220 to the outbreak of COVID-19.21–23 The reaction of netizens can generally represent the public response to the emergency, and people in different countries often have different concerns, which provided us a useful tool to better understand the public concerns as well as to prevent and control the epidemic outbreaks.17–19,24
Rational public opinion and correct information transmission from the authorities and authoritative experts can enhance persons’ understanding of the outbreaks and relieve their panic. However, the transmission of much contradictory and false information may cause an information overload as well as confusion,25 which will arouse fear and anxiety that could in turn nourish rumors. For example, it is difficult for people to understand whether face masks can be reused during the epidemic outbreaks, since a thousand posts have a thousand answers.26–28
Today, people get information in different ways, but web search engines are a common choice for Internet users around the world. Baidu is the most popular search engine in China, 90.9% of Internet users have reported to prefer Baidu as their default search engine according to the latest Chinese Internet Search Engine Usage Research Report.29 However, in other countries and regions outside China, people choose Google with priority selection incidence of 92.07%, according to the latest Search Engine Market Share Worldwide Report.30 Based on quantitative analyses with data mined from both Baidu and Google indexes, this study aims to argue that Internet monitoring is a convenient and cost-effective way to assess public reactions, which can provide evidence to all governments and the public in the world to handle public health emergency problems in case of epidemic outbreaks.
Materials and Methods
Overview
In order to examine the public attention to the outbreak of COVID-19, we utilize a search index which uses keywords as statistical objects to scientifically analyze and calculate the weighted sum of the search frequency in a specific area and time. In short, the more Internet searches the higher the search index, which could illustrate the degree of public concern.31 Baidu Attention Index (BAI) and Google Trends (GT), two major search indexes, were searched from January 10 to February 29, 2020, for comparing with some disease-related factors. This outbreak has caused widespread concern in the world, especially on the Internet.32 Therefore, our study sample was the global netizens (Internet users) during the study period of this coronavirus outbreak.
Data of Cases
Disease-related data, including cumulative confirmed cases, cured cases, death cases, new confirmed cases, new cured cases, new death cases, as well as cumulative cure rates and fatality rates were collected for each day during the first 51 days (from January 10, to February 29) of the outbreak, because most Chinese cities except Wuhan have reported zero new confirmed cases for several consecutive days until 29 February.
All reported cases in China were collected from the Daily Epidemic Outbreak Notification released by China’s National Health Commission (CNHC). The reported cases outside China were obtained from the Daily Situation Reports issued by WHO.
Data of Internet Monitoring of Public Attentions
Through the correlation test, we found that in the early stage of the outbreak, correlation between the keyword “Coronavirus” in Chinese for BAI and the epidemic trends were significant, while “New coronary pneumonia” and “Epidemic” were not. Similarly, we found that the keyword “Coronavirus” for GT compared with other keywords such as “Corona” or “COVID-19” can better reflect the public’s concern about the epidemic situation during the study period. Therefore, we gathered the BAI with “ Coronavirus” in Chinese as the keyword, from the web page of Baidu Index on March 11,33 at the same time, we collected the daily GT as a supplementary data source by using the keyword “Coronavirus” from the web page of Google Trends.34 Besides, we collected 385 rumors identified and confirmed by the Chinese authorities during the study period from Chinese National Platform to Refute Rumors (CNPRR) and Tencent Platform to Refute Rumors (TPRR).35,36 The former is the Chinese official rumor-refuting platform which made rumors verified and confirmed by the authority public, the latter was established by China’s largest Internet company Tencent whose mission is to seek out misinformation by monitoring the Top topics ranking on social platforms and mark them so as not to be reposted.
The data used in this research are all officially published on the internet and do not contain any privacy information.
Statistical Analysis
To represent the public attention, we have graphed the curves of epidemic trends based on collected data. We compared the daily BAI and daily GT over time with the disease-related data to explore the changes of public attention. It can be seen from the previous studies, both Spearman’s and Kendall’s rank correlation coefficient are appropriate to analyze the correlation between two continuous or discrete ordinal variables.24,37,38 The data used in this study is continuous but does not conform to the normal distribution, for this reason, the Kendall’s Tau-B rank correlation coefficient was used to check the statistical correlation. The statistical significance was set at P<0.05. Rumors during COVID-19 outbreaks were classified by date and main content. These correlation analyses were performed by using the commercial software “Statistical Package for the Social Sciences” (SPSS package for Windows, v25.0.0, IBM Corporation, Armonk, NY, US).
All data was checked for completeness and accuracy before analysis.
Results
COVID-19 Epidemic Trend
On January 11, 2020, Wuhan Municipal Health Commission (WMHC) initially reported 41 cases of human infections with an unknown new coronavirus.39 Afterwards, more cases were consecutively reported in other provinces.
Due to the approaching of Chinese New Year, there was a large population movement that promoted the spread of coronavirus. The number of cumulative confirmed cases was 440 on 21 January, 2020 and rose alarmingly to 830 2 days later. Subsequently, the Chinese government announced the quarantine of Wuhan and took a series of measures to reduce population movements. However, the number of infected patients has still increased dramatically. By February 6, 31,211 cases had been reported in 31 provinces of China. By mid-February, the growth of confirmed cases was slowing down gradually and the cumulative case cure rate was continuously rising. By February 29, 79,968 cumulative confirmed cases and 41,675 cured cases (cumulative case cure rate=52.11%), and 2873 death cases (cumulative case fatality rate=3.59%) had been reported in China (Figure 1).
 |
Figure 1 The cumulative confirmed cases, cumulative case cure rate, and cumulative case fatality rate of COVID-19 in China from January 10, to February 29, 2020. |
Daily Google Trends for COVID-19 in China
Overseas Public Attention to the Outbreak of COVID-19 in China
At the beginning, the daily GT for keyword “coronavirus” remained stable. From January 20, it increased rapidly in the next 8 days due to the outbreak of COVID-19 in China. When the WHO declared this outbreak to be a public health emergency of international concern (PHEIC) on January 30,40 the daily GT reached a peak of 31 the following day. Subsequently, the daily GT gradually declined with small fluctuations until February 20. From February 21, coronavirus infections grew exponentially outside China, so that daily GT increased again and reached another peak of 55 on February 28.
Correlation Analysis Between Daily Google Trends and Disease-Related Indicators
We carried out the correlation analysis to investigate the relationship between disease-related indicators and daily GT for the rise and fall of public attention. The analysis illustrated a statistically significant positive correlation between the following sets of data: daily GT and cumulative confirmed cases (Kendall’s Tau-B rank correlation coefficient=0.349, P=0.001, daily GT and new confirmed cases (Kendall’s Tau-B rank correlation coefficient=0.323, P=0.001), daily GT and new cured cases (Kendall’s Tau-B rank correlation coefficient=0.279, P=0.006), daily GT and cumulative cured cases (Kendall’s Tau-B rank correlation coefficient=0.346, P=0.001), daily GT and cumulative death cases (Kendall’s Tau-B rank correlation coefficient=0.349, P=0.001), daily GT and new death cases (Kendall’s Tau-B rank correlation coefficient=0.226, P=0.027). In other words, daily GT increases as each of the indicators above increases. We also found that there was a negative relevant between daily GT and cumulative case cure rate (Kendall’s Tau-B rank correlation coefficient=-0.285, P=0.005). However, we found there was no correlation between the daily GT and cumulative mortality rate (Kendall’s Tau-B rank correlation coefficient=0.090, P=0.361). The results are graphedshown in Figures 2 and 3.
 |
Figure 2 The daily GT for keyword “Coronavirus” compared with cumulative confirmed cases, new confirmed cases (A) and cumulative case cure rate, cumulative case fatality rate (B) from January 10 to February 29, 2020. |
 |
Figure 3 The daily GT for keyword “Coronavirus” compared with new cured cases, new death cases (A) and cumulative cured cases, cumulative death cases (B) from January 10 to February 29, 2020. |
In summary, daily GT was associated with multiple indicators, suggesting that overseas netizens were eager to have as much information as possible of COVID-19 through the internet in the early stage of the outbreak in China.
Daily Baidu Attention Index for COVID-19 in China
Public Attention of China Mainland to the Outbreak of COVID-19
Prior to January 19, 2020, the information and news related to the novel coronavirus were not widely disseminated to the public, so the BAI remained at a relatively low level. COVID-19 began to spread in areas other than Hubei province from January 19, and the daily BAI for the Chinese keyword increased sharply, peaking at 2,330,851 on January 25. Then, the daily BAI decreased with fluctuations. As provinces began one by one to launch a first-level response to the major public health emergency, the daily BAI remained at a high level of more than 1,500,000 from January 26 to January 29. Afterwards, the daily BAI steadily declined, falling below the median level of about 1, 000,000 on February 15.
Correlation Analysis Between Daily Baidu Attention Index and Disease-Related Indicators
We conducted correlation analysis on daily BAI and disease-related indicators. Statistical correlation analysis showed that daily BAI was positively correlated with new confirmed cases (Kendall’s Tau-b rank correlation coefficient=0.581, P=0.000) (Figure 4A). Besides, daily BAI has a negative correlation with cumulative cases cure rate (Kendall’s Tau-b rank correlation coefficient=0.586, P=0.000) (Figure 4B). It was also positively correlated with new death cases (Kendall’s Tau-b rank correlation coefficient=0.209, P=0.003) (Figure 5A). We found there is no correlation between daily BAI and other indicators, for example cumulative confirmed cases, new cured cases, cumulative cases cure rate, and cumulative case fatality rate.
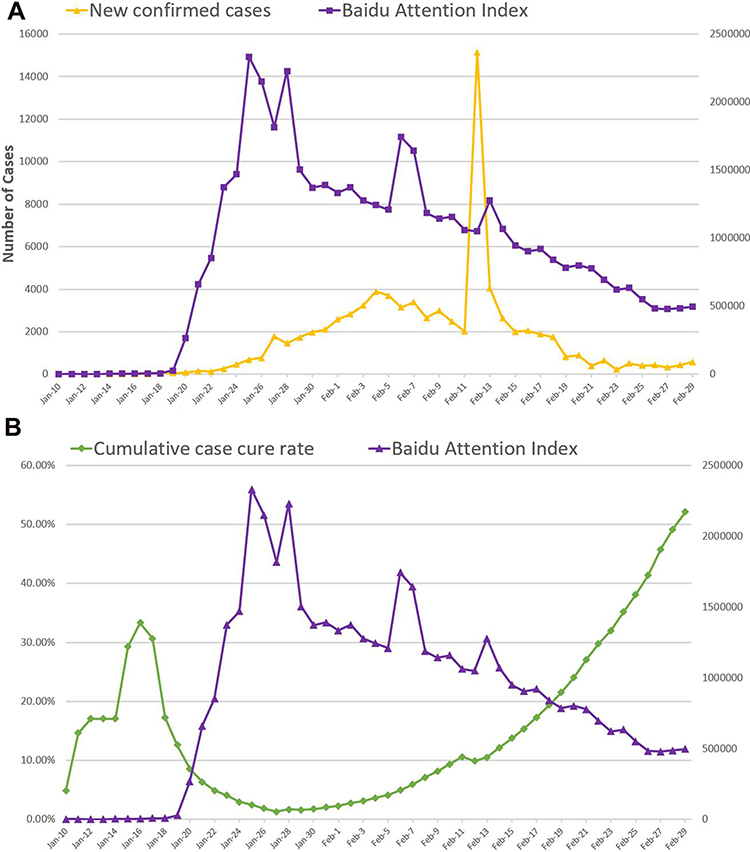 |
Figure 4 The daily BAI for keyword “Coronavirus” compared with new confirmed cases (A) and cumulative case cure rate (B) from January 10 to February 29, 2020. |
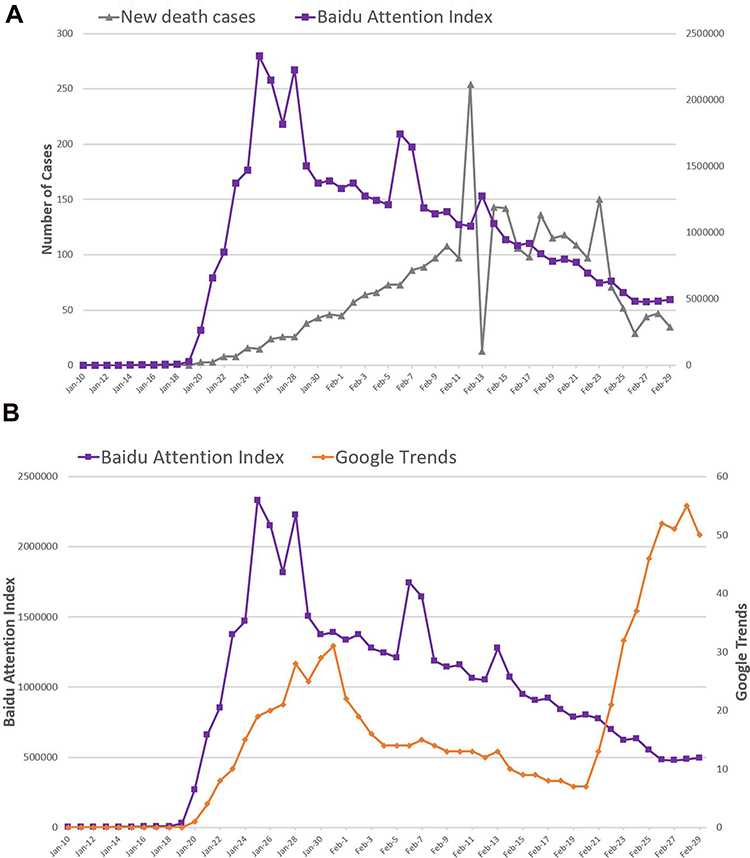 |
Figure 5 (A) The daily BAI for keyword “Coronavirus” compared with new death cases from January 10 to February 29, 2020. (B) The daily BAI for keyword “Coronavirus” compared with daily GT for keyword “Coronavirus” from January 10 to February 29, 2020. |
To summarize, daily BAI generally showed a similar trend to daily GT but not exactly in the same way (Figure 5B). Daily BAI was only correlated to three indicators (by comparison, seven indicators were correlated to daily GT). This showed that Chinese people who were in the epicenter knew more about the epidemic situation, compared with foreign netizens, they just cared about the new infected cases and their cure rate. In other words, they focused on whether the epidemic was being effectively controlled.
Rumors of COVID-19 Outbreaks in China
The epidemic-related rumors began to circulate as the COVID-19 broke out and spread. From January 10 to February 29, we collected a total of 385 rumors from CNPRR and TPRR. We found most of them were spread through group chats and official accounts on WeChat, the most popular messaging and social media app in China. In addition, Sina Weibo blog (Chinese microblogging website) is another major site for the spread of rumors.
Of these rumors, 40.3% (155/385) disseminated incorrect information on how to prevent and treat the new coronavirus; 29.1% (112/385) were about the spread of infections in different cities, and among them, 37 rumors related to Wuhan. Additionally, 5.7% (22/385) were about the shortage of daily necessities and medical supplies such as food and masks, and 2.9% (11/385) were spoofing in the name of Professor Nanshan Zhong, who is not only head of China’s COVID-19 Experts Team but the key person in the successful fight against SARS in 2003. He was the first professor who suggested that COVID-19 could be transmitted from person to person, people did believe that his opinions were authoritative and instructive.
Through the investigation of rumors, we discovered that the purpose of producing and spreading rumors is on the one hand to attract people’s attention or more visits to rumor makers’ homepages on social media. On the other hand, the uncertainty of COVID-19 breeds anxiety, which on its own has been linked to rumor spreading.41
The result of statistical correlation analysis between rumors and disease-related indicators showed that the number of rumors has a significant positive correlation with daily BAI (Kendall’s Tau-b rank correlation coefficient=0.660, P=0.000) (Figure 6A). Furthermore, the number of rumors was positively correlated with new confirmed cases (Kendall’s Tau-b rank correlation coefficient=0.552, P=0.000) (Figure 6B). Besides, the number of rumors also had a positive correlation with new death cases (Kendall’s Tau-b rank correlation coefficient=0.330, P=0.000) (Figure 7A). However, the number of rumors was negatively correlated with cumulative case cure rate (Kendall’s Tau-b rank correlation coefficient=−0.369, P=0.001) (Figure 7B).
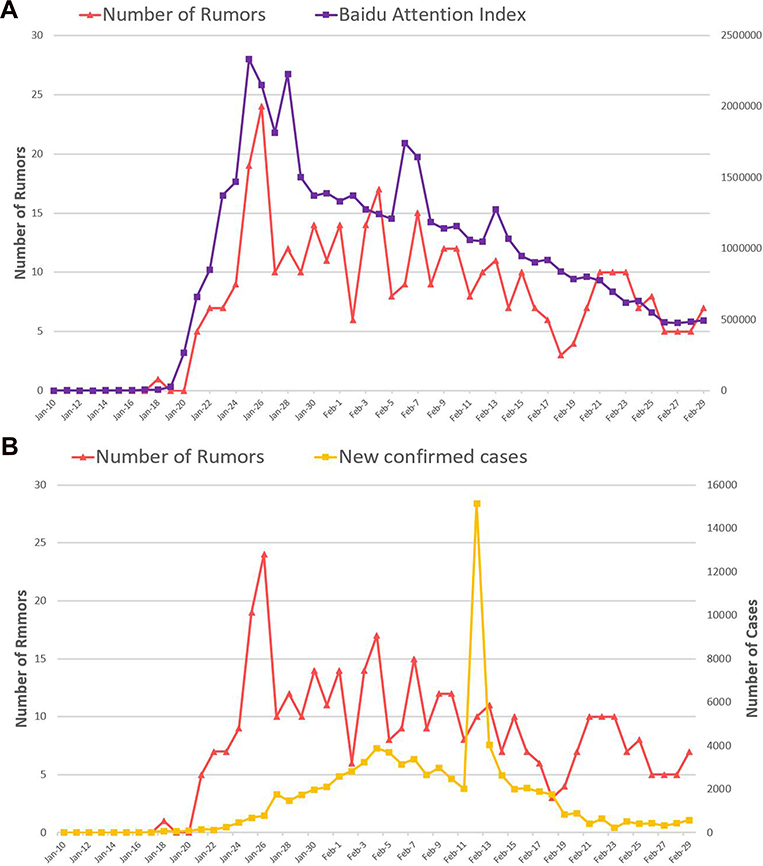 |
Figure 6 The number of rumors compared with daily BAI for keyword “Coronavirus” (A) and new confirmed cases (B) from January 10 to February 29, 2020. |
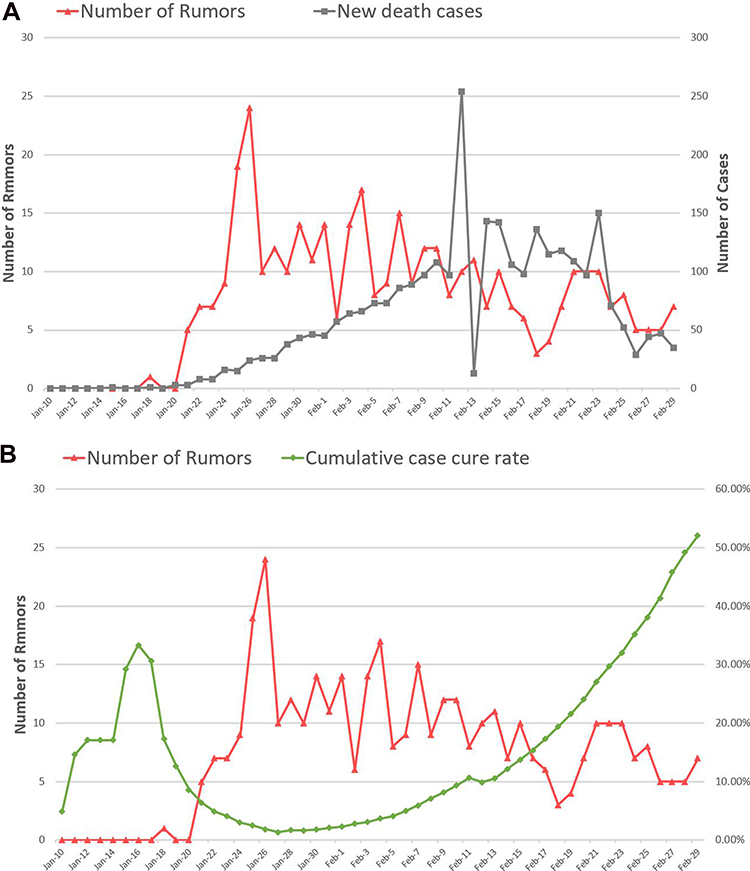 |
Figure 7 The number of rumors compared with new death cases (A) and cumulative case cure rate (B) from January 10 to February 29, 2020. |
Generally speaking, rumors of COVID-19 outbreaks affected daily BAI. The growth of new confirmed cases and new death cases seemed to increase the number of rumors. The severity of the epidemic situation also determined the number of rumors. Fears and insecurity due to a lack of information at the initial outbreak stage led people to pay much attention to the epidemic, however, as the cure rate increased and more information was made available to the public, individuals were optimistic about the development of the epidemic, so their panic eased and the number of rumors decreased.
Discussion
Principal Findings
Internet-based analysis is a powerful tool in the new era. Baidu, Google, and other search engines are used by more and more scholars around the world to carry out academic research.38,42–49 In this research, we used Internet search trends to probe public attention to COVID-19. This showed that both daily BAI and daily GT began to rise sharply on January 19, after the outbreak, and reached a peak in a short period of time, then the high attention lasted approximately 10 days. Afterwards, both indexes have decreased because of the initial positive effect of epidemic control. It is worth mentioning that the daily GT rose again on February 20, because the epidemic began to spread widely in other countries. Our study showed that in the early stages of COVID-19, public attention increased as new cases were confirmed, however it diminished as the cure rate rose. This suggests a rapidly spreading epidemic would promptly draw public attention which would decrease when its threat decreased. Therefore, it is necessary for government to take appropriate measures and provide more information to address public’s concerns as early as possible by monitoring the public reactions through the Internet and social media. Daily GT was directly proportional to the cumulative confirmed cases, cumulative cured cases, and cumulative death cases, but daily BAI was not. The reason for this phenomenon is that the early outbreak of COVID-19 was in China, so Chinese netizens can naturally learn about the early news of the epidemic more quickly than those from other countries, they did not have to deliberately search the Internet for information, because they can easily get the latest data from TV, newspapers, community, and family.
The outbreak of COVID-19 was accompanied by a variety of rumors. According to our research, the number of rumors is positively correlated with new confirmed cases and new death cases, which also has the same trend with the growth of daily BAI. Furthermore, the emergence of breaking news can often make the index of rumors reach a peak. This indicates that uncertainty and severity of the new epidemic are major factors in encouraging rumors to which public attention is easily attracted. Moreover, Internet and social media have become a vehicle of transmitting rumors. The vast majority of rumors that we collected came from social media platforms such as WeChat and Weibo. It suggests that social media was a two-edged sword. Although it can spread rumors, it was also a convenient tool for those refuting false messages if authoritative information could be released in time. In addition, if government invited experts who have received public attention to clarify misinformation during the early period of the outbreak, it would effectively help to dispel unnecessary panic and prevent the spread of rumors.
An important policy component in the prevention and control of such infectious diseases as COVID-19 is monitoring. Traditional epidemic monitoring mainly relies on data provided by hospitals, medical institutions, and Centers for Disease Control and prevention (CDC) at different levels.50–52 Yet, this monitoring system has some deficiencies. Firstly, the relevant data is collected and processed by each unit level by level, which may lead to a loss of important information during the process and a delay in acquiring analysis results. Secondly, a traditional monitoring method consumes a lot of manpower and resources, however the data is rarely published and made available to the public.19,24 Internet monitoring has largely improved the data acquisition process and can overcome these deficiencies from three perspectives. First, billions of netizens learn about the latest epidemic situation through the Internet. Data collected in this way can represent the attention of most people. Besides, the search trends were generated based on the daily search behaviors of the public, which can automatically record the public attention. Compared with traditional methods such as epidemiological surveys and telephone interviews,49–53 this data acquisition method can significantly reduce the time and efforts. Moreover, the data is always shared, and everyone can download it for free, which can maximize savings.
Limitations
Our study has some limitations. For instance, data used in this research was mined from Baidu and Google, two giants in the search service market, which does not mean that the data from niche search engines are not important. Similarly, for people who live in regions with low Internet penetration rate, whose attention to the outbreak of COVID-19 was ignored.
Conclusions
Our research shows that internet users in China and other countries have attached great attention to the COVID-19 outbreak, but their focuses were slightly different. During the first 10-day period of the outbreak, public attention increased rapidly and remained at a high level. This was a key period for the governments to release relevant and authoritative information to minimize the spread of groundless rumors on social media. Publishing accurate information through major social media platforms can quickly clarify rumors and prevent their further spread. In sum, Internet monitoring is a quick and convenient way to reflect public attention, which will greatly enhance the ability of governments and the public to address public health emergencies. Our study suggests that government should attach more importance to the monitoring of Internet search trends platforms such as Baidu Attention Index and Google Trends during the epidemic outbreaks. In particular, in the early stages of a new coronavirus outbreak, governments need to make proper use of the data of public attention, and take responsible measures in a timely manner for scientific popularization of fighting against the epidemic, in light of relieving people’s concerns, and clarifying confusions and misunderstandings among the general public.
Author Contributions
All authors made substantial contributions to conception and design, acquisition, analysis, and interpretation of data; took part in drafting the article and revising it critically for important intellectual content; gave final approval of the version to be published; and agree to be accountable for all aspects of the work.
Disclosure
The authors have no conflicts of interest with any individuals or organizations.
References
1. Zhu N, Zhang D, Wang W, et al. A novel coronavirus from patients with pneumonia in China, 2019. N Engl J Med. 2020;382(8):727–733. doi:10.1056/NEJMoa2001017
2. WHO. Novel coronavirus (2019-nCoV) situation Report-43. https://www.who.int/docs/default-source/coronaviruse/situation-reports/20200303-sitrep-43-covid-19.pdf?sfvrsn=76e425ed_2.
3. Wang Z, Yang B, Li Q, Wen L, Zhang R. Clinical Features of 69 Cases with Coronavirus Disease 2019 in Wuhan, China. Clin Infect Dis. 2020. doi:10.1093/cid/ciaa272
4. NHC. Daily situation Report of COVID-19. http://www.nhc.gov.cn/xcs/yqtb/202003/c588ee20113b4136b27f2a07faa7075b.shtml. Accessed March 11, 2020.
5. WHO. Middle East respiratory syndrome coronavirus (MERS-CoV). http://www.who.int/emergencies/mers-cov/en/.
6. WHO. Summary of probable SARS cases with onset of illness from 1 November 2002 to 31 July 2003. https://www.who.int/csr/sars/country/table2004_04_21/en/.
7. CNNIC. Statistical Report on Internet Development in China. China Internet Network Information Center. Beijing [in Chinese]. http://www.cnnic.cn/hlwfzyj/hlwxzbg/hlwtjbg/201908/P020190830356787490958.pdf. Accessed March 11, 2020.
8. Meeker M. Internet Trends 2019 Report. https://www.bondcap.com/report/itr19/.
9. Anderson KB. France’s yellow vests: A self-mobilised mass movement with insurrectionist overtones. Green Left Wkly. 2019;1207:1.
10. Li X, Pan B, Law R, Huang X. Forecasting tourism demand with composite search index. Tour Manag. 2017;59:57–66. doi:10.1016/j.tourman.2016.07.005
11. Francesco D. Predicting unemployment in short samples with internet job search query data. 2009.
12. Yin S, Ho M. Monitoring a toxicological outbreak using Internet search query data. Clin Toxicol. 2012;50(9):818–822. doi:10.3109/15563650.2012.729667
13. Yang AC, Huang NE, Peng C-K, Tsai S-J. Do seasons have an influence on the incidence of depression? The use of an internet search engine query data as a proxy of human affect. PLoS One. 2010;5(10):e13728. doi:10.1371/journal.pone.0013728
14. Ingram DG, Plante DT. Seasonal trends in restless legs symptomatology: evidence from Internet search query data. Sleep Med. 2013;14(12):1364–1368. doi:10.1016/j.sleep.2013.06.016
15. Mollema L, Harmsen IA, Broekhuizen E, et al. Disease detection or public opinion reflection? Content analysis of tweets, other social media, and online newspapers during the measles outbreak in The Netherlands in 2013. J Med Internet Res. 2015;17(5):e128. doi:10.2196/jmir.3863
16. Fung IC-H, Duke CH, Finch KC, et al. Ebola virus disease and social media: a systematic review. Am J Infect Control. 2016;44(12):1660–1671. doi:10.1016/j.ajic.2016.05.011
17. Eysenbach G. Infodemiology and infoveillance: tracking online health information and cyberbehavior for public health. Am J Prev Med. 2011;40(5SUPPL. 2):S154–S158. doi:10.1016/j.amepre.2011.02.006
18. Infodemiology EG. infoveillance: framework for an emerging set of public health informatics methods to analyze search, communication and publication behavior on the Internet. J Med Internet Res. 2009;11(1):e11. doi:10.2196/jmir.1157
19. Xu XJ, Hu XY. The review on public health media surveillance and risk research. Public Heal Prev Med. 2011;22(5):72–77.
20. Tai Z, Sun T. The rumouring of SARS during the 2003 epidemic in China. Sociol Heal Illn. 2011;33(5):677–693. doi:10.1111/j.1467-9566.2011.01329.x
21. Hou Z, Du F, Jiang H, Zhou X, Lin L Assessment of public attention, risk perception, emotional and behavioural responses to the COVID-19 outbreak: social media surveillance in China. Risk Perception, Emot Behav Responses to COVID-19 Outbreak Soc Media Surveill China. 2020.
22. Huynh TL. The COVID-19 risk perception: A survey on socioeconomics and media attention. Econ Bull. 2020;40(1):758–764.
23. Jahanbin K, Rahmanian V. Using Twitter and web news mining to predict COVID-19 outbreak. Asian Pac J Trop Med. 2020;13.
24. Gu H, Chen B, Zhu H, et al. Importance of internet surveillance in public health emergency control and prevention: evidence from a digital epidemiologic study during avian influenza a h7n9 outbreaks. J Med Internet Res. 2014;16(1):e20. doi:10.2196/jmir.2911
25. Bawden D, Robinson L. The dark side of information: overload, anxiety and other paradoxes and pathologies. J Inf Sci. 2009;35(2):180–191. doi:10.1177/0165551508095781
26. Samaan G, Patel M, Olowokure B, et al. Rumor surveillance and avian influenza H5N1. Emerg Infect Dis. 2005;11(3):463–466. doi:10.3201/eid1103.040657
27. Shigemura J, Harada N, Tanichi M, et al. Rumor-Related and Exclusive Behavior Coverage in Internet News Reports Following the 2009 H1N1 Influenza Outbreak in Japan. Disaster Med Public Health Prep. 2015;9(4):459–463. doi:10.1017/dmp.2015.57
28. Grein TW, Kamara KBO, Rodier G, et al. Rumors of disease in the global village: outbreak verification. Emerg Infect Dis. 2000;6(2):97–102. doi:10.3201/eid0602.000201
29. CNNIC. Chinese search engine market research report. China Internet Network Information Center. Beijing [in Chinese]. http://www.cnnic.cn/hlwfzyj/hlwxzbg/ssbg/201910/P020191025506904765613.pdf. Accessed March 11, 2020.
30. StatCounter. Search Engine Market Share Worldwide Report. StatCounter. https://gs.statcounter.com/search-engine-market-share. Accessed March 11, 2020.
31. Hui DSI, Azhar E, Madani TA, et al. The continuing 2019-nCoV epidemic threat of novel coronaviruses to global health — the latest 2019 novel coronavirus outbreak in Wuhan, China. Int J Infect Dis. 2020;91:264–266. doi:10.1016/j.ijid.2020.01.009
32. Wang C, Horby PW, Hayden FG, Gao GF. A novel coronavirus outbreak of global health concern. Lancet. 2020;395(10223):470–473. doi:10.1016/S0140-6736(20)30185-9
33. Baidu. Baidu Index. http://index.baidu.com/.
34. Google. Google Trends. https://trends.google.com/trends.
35. CNPRR. Chinese National Platform to Refute Rumors. http://www.piyao.org.cn/. Accessed March 11, 2020.
36. TPRR Tencent Platform to Refute Rumors. https://vp.fact.qq.com/home/.
37. Liu K, Li L, Jiang T, et al. Chinese public attention to the outbreak of ebola in west africa: evidence from the online big data platform. Int J Environ Res Public Health. 2016;13(8):8. doi:10.3390/ijerph13080780
38. Alicino C, Bragazzi NL, Faccio V, et al. Assessing Ebola-related web search behaviour: insights and implications from an analytical study of Google Trends-based query volumes. Infect Dis Poverty. 2015;4(1):54. doi:10.1186/s40249-015-0090-9
39. WMHC. Report of an unknown Viral Pneumonia. Wuhan Municipal Health Commission. http://wjw.wuhan.gov.cn/front/web/showDetail/2020011109035. Accessed March 11, 2020.
40. WHO. The decision on the determination of a Public Health Emergency of International Concern (PHEIC). https://www.who.int/news-room/detail/30-01-2020-statement-on-the-second-meeting-of-the-international-health-regulations-(2005)-emergency-committee-regarding-the-outbreak-of-novel-coronavirus-(2019-ncov).
41. Ozturk P, Li H, Sakamoto Y. Combating rumor spread on social media: the effectiveness of refutation and warning. In:
42. Li Z, Liu T, Zhu G, et al. Dengue Baidu Search Index data can improve the prediction of local dengue epidemic: A case study in Guangzhou, China. PLoS Negl Trop Dis. 2017;11(3):e0005354. doi:10.1371/journal.pntd.0005354
43. Gu Y, Chen F, Liu T, et al. Early detection of an epidemic erythromelalgia outbreak using Baidu search data. Sci Rep. 2015;5(1):12649. doi:10.1038/srep12649
44. Gluskin RT, Johansson MA, Santillana M, Brownstein JS. Evaluation of Internet-Based Dengue Query Data: google Dengue Trends. PLoS Negl Trop Dis. 2014;8:2. doi:10.1371/journal.pntd.0002713
45. Choi H, Varian H. Predicting the Present with Google Trends. Econ Rec. 2012;88:
46. Sulyok M, Richter H, Sulyok Z, Kapitány-Fövény M, Walker MD. Predicting tick-borne encephalitis using Google Trends. Ticks Tick Borne Dis. 2020;11(1):101306. doi:10.1016/j.ttbdis.2019.101306
47. Zhang Y, Bambrick H, Mengersen K, Tong S, Using Google HW. Trends and ambient temperature to predict seasonal influenza outbreaks. Environ Int. 2018;117:284–291. doi:10.1016/j.envint.2018.05.016
48. He G, Chen Y, Chen B, et al. Using the Baidu Search Index to Predict the Incidence of HIV/AIDS in China. Sci Rep. 2018;8(1):1–10. doi:10.1038/s41598-018-27413-1
49. Lau JTF, Lau M, Kim JH, Tsui HY. Impacts of media coverage on the community stress level in Hong Kong after the tsunami on 26 December 2004. J Epidemiol Community Health. 2006;60(8):675–682. doi:10.1136/jech.2005.041897
50. Bults M, Beaujean DJMA, De Zwart O, et al. Perceived risk, anxiety, and behavioural responses of the general public during the early phase of the Influenza A (H1N1) pandemic in the Netherlands: results of three consecutive online surveys. BMC Public Health. 2011;11(1):2. doi:10.1186/1471-2458-11-2
51. Rubin GJ, Amlôt R, Page L, Wessely S. Public perceptions, anxiety, and behaviour change in relation to the swine flu outbreak: cross sectional telephone survey. BMJ. 2009;339(7713):156. doi:10.1136/bmj.b2651
52. Lau JTF, Griffiths S, Choi KC, Tsui HY. Widespread public misconception in the early phase of the H1N1 influenza epidemic. J Infect. 2009;59(2):122–127. doi:10.1016/j.jinf.2009.06.004
53. Rubin GJ, Potts HWW, Michie S. The impact of communications about swine flu (influenza A HINIv) on public responses to the outbreak: results from 36 national telephone surveys in the UK. Health Technol Assess (Rockv). 2010;14(34):183–266. doi:10.3310/hta14340-03
 © 2020 The Author(s). This work is published and licensed by Dove Medical Press Limited. The
full terms of this license are available at https://www.dovepress.com/terms
and incorporate the Creative Commons Attribution
- Non Commercial (unported, 3.0) License.
By accessing the work you hereby accept the Terms. Non-commercial uses of the work are permitted
without any further permission from Dove Medical Press Limited, provided the work is properly
attributed. For permission for commercial use of this work, please see paragraphs 4.2 and 5 of our Terms.
© 2020 The Author(s). This work is published and licensed by Dove Medical Press Limited. The
full terms of this license are available at https://www.dovepress.com/terms
and incorporate the Creative Commons Attribution
- Non Commercial (unported, 3.0) License.
By accessing the work you hereby accept the Terms. Non-commercial uses of the work are permitted
without any further permission from Dove Medical Press Limited, provided the work is properly
attributed. For permission for commercial use of this work, please see paragraphs 4.2 and 5 of our Terms.