Back to Journals » International Journal of Nephrology and Renovascular Disease » Volume 7
An epidemiologic model to project the impact of changes in glomerular filtration rate on quality of life and survival among persons with chronic kidney disease
Authors Levy A, Perkins R, Johnston K, Sullivan SD, Sood V, Agnese W, Schnitzler M
Received 22 November 2013
Accepted for publication 25 February 2014
Published 3 July 2014 Volume 2014:7 Pages 271—280
DOI https://doi.org/10.2147/IJNRD.S58074
Checked for plagiarism Yes
Review by Single anonymous peer review
Peer reviewer comments 3
Adrian R Levy,1,2 Robert M Perkins,3 Karissa M Johnston,2 Sean D Sullivan,4 Vipan C Sood,5 Wendy Agnese,5 Mark A Schnitzler6
1Department of Community Health and Epidemiology, Dalhousie University, Halifax, NS, Canada; 2Oxford Outcomes Ltd, Vancouver, BC, Canada; 3Center for Health Research and Division of Nephrology, Geisinger Health System, Danville, PA, USA; 4School of Pharmacy, University of Washington, Seattle, WA, USA; 5Mitsubishi Tanabe Pharma America, Jersey City, NJ, USA; 6Departments of Internal Medicine and Community Health, Saint Louis University, St Louis, MO, USA
Purpose: Predicting the timing and number of end-stage renal disease (ESRD) cases from a population of individuals with pre-ESRD chronic kidney disease (CKD) has not previously been reported. The objective is to predict the timing and number of cases of ESRD occurring over the lifetime of a cohort of hypothetical CKD patients in the US based on a range of baseline estimated glomerular filtration rate (eGFR) values and varying rates of eGFR decline.
Methods: A three-state Markov model – functioning kidney, ESRD, and death – with an annual cycle length is used to project changes in baseline eGFR on long-term health outcomes in a hypothetical cohort of CKD patients. Using published eGFR-specific risk equations and adjusting for predictive characteristics, the probability of ESRD (eGFR <10), time to death, and incremental cost-effectiveness ratios for hypothetical treatments (costing US$10, $5, and $2/day), are projected over the cohort's lifetime under two scenarios: an acute drop in eGFR (mimicking acute kidney injury) and a reduced hazard ratio for ESRD (mimicking an effective intervention).
Results: Among CKD patients aged 50 years, an acute eGFR decrement from 45 mL/minute to 35 mL/minute yields decreases of 1.6 life-years, 1.5 quality-adjusted life-years (QALYs), 0.8 years until ESRD, and an increase of 183 per 1,000 progressing to ESRD. Among CKD patients aged 60 years, lowering the hazard ratio of ESRD to 0.8 yields values of 0.2, 0.2, 0.2, and 46 per 1,000, respectively. Incremental cost-effectiveness ratios are higher (ie, less favorable) for higher baseline eGFR, indicating that interventions occurring later in the course of disease are more likely to be economically attractive.
Conclusion: Both acute kidney injury and slowing the rate of eGFR decline produce substantial shifts in expected numbers and timing of ESRD among CKD patients. This model is a useful tool for planning management of CKD patients.
Keywords: epidemiology, decision model, policy analysis, cost effectiveness, acute kidney injury, disease progression, end-stage renal disease
Introduction
Evaluating the effects of clinical interventions and acute events on long-term patient outcomes such as quality of life and survival is an essential feature of health planning and management. When incorporating transparent and defensible assumptions, epidemiologic models can provide useful information about the expected benefits and harms of management strategies, comparative effectiveness, and the impact of adverse clinical events. Well-developed predictive models can therefore inform health-care planning and resource allocation, the design of randomized trials and observational studies, and the delivery of clinical care.1 In the case of chronic kidney disease (CKD), important information can be gleaned about the expected impact of novel interventions and clinical events like acute kidney injury (AKI), and the optimal timing of clinical interventions.
The objective of this study is to predict the timing and number of cases of end-stage renal disease (ESRD), survival and quality-adjusted life-years (QALYs) occurring over the projected lifetime of a cohort of hypothetical United States CKD patients based on a range of baseline estimated glomerular filtration rate (eGFR) values and of rates of eGFR decline. We use the model to project the impact on clinical outcomes of two hypothetical and realistic scenarios: an acute drop in eGFR (mimicking AKI) and reduced hazard ratio (HR) for ESRD (mimicking an effective intervention). We plot the incremental cost-effectiveness ratio (ICER) of varying starting eGFR values and of slowing the decline in eGFR (by lowering the HR for ESRD), assuming a hypothetical treatment cost of US$10/day.
Methods
Extrapolation of changes in eGFR on long-term clinical outcomes is done using a Markov model to reflect lifetime follow-up of hypothetical persons diagnosed with CKD (Figure 1). Markov models represent a compromise between model transparency and flexibility.2 Starting with the distribution of functioning kidney health states, persons experience declining eGFR over time, progressing in 1-year cycles. At the end of each cycle, persons: 1) remain in the same health state; 2) move to a worse CKD stage; 3) experience ESRD and begin dialysis or receive a graft; or 4) move to the death state. Patients are categorized into one of four categories of moderate to severe kidney function defined by the Kidney Diseases Improving Global Outcomes (KDIGO) work group:3 eGFR greater than or equal to 45 and less than 60 mL/minute/1.73 m2 (stage G3A); greater than or equal to 30 and less than 45 mL/minute/1.73 m2 (stage G3B); greater than or equal to 15 and less than 30 mL/minute/1.73 m2 (stage G4); and less than 15 mL/minute/1.73 m2 (stage G5).
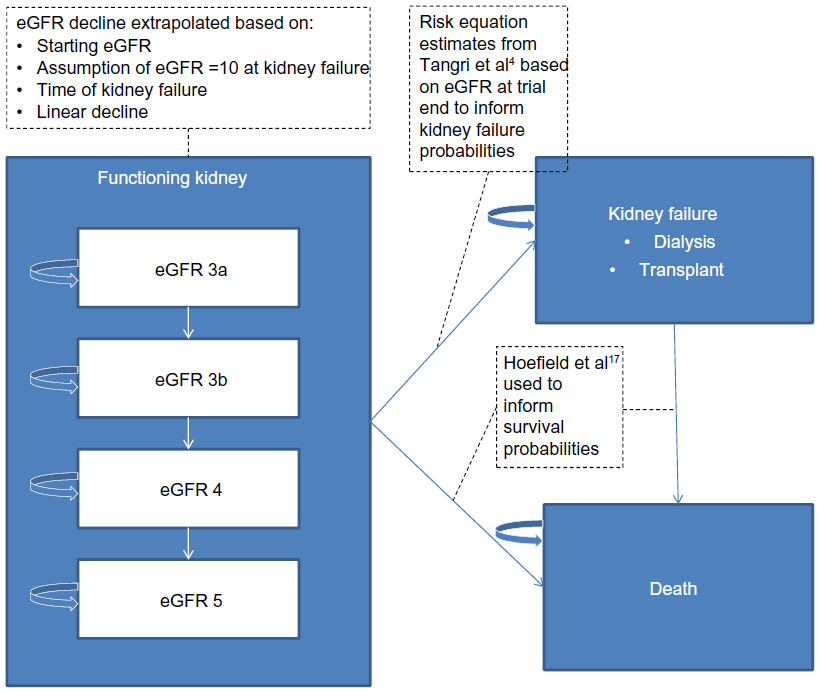 | Figure 1 Schematic of decision tree and Markov model for extrapolating long-term outcomes. |
While in the functioning kidney health states, eGFR is assumed to decline linearly until ESRD (eGFR <10). Once in ESRD, persons remain in the state until death. When considering a continuous mean eGFR level, rather than a categorical distribution, the categorical values required by the model were populated by assuming a normal distribution, with a standard deviation of 13.0.4 The Markov model is run separately for each functioning kidney health state and the outcome measures are weighted by the observational eGFR distribution from the trial period and summed to obtain results. This allows flexibility as the model can incorporate results from other studies and meta-analyses. The number of life-years spent in each renal function health state is calculated once a subject enters the ESRD state by allocating life-years assuming that eGFR declines linearly over time starting at the entry health state and stopping at eGFR of 10. The time spent in each functioning kidney health state is weighted by a utility to obtain QALYs.
The model structure accounts for fast and slow progressors, for those who reach ESRD. Subjects who die before reaching ESRD are also categorized in this way, with an assumption that 30% are fast and 70% are slow progressors, having eGFR declines of 8 and 3 mL/minute/1.73 m2, respectively.5–7
The model is programmed in Microsoft® EXCEL® 2013 (Microsoft Corporation, Redmond, WA, USA) using visual basic macros and is fully parameterized allowing different values of input parameters, one-way and probabilistic sensitivity analyses.8 Model verification included testing for internal consistency using extensive debugging and testing extreme conditions.9
Data sources and transition probabilities
QALYs are a tool for combining both duration and quality of life by adjusting the duration in years by a decrement to reflect living in a state of less than perfect health. These decrements are called “utilities” which are a measure of an individual’s preference for a set of health states that characterize the impact on health-related quality of life of a disease or condition.10 Utilities for each functioning kidney state were 0.87 for CKD stage G3 and 0.85 for CKD stages G4 and G5 (utilities were not reported separately for stages G3A, G3B or G5).11 The utility for the first year of ESRD was 0.69, which was the weighted average of hemodialysis (0.69), continuous ambulatory peritoneal dialysis (0.74) and continuous cycling peritoneal dialysis (0.70),12 weighted by the number of ESRD patients receiving each type of dialysis in the United States Renal Data System (USRDS) annual report.13 For subsequent years of ESRD, the utility value of 0.74 was based on the weighted average of different dialysis types and post-transplant cases in the USRDS database.13 The utility for post-transplant/functioning graft was the mean of CKD stages G3 and G4 (0.86).11 All utilities used were elicited from studies enrolling US patients using a direct, time trade-off, elicitation method.
An aggregated annual health state cost approach was used and costs came from published USRDS data for Medicare recipients diagnosed with CKD.14 Mean annual costs (2011 $USD; number of recipients in parentheses) were: CKD stage G3, $21,957 (788,130); CKD stage G4 and G5 $28,817 (269,940); ESRD (dialysis) year 1 $89,590 (116,395); and ESRD year 2 and on, $77,545. Costs were not reported separately for CKD stages G3A, G3B or G5 in the USRDS report. A one-time cost was applied to the death state.
Annual transition probabilities from functioning kidney to ESRD are derived from published prediction equations, assuming an exponential survival model for extrapolating 5-year risks into long-term annual predictions.4 These risk equations incorporate baseline eGFR, albuminuria, age, sex, serum albumin, calcium, bicarbonate, and phosphorous. The mortality rate is assumed to be 25% per year following ESRD.15,16 Transition probabilities from functioning kidney to death are based on published survival curves by CKD stage.17 These curves represent 5 years follow-up for a population with mean age 65 years. They were compared with US life tables for 65-year-olds to obtain an HR for each of the CKD stages G3A, G3B, G4, and G5, relative to the general population, and these HRs were applied to life tables to extrapolate mortality probabilities outside the 65- to 70-year age range. The target population is thus a contemporary population of persons with CKD in North America.
Analyses
Model outputs include: life-years, QALYs, years to ESRD, number per 1,000 reaching ESRD, and cost per QALY. We analyze two scenarios for decline in eGFR: first, an acute drop mimicking AKI and a hypothetical intervention mimicking an effective intervention that slows the rate of eGFR decline.18 We also estimate outcomes in a hypothetical population with more severe disease, reflecting a population with diabetic nephropathy characterized by more deleterious values of urine albumin creatinine ratio, serum albumin, serum phosphate, serum bicarbonate, and serum calcium. We also plot the ICER of slowing the decline in eGFR (by lowering the HR for suffering ESRD) for varying starting eGFR values, assuming a hypothetical treatment cost of $10/day. The cost per life-year is calculated for combinations of starting eGFR between 15 and 45 and a hypothetical treatment that delays ESRD with a HR ranging from 0.50 to 0.95 relative to standard of care. The ICERs capture improved life expectancy associated with higher eGFR levels and differences in total costs – including the costs associated with treatment as well as any impact of treatment on other direct medical costs, with a higher ICER indicating less value for money (ie, a greater cost differential required to obtain an additional life-year). For this last analysis, costs and outcomes are discounted at 3%.
To determine value, one must declare a “willingness-to-pay” threshold that delineates “good” or “poor” value. As there is no agreed upon method to identify the willingness to pay, the custom has been to benchmark against an expensive and widely accepted technology such as dialysis: if the new technologies cost less per QALY gained than the benchmark, the technology is deemed to offer an acceptable value. Over the past 30 years, the incremental cost-effectiveness of dialysis has been in the range of $50,000 to $80,000 per QALY,19 though a more recent evaluation suggests an acceptable willingness-to-pay threshold as high as $125,000 per QALY.20 ICERs above $200,000/QALY are widely considered to offer poor value for money.
One-way sensitivity analyses were shown using tornado plots to explore the influence of the following individual parameters on the model outputs: HR for ESRD (range: 0.5 to 0.95), daily treatment cost ($2 to $10), other costs (±15%), utilities (±15%), age entering model (50 to 70 years), underlying scale for the mortality function (additive versus multiplicative), and time horizon (10 to 20 years). The base-case scenario for the sensitivity analyses was: females, age 60 years, eGFR =22.5, 30-year time horizon, treatment cost per day $10, costs and QALYs discounted at 3%, and mortality parameters calculated using the multiplicative assumption.
Results
Table 1 shows, in a hypothetical contemporary population in the United States, the input parameters for the distribution of sex and metabolic input parameters according to KDIGO category (age assumed to be 65 years). Based on models of time to ESRD and patient survival from Tangri et al4 and Hoefield et al,17 the annual transition probabilities to ESRD were projected to be 0.2% for stage G3A, 1.4% for stage G3B, 8.0% for stage G4, and 21.4% for stage G5. Three-year mortality probabilities interpolated from the published survival curve for the same groups were 9%, 15%, 25% and 30%, respectively.17 Table 2 shows the expected number of life-years, QALYs, time to ESRD and proportion ending in ESRD according to baseline age and eGFR. For example, the uppermost left-hand box in the body of the table shows that persons aged 50 years with a baseline eGFR of 45 mL/minute can expect to live 16.3 years, experience 13.8 QALYs, and live 9.8 years until reaching ESRD. Approximately 260 per 1,000 would be expected to progress to ESRD. Those quantities for persons aged 50 years with a baseline eGFR of 35 mL/minute are: 14.7, 12.3, 9.0, and 443 per 1,000, respectively. An event such as AKI resulting in a permanent decrement of eGFR of 10 mL/minute (from 45 to 35 mL/minute) would result in losses of 1.6 life-years and 1.5 QALYs; 0.8 years less time until ESRD, and an increase of 183 per 1,000 progressing to ESRD.
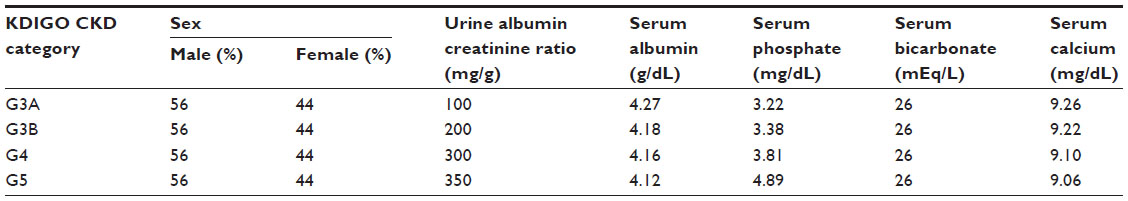 | Table 1 Sex and metabolic input parameters according to Kidney Diseases Improving Global Outcomes (KDIGO)3 category in a hypothetical population with chronic kidney disease (CKD) |
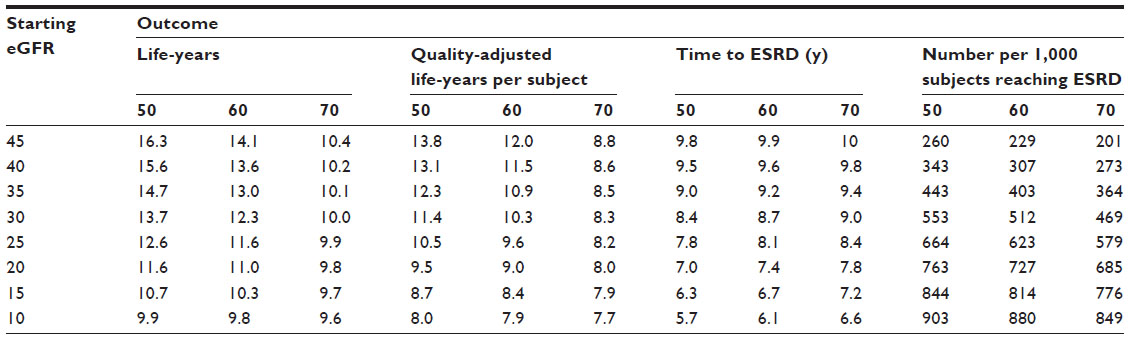 | Table 2 Projected lifetime number of kidney- and survival-related outcomes, according to estimated glomerular filtration rate (eGFR, in mL/minute/1.73 m2) and age, at onset |
Table 3 shows the expected eGFR decline per year, number of life-years, QALYs, time to ESRD and proportion ending in ESRD over the lifetime of persons aged 60 years, by baseline eGFR and HR for ESRD. In this case, starting eGFR is defined by KDIGO categories. For example, persons aged 60 years with a starting eGFR of 37.5 mL/minute can expect to live 13.3 years, have 11.2 QALYs, have 9.4 years until reaching ESRD, and approximately 353 per 1,000 would be expected to progress to ESRD. If the HR of ESRD was lowered to 0.8, those quantities are: 13.4, 11.4, 9.8, and 273 per 1,000, respectively. Thus, an intervention that reduced the HR to 0.8 would be expected to yield increases of 0.1 life-years, 0.2 QALYs, 0.4 more years until ESRD, and a reduction of 80 per 1,000 progressing to ESRD.
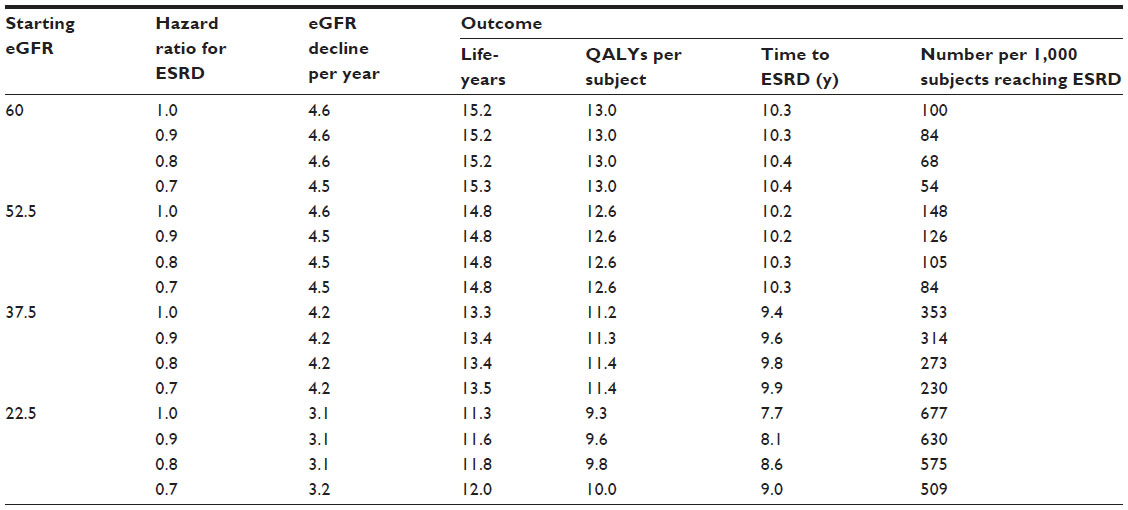 | Table 3 Projected lifetime number of kidney- and survival-related outcomes, according to starting estimated glomerular filtration rate (eGFR; in mL/minute/1.73 m2) at onset, hazard ratio for eGFR decline, assuming age 60 years at onset |
Table 4 shows differences in the expected number of individuals reaching ESRD and undiscounted QALYs over a lifetime, stratified by CKD stage, and reported for two hypothetical populations whose mean age was assumed to be 60 years (56% males): base-case and those with more severe disease such as diabetic nephropathy. The difference in number reaching ESRD per 1,000 population between the base-case and more severe subpopulations was most pronounced at CKD stages G3A and G3B, with increases of 110% and 81%, respectively, compared with increases of 24% and 0.4% for CKD stages G4 and G5, respectively – this is due to the fact that at the more severe CKD stages, a majority of individuals are expected to reach ESRD in the base-case population. Differences in QALYs associated with the more severe population ranged from 0.1 to 1.6 across CKD stages.
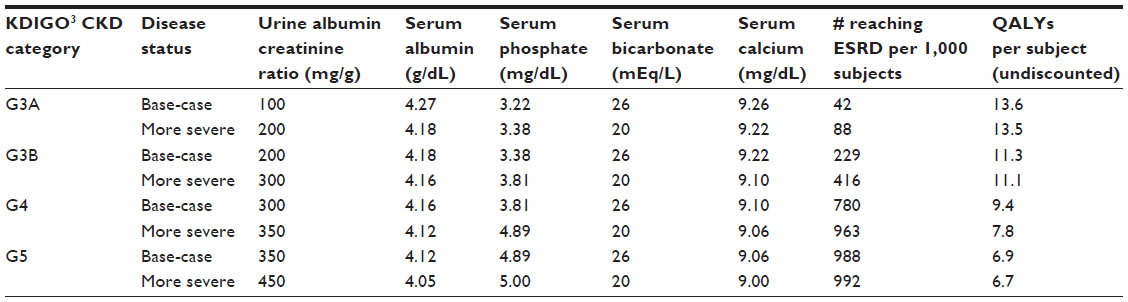 | Table 4 Projected number of individuals reaching ESRD and total accumulated QALYs, stratified by current CKD stage, for the base-case model population and a population with more severe disease (eg, diabetic nephropathy) |
Figure 2 shows, for a hypothetical treatment costing an incremental $10 (Figure 2A), $5 (Figure 2B), and $2 (Figure 2C) per day, relative to standard of care, the relationship between current eGFR (z-axis, values 45, 35 or 15), the HR for ESRD (x-axis, values ranging from 0.50 to 0.95 by 0.05-unit increments), and the dependent ICER measured in costs per QALY (y-axis). The ICERs increase with current eGFR, and are highest for a starting eGFR of 45 mL/minute, indicating that the best value for money of a treatment that delays progression to ESRD is offered at the later stages of disease. At less severe disease stages, the likelihood of an individual reaching ESRD is less than at lower eGFRs, limiting the potential benefits associated with delaying eGFR decline. The lowest simulated HRs of 0.50 were associated with reductions in eGFR decline of 0.72–1.30 mL/minute/1.73 m2 per year. To be economically attractive, a treatment costing $10/day would likely have to demonstrate a large impact on slowing eGFR (eg, reducing the HR for ESRD by half) and be offered to those in stage G4 or even G5. A new treatment costing $2/day could be economically attractive at an HR for ESRD of 0.75 and among those in stage G3B.
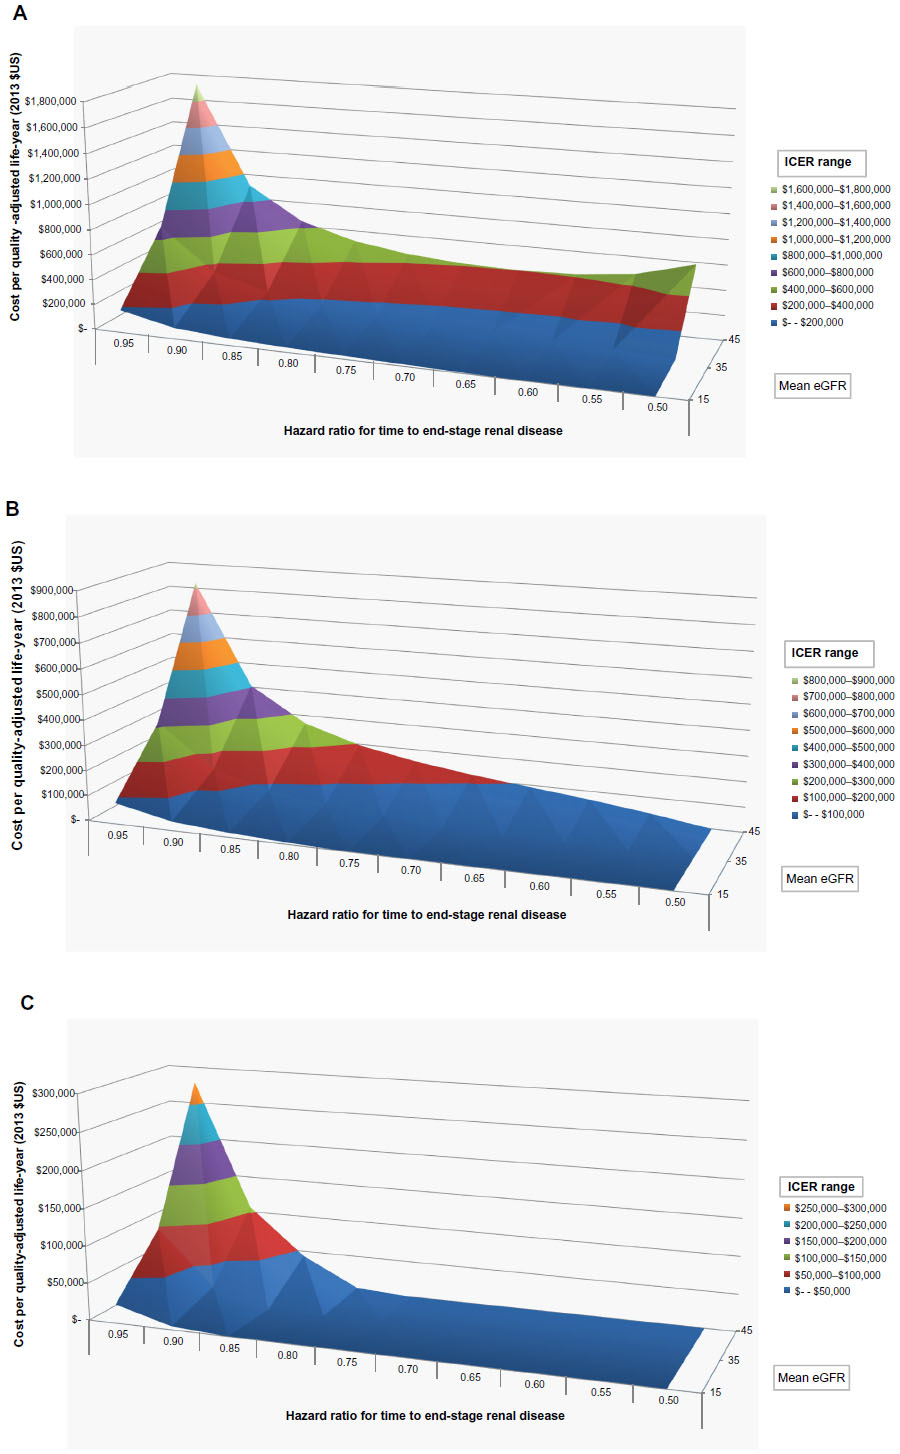 | Figure 2 Incremental cost-effectiveness ratio (ICER). |
Figure 3 shows the projected relationship over a lifetime between an AKI event and undiscounted QALYs. As a result of model structure and assumptions, this relationship is independent of starting eGFR. A relatively small eGFR reduction of 2.5 mL/minute/1.73 m2 is associated with a decline of 0.2 QALYs, or approximately 2.5 months, while a reduction of 25 mL is associated, over a lifetime, with a reduction of 2.3 QALYs.
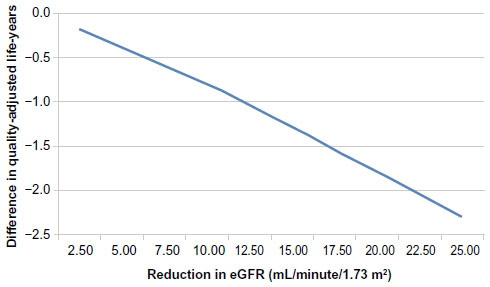 | Figure 3 Projected relationship between a one-time reduction in estimated glomerular filtration rate (eGFR) and lifetime undiscounted quality-adjusted life-years. |
Each panel in Figure 4 shows the results of one-way sensitivity analyses on each model output. Life-years (Figure 4A), QALYs (Figure 4B) and years to ESRD (Figure 4C) are most sensitive to the time horizon and to a lesser extent, age at entry; the number per 1,000 reaching ESRD (Figure 4D) is most sensitive to the HR for eGFR and the time horizon; and the cost per QALY (Figure 4E) is most sensitive to the HR for ESRD and the daily treatment cost.
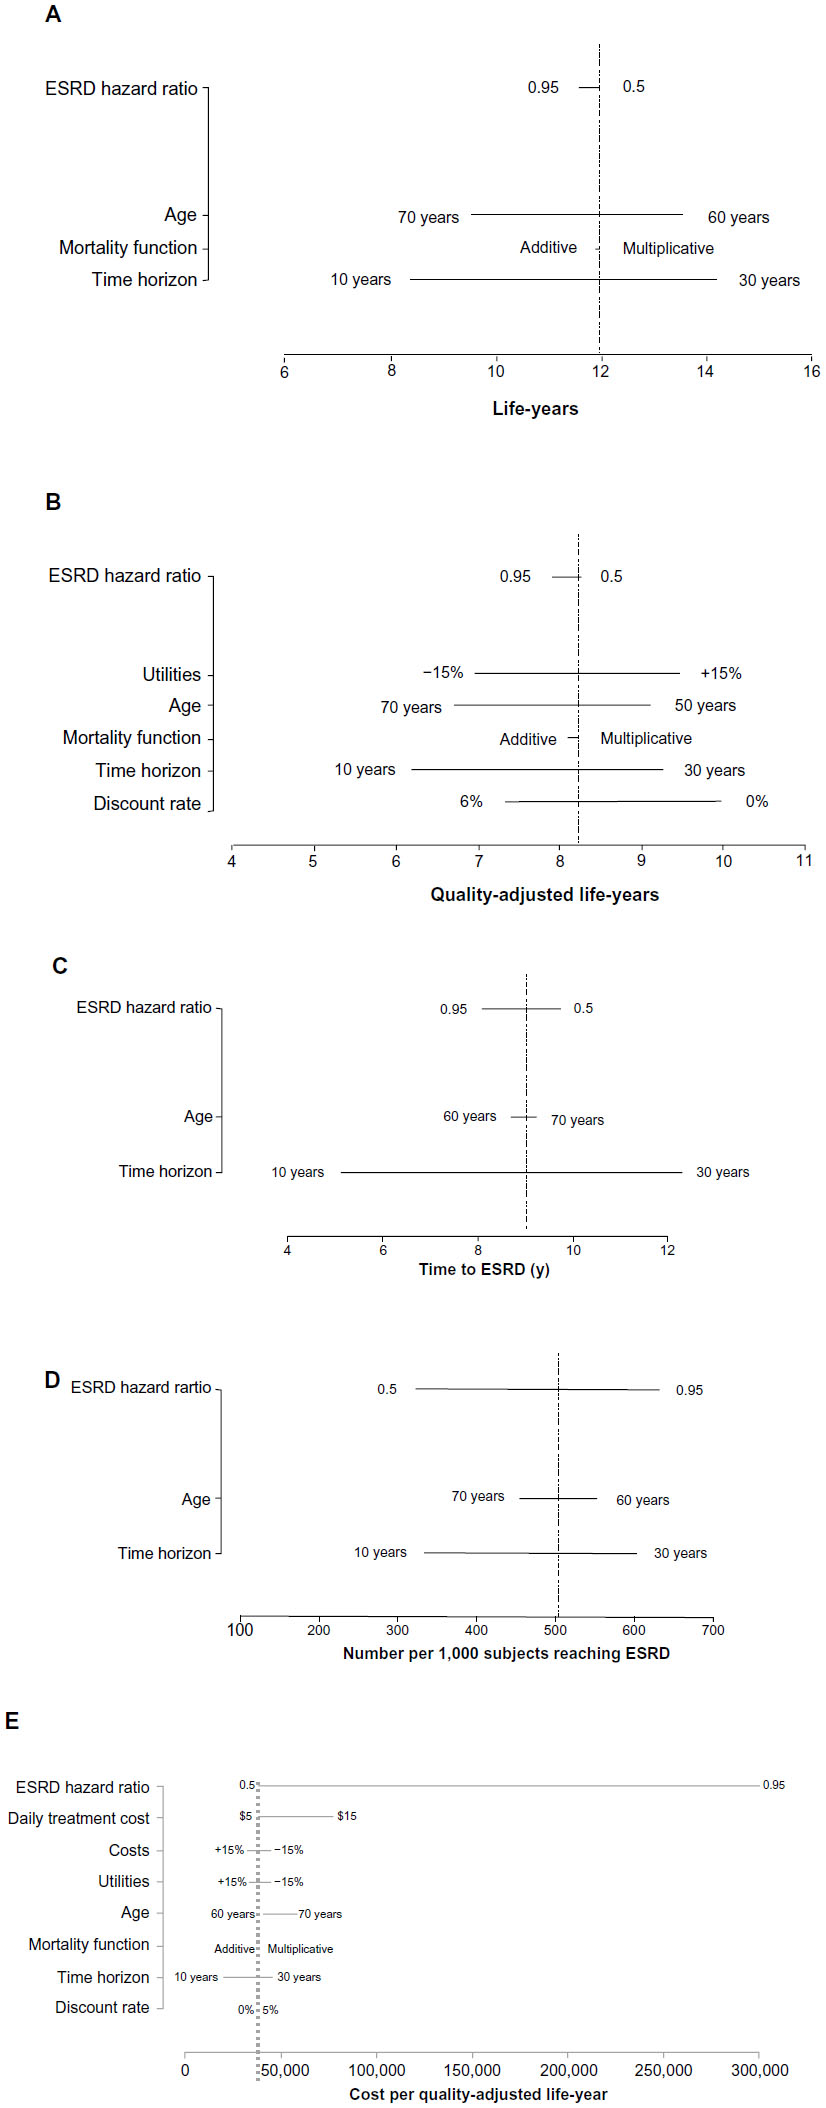 | Figure 4 Tornado plots showing the results of one-way sensitivity analyses demonstrating the impact of specific variables on: (A) life-years; (B) quality-adjusted life-years; (C) time to ESRD (y); (D) number per 1,000 subjects reaching ESRD; and (E) cost per quality-adjusted life-year. |
Discussion
There is little information in the literature to guide clinicians and decision makers about the likely effects of changes in eGFR on long-term clinical outcomes. The current, novel, model fills that gap by combining modern decision analytic modeling methods with available literature describing real-world populations to provide quantitative estimates of likely clinical outcomes and economic value propositions. For example, the model indicates that the difference in number reaching ESRD in a more severe subpopulation is most pronounced at CKD stages G3A and G3B, and that the cost-effectiveness of interventions to slow disease progression are highly sensitive to CKD stage.
The authors of the CKD Policy Model used a similar structure to the one described here21 and that model has been used to estimate the incremental cost-effectiveness of microalbuminuria screening.22 However, the approach adopted here, of using eGFR decline to predict relevant clinical outcomes has not been published. By modeling the impact on timing and likelihood of key outcomes brought about by changes in eGFR among patients with CKD, the results provide useful guides for relevant stakeholders.
The model has important limitations related to the structure and to data inputs. First, the premise is that eGFR is a valid surrogate for ESRD. While current evidence indicates that this is correct, longer follow-up of observational cohorts will provide a more reliable characterization of the relationship.18 Second, eGFR is not allowed to increase in the model, and is assumed to decline linearly. While the mean results are likely to be robust to minor violations of these assumptions, individual patient trajectories cannot be reliably predicted. Third, variables included in the predictive equation are limited to those considered by Tangri et al,4 in which there may be residual confounding and other confounders may not have been accounted for.
While a model such as this is the only way of combining all relevant information into one or a few numeric outputs, caution is warranted because predicting disease progression is fraught with difficulties. For example, competing risks must be modeled,23 patients with CKD are heterogeneous in terms of disease progression and outcome, there are multiple risk factors that can change over time, and therapies and interventions are often used intermittently or at various dosing schedules. Decision analysis addresses these challenges in a flexible manner by incorporating: uncertainty; patient-centric outcomes in terms of survival and quality-adjusted survival; the inputting of demographic data and time-dependent clinical characteristics; and, as needed, economic evaluation.24 Extensive verification of the current model demonstrates that model outputs are consistent with known facts regarding CKD. In future, the model’s validity can be tested with longer-term follow-up of trial populations and observational cohorts. The probabilistic structure is a strength insofar as it allows statistical comparisons of the projections to observed findings.1
In clinical trials, halving of eGFR or doubling of serum creatinine is often used as a surrogate for the progression to ESRD; however, these are commonly late events in a lengthy process in which patients typically remain asymptomatic for a considerable duration. Recognizing this issue, the US National Kidney Foundation and the US Food and Drug Administration held a workshop in December 2012 to “define alternative definitions of eGFR decline after considering the number, spacing and follow-up time of serum creatinine measurements”.25 The recommendation was that a “30% or 40% decline in eGFR” represents a new surrogate end point in regulatory clinical trials in CKD. By projecting the likely effects on clinical outcomes of changes in eGFR, the model presented here can complement that approach.
This model provides estimates of the expected benefit on clinical outcomes, sources of uncertainty, and an acceptable price given funders’ willingness to pay for benefits accrued by preventing acute losses of eGFR or by slowing the rate of eGFR decline. The results can enhance resource allocation by directing resources toward more promising new therapies and management strategies for CKD.26 It is now recognized that value considerations must play a central role in the drug-development process.27 The observation reported in Figure 3 of eGFR bands in which the incremental cost-effectiveness becomes more favorable indicates that the timing of an intervention must be considered carefully in order to optimize benefits and costs. The finding that cost-effectiveness is sensitive to the timing of interventions with respect to CKD stage has important implications for the design of Phase III trials as well as post-marketing trials of comparative effectiveness research.
Acknowledgment
The authors gratefully acknowledge the contributions of Shawn Liu and Katherine Osenenko.
Disclosure
This study was funded by Mitsubishi Tanabe Pharma America. Adrian R Levy is a Senior Scientific Adviser to Oxford Outcomes Ltd/ICON PLC. Robert M Perkins was an unpaid consultant to Oxford Outcomes Ltd on this project and received travel reimbursement for costs incurred in support of this project. Karissa M Johnston is an employee of Oxford Outcomes Ltd/ICON PLC. Sean D Sullivan was a paid scientific consultant to Oxford Outcomes Ltd on this project. Vipan C Sood and Wendy Agnese are employees of Mitsubishi Tanabe Pharma America. Mark A Schnitzler was a paid scientific consultant to Oxford Outcomes Ltd on this project.
References
Weinstein MC, Toy EL, Sandberg EA, et al. Modeling for health care and other policy decisions: uses, roles, and validity. Value Health. 2001;4(5):348–361. | |
Naimark D, Krahn MD, Naglie G, Redelmeier DA, Detsky AS. Primer on medical decision analysis: Part 5 – Working with Markov processes. Med Decis Making. 1997;17(2):152–159. | |
Kidney Disease: Improving Global Outcomes (KDIGO) CKD-MBD Work Group. KDIGO clinical practice guideline for the diagnosis, evaluation, prevention, and treatment of chronic kidney disease-mineral and bone disorder (CKD-MBD). Kidney Int Suppl. 2009;113:S1–130. | |
Tangri N, Stevens LA, Griffith J, et al. A predictive model for progression of chronic kidney disease to kidney failure. JAMA. 2011;305(15):1553–1559. | |
Hovind P, Rossing P, Tarnow L, Smidt UM, Parving HH. Progression of diabetic nephropathy. Kidney Int. 2001;59(2):702–709. | |
Silveiro SP, Friedman R, de Azevedo MJ, Canani LH, Gross JL. Five-year prospective study of glomerular filtration rate and albumin excretion rate in normofiltering and hyperfiltering normoalbuminuric NIDDM patients. Diabetes Care. 1996;19(2):171–174. | |
Hunsicker LG, Adler S, Caggiula A, et al. Predictors of the progression of renal disease in the Modification of Diet in Renal Disease Study. Kidney Int. 1997;51(6):1908–1919. | |
Briggs AH. Handling uncertainty in cost-effectiveness models. Pharmacoeconomics. 2000;17(5):479–500. | |
Eddy DM, Hollingworth W, Caro JJ, Tsevat J, McDonald KM, Wong JB. Model transparency and validation: a report of the ISPOR-SMDM Modeling Good Research Practices Task Force–7. Value Health. 2012;15(6):843–850. | |
Torrance GW, Furlong W, Feeny D. Health utility estimation. Expert Rev Pharmacoecon Outcomes Res. 2002;2(2):99–108. | |
Gorodetskaya I, Zenios S, McCulloch CE, et al. Health-related quality of life and estimates of utility in chronic kidney disease 1. Kidney Int. 2005;68(6):2801–2808. | |
Bass EB, Wills S, Fink NE, et al. How strong are patients’ preferences in choices between dialysis modalities and doses? Am J Kidney Dis. 2004;44(4):695–705. | |
Collins AJ, Foley RN, Herzog C, et al. US Renal Data System 2010 Annual Data Report. Am J Kidney Dis. 2011;57(1 Suppl 1):A8, e1–e526. | |
Collins AJ, Foley RN, Herzog C, et al. US Renal Data System 2011 Annual Data Report. Am J Kidney Dis. 2012;59(1 Suppl 1):A7, e1–e420. | |
Perkins RM, Bucaloiu ID, Kirchner HL, Ashouian N, Hartle JE, Yahya T. GFR decline and mortality risk among patients with chronic kidney disease. Clin J Am Soc Nephrol. 2011;6(8):1879–1886. | |
Schell JO, Da Silva-Gane M, Germain MJ. Recent insights into life expectancy with and without dialysis. Curr Opin Nephrol Hypertens. 2013;22(2):185–192. | |
Hoefield RA, Kalra PA, Baker P, et al. Factors associated with kidney disease progression and mortality in a referred CKD population. Am J Kidney Dis. 2010;56(6):1072–1081. | |
Stevens LA, Greene T, Levey AS. Surrogate end points for clinical trials of kidney disease progression. Clin J Am Soc Nephrol. 2006;1(4):874–884. | |
Winkelmayer WC, Weinstein MC, Mittleman MA, Glynn RJ, Pliskin JS. Health economic evaluations: the special case of end-stage renal disease treatment. Med Decis Making. 2002;22(5):417–430. | |
Lee CP, Chertow GM, Zenios SA. An empiric estimate of the value of life: updating the renal dialysis cost-effectiveness standard. Value Health. 2009;12(1):80–87. | |
Hoerger TJ, Wittenborn JS, Segel JE, et al. A health policy model of CKD: 1. Model construction, assumptions, and validation of health consequences. Am J Kidney Dis. 2010;55(3):452–462. | |
Hoerger TJ, Wittenborn JS, Segel JE, et al. A health policy model of CKD: 2. The cost-effectiveness of microalbuminuria screening. Am J Kidney Dis. 2010;55(3):463–473. | |
Agarwal R, Bunaye Z, Bekele DM, Light RP. Competing risk factor analysis of end-stage renal disease and mortality in chronic kidney disease. Am J Nephrol. 2008;28(4):569–575. | |
Detsky AS, Naglie G, Krahn MD, Naimark D, Redelmeier DA. Primer on medical decision analysis: Part 1 – Getting started. Med Decis Making. 1997;17(2):123–125. | |
National Kidney Foundation and the US Food and Drug Administration. GFR Decline as an Endpoint for Clinical Trials in CKD. Available from: https://www.kidney.org/professionals/research/pdf/EndpointsConfRoster.pdf. Accessed February 22, 2014. | |
Bamberger M, Moore N, Lechat P. How to improve the clinical development paradigm and its division into phases I, II and III. Therapie. 2011;66(4):331–334. | |
Sculpher M, Drummond M, Buxton M. The iterative use of economic evaluation as part of the process of health technology assessment. J Health Serv Res Policy. 1997;2(1):26–30. |
 © 2014 The Author(s). This work is published and licensed by Dove Medical Press Limited. The
full terms of this license are available at https://www.dovepress.com/terms
and incorporate the Creative Commons Attribution
- Non Commercial (unported, 3.0) License.
By accessing the work you hereby accept the Terms. Non-commercial uses of the work are permitted
without any further permission from Dove Medical Press Limited, provided the work is properly
attributed. For permission for commercial use of this work, please see paragraphs 4.2 and 5 of our Terms.
© 2014 The Author(s). This work is published and licensed by Dove Medical Press Limited. The
full terms of this license are available at https://www.dovepress.com/terms
and incorporate the Creative Commons Attribution
- Non Commercial (unported, 3.0) License.
By accessing the work you hereby accept the Terms. Non-commercial uses of the work are permitted
without any further permission from Dove Medical Press Limited, provided the work is properly
attributed. For permission for commercial use of this work, please see paragraphs 4.2 and 5 of our Terms.