Back to Journals » International Journal of Nanomedicine » Volume 15
An Electrochemical Aptasensor Platform Based on Flower-Like Gold Microstructure-Modified Screen-Printed Carbon Electrode for Detection of Serpin A12 as a Type 2 Diabetes Biomarker
Authors Salek Maghsoudi A, Hassani S, Rezaei Akmal M, Ganjali MR, Mirnia K, Norouzi Parviz ![]() , Abdollahi M
, Abdollahi M ![]()
Received 7 January 2020
Accepted for publication 17 March 2020
Published 31 March 2020 Volume 2020:15 Pages 2219—2230
DOI https://doi.org/10.2147/IJN.S244315
Checked for plagiarism Yes
Review by Single anonymous peer review
Peer reviewer comments 2
Editor who approved publication: Dr Thomas Webster
Armin Salek Maghsoudi,1,* Shokoufeh Hassani,1,2,* Milad Rezaei Akmal,3 Mohammad Reza Ganjali,3,4 Kayvan Mirnia,5 Parviz Norouzi,3,4 Mohammad Abdollahi1,2
1Department of Toxicology and Pharmacology, School of Pharmacy, Tehran University of Medical Sciences, Tehran, Iran; 2Toxicology and Diseases Group (TDG), Pharmaceutical Sciences Research Center (PSRC), The Institute of Pharmaceutical Sciences (TIPS), Tehran University of Medical Sciences, Tehran, Iran; 3Center of Excellence in Electrochemistry, Faculty of Chemistry, University of Tehran, Tehran, Iran; 4Biosensor Research Center, Endocrinology and Metabolism Molecular-Cellular Sciences Institute, Tehran University of Medical Sciences, Tehran, Iran; 5Department of Neonatology, School of Medicine, Tehran University of Medical Sciences, Tehran, Iran
*These authors contributed equally to this work
Correspondence: Mohammad Abdollahi
Toxicology and Diseases Group (TDG), Pharmaceutical Sciences Research Center (PSRC), The Institute of Pharmaceutical Sciences (TIPS), Tehran University of Medical Sciences, Tehran 1417614411, Iran
Tel +98 21 64122319
Email [email protected]
Purpose: In the present study, a highly sensitive and simple electrochemical (EC) aptasensor for the detection of serpin A12 as a novel biomarker of diabetes was developed on a platform where flower-like gold microstructures (FLGMs) are electrodeposited onto a disposable screen-printed carbon electrode. Meanwhile, serpin A12-specific thiolated aptamer was covalently immobilized on the FLGMs.
Methods: The electrochemical activity of a fabricated aptasensor under various conditions were examined by cyclic voltammetry (CV) and electrochemical impedance spectroscopy (EIS). Aptamer concentration, deposition time, self-assembly time, and incubation time were optimized for assay of serpin A12. The differential pulse voltammetry (DPV) was implemented for quantitative detection of serpin A12 in K3 [Fe (CN) 6]/K4 [Fe (CN) 6] solution (redox probe).
Results: The label-free aptasensor revealed a linear range of serpin A12 concentration (0.039– 10 ng/mL), detection limit of 0.020 ng/mL (S/N=3), and 0.031 ng/mL in solution buffer and plasma, respectively.
Conclusion: The results indicate that this aptasensor has a high sensitivity, selectivity, stability, and acceptable reproducibility for detection of serpin A12 in diabetic patients.
Keywords: electrochemical aptasensor, screen-printed carbon electrode, flower-like gold microstructures, label-free detection, serpin A12, diabetes biomarkers
Introduction
Serpin A12 (visceral adipose tissue-derived serpin), is produced by visceral and subcutaneous adipose tissues.1 Serpin A12 is expressed on the mRNA or protein level in several tissues such as liver, pancreas, and skin. Serpin A12 acts as an insulin sensitizer with an anti-inflammatory effect. Several studies have shown that plasma or serum serpin A12 concentration rises in conditions of obesity and insulin resistance.2–4 In previous studies, mean plasma serpin A12 concentrations have been reported ranging from 0.1–7 ng/mL5–7 with increases during the early stages of insulin resistance.4 Currently, antibody-based ELISA methods are available for the analysis of serpin A12.8,9 The ELISA technique, although sensitive, has some disadvantages like high cost dependent on the prepared kits and experimental complexities. Biosensors have been identified as appealing alternatives in order to solve these constraints.10 By contrast, electrochemical detection methods offer various advantages for the identification of target proteins, such as direct detection, low cost, easy operation, ability to scale down, and rapid response times.11 Aptamers that have a high specificity and a stronger affinity for the different target molecules (eg, proteins, toxicants, vitamins, medicines, small molecules, and cells), are short special single-stranded oligonucleotides of DNA and RNA that are selected by systematic evolution of ligands through exponential enrichment (SELEX).12 Aptamers have a greater affinity, better target recognition versatility, and higher specificity compared to traditional molecules of immunological and chemical identification. Moreover, aptamers are more stable due to their temperature tolerance and other experimental conditions.13 The aptasensors are a combined platform of nucleic acids and electrochemical or optical transducers that monitor aptamer-analyte molecule interactions.14 Various techniques and materials such as Ag, Hg, Au, and glassy carbon have been used to design and modify the surface of the electrode in electrochemical devices. Point-of-care testing (POCT) is a more interesting technique than traditional diagnostic methods due to several benefits, such as wide availability for diagnosis, quick quantification, ease of access, and minimum necessary sampling quantities.15,16 Screen-printed carbon electrodes (SPCEs) are superior to POCT devices, due to the lower cost of the carbon electrode, excellent reproducibility of outcomes, rapid responses to analytes, surface functionality, and disposability. Recently, these SPCEs have been used as diagnostic devices for disease-related biomarkers, toxins, and environmental contaminants.17–19 During the fabrication process of electrochemical (EC) aptasensors, the aptamer immobilization on the electrode surface not only provides a reliable sensing interface, but even determines the level of sensitivity, and selectivity of the aptasensor.20,21 Several approaches have been suggested for the aptamer immobilization, such as covalent binding,22 direct adsorption, avidin–biotin interactions,23 and sol–gel entrapment.24 Self-assembled monolayers (SAMs) are formed by alkanethiol interaction between Au-modified surface and thiol-containing chemicals, which provides a suitable foundation in order to immobilize biomolecules.25 Thiolated aptamer directly immobilized on the metal nanoparticles-modified electrode surface via self-assembly technique, in particular, gold micro- and nanostructures and nanoparticles (AuNPs) have some intriguing characteristics, such as favorable microenvironment, excellent biocompatibility, and elevated electron transfer capability. They were commonly used as the immobilization matrix in the fabrication of biosensors to increase the efficiency of biosensors, which promotes biosensor stability and full functionality.26–29 Gold microstructures have lately attracted considerable attention due to their unique physical and chemical characteristics distinct from the bulk Au and broad range of uses in the optical, digital, catalytic, electrochemical, and biomedical industries. Several efficient pathways may be used for the preparing of flower-like, cube, sphere, plate, and rod gold micro-/nanostructures.30 The flower-like gold microstructures (FLGMs), with their distinctive high surface-to-volume ratio, could improve electrochemical performance, and their potential application in biological labeling, optics, and catalysts could attract extensive study interests.31 Recently, based on the exploration of serpin A12-targeted DNA aptamers sequences, a few aptamer-based sensors have been constructed to detect serpin A12 in biological samples.32–34
Until today, only one aptasensor is introduced by Kim et al for detection of serpin A12 based on the electrochemical methods.35 The interaction of the cognate pair aptamers with the analyte was maintained on coccolith modified screen-printed gold electrode (SPGE) surface, and EC detection was facilitated by using cyclic voltammetry (CV) and chronoamperometry. In the present study, we present a simple, sensitive novel label-free EC biosensor based on thiolated aptamer (one-capture aptamer) which immobilized on FLGM-modified SPCEs in order to determine the minimum concentration of serpin A12 in plasma samples. Each step of the developed aptasensor was successfully characterized using CV, differential pulse voltammetry (DPV), and electrochemical impedance spectroscopy (EIS). The morphological characteristics of the resulting electrodes were tested by field emission scanning electron microscopy (FE-SEM). The efficiency of the assay in terms of sensitivity, selectivity, and reproducibility has been studied and the response of the aptasensor in plasma samples was precisely screened.
Materials and Methods
Experimental Animals
In the present study, eight-week-old male Wistar rats (200–250 g) were obtained from the animal house of Tehran University of Medical Sciences (TUMS). Rats were housed in propylene cages and were fed with a standard laboratory diet or high-fat diet and tap water. Animals were maintained on a 12 h light/dark cycle, at a room temperature of 22–25°C, humidity (55±5%) and quarantined for seven days prior to use. Plasma samples were collected from high fat diet-induced diabetic rats according to previous study protocol.4 All the ethical issues were cautiously adhered. The experiments were carried out in full accordance with the Declaration of Helsinki and national guidelines for the use and care of laboratory animals. This work was registered and approved by the TUMS Ethics Review Board (code number: IR.TUMS.VCR.REC.1395.1697).
Materials
All chemical reagents those origins are not mentioned were purchased from Sigma-Aldrich Co., (St Louis, MO, USA.). Recombinant serpin A12, RBP4, adiponectin, were provided by AdipoGen Inc. (Incheon, Korea), bovine serum albumin (BSA), gold chloride trihydrate (HAuCl4·3H2O), H2SO4, PBS (pH 7.4), 6-Mercapto-1-Hexanol (MCH), KCl, NaCl, potassium ferricyanide and potassium ferrocyanide, Tris-HCl and MgCl2 were implemented in the study. Solutions were prepared by ultra-pure water 18MΩ cm (EMD Millipore, Billerica, MA, USA). All chemicals were of analytical reagent grade. The serpin A12-thiolated aptamer with the following sequences32 was purchased from MWG-BIOTECH, Germany:
5ʹ-Thiol-C6-ATACCAGCTTATTCAATTGGGCGGTGGGGGGGGTAGTGGGTGTTATGGCGATCGTGGAGATAGTAAGTGCAATCT-3ʹ.
Tris-HCl buffer solution (0.1M NaCl, 20 mM Tris-HCl, 5 mM MgCl2 and 0.2 M KCl, pH 7.4) was used to prepare different concentration of serpin A12 aptamer solution and 10 mM Tris–HCl containing 5.0 mM magnesium chloride, 0.1 M NaCl at pH 7.4 (washing buffer) was used to wash the electrode surface and stored at −20°C.
Apparatus
An AUTOLAB PGSTAT 101 potentiostat/galvanostat from Methrohm Autolab BV, Utrecht,(Netherlands), compatible with NOVA 2.1 software in order to perform the electrochemical measurements. EC techniques for modified-SPCEs surface are characterized by CV, EIS and DPV assays using 5 mM [Fe (CN) 6]3−/4− in 0.1 M KCl solution as a redox probe. EIS was performed by AC voltage amplitude of +10 mV with frequency range of 0.01 Hz to 100 kHz. Acquired data are shown in Nyquist plots. CV was employed to demonstrate the process of fabrication of the aptasensor. The potential was measured in a range of −0.4 to +0.6 V by scan rate of 0.1 V/s. DPV measurements were performed in the experimental conditions (potential range from 0.6 V to −0.4 V, amplitude modulation of 50 mV). The morphology of FLGMs was evaluated in details by FESEM (Hitachi A-4160, Japan) after electrodeposition procedure. SPCEs (3.4 × 1.0 × 0.05 cm, length × width × height) included carbon working and carbon counter electrodes, as well as silver-based reference electrode. The electrical contacts composed of silver, were purchased from DropSens (Spain).
Preparation of FLGMs-Modified SPCE
Gold solution, 0.6 M HAuCl4.3H2O was prepared in 0.5M H2SO4. The electrodeposition process was performed for modification of the working electrode surface via FLGMs to realize the aptasensors fabrication.36,37 CV scanning activated electrode surface process, is performed using H2SO4 solution with a concentration of 0.5 M and potential range of −0.4 to +0.6 V and scan rate of 0.1 V/s in order to achieve a steady voltammograms. The SPCE was characterized by CV in the range between −0.4 and 0.6 V with a redox solution that contains, 5 mM [Fe(CN)6]3-/4- in 0.1 M KCl with scan rate of 0.1 V/s before electrodeposition process. The FLGMs deposition process was performed under electrodeposition potential of −0.2 V in 0.6 M HAuCl4/0.5 M sulfuric acid solution with different deposition times ranging from 30 to 150s, following activation of the electrode surface. The SPCE was analyzed by CV in 5 mM K3Fe (CN)6 (0.1 M KCl) with a scan rate of 0.1 V/s after providing each deposition. In addition, the optimal electrodeposition time was achieved for surface modification, then the output between FLGMs-modified SPCE and bare-activated SPCE was compared. Finally, the presence of FLGMs deposited onto the SPCE was investigated by the use of FE-SEM.
Aptamer Immobilization Onto FLGMs/SPCEs Surface
Aptamer was immobilized onto the modified working electrode using of 20 μM aptamer (10 μL) stock solution installed onto the FLGMs-modified SPCE and SAM was formed spontaneously at 4 °C in a dark place by a 12 hr incubation. Afterwards, the SPCEs was thoroughly washed several times with ultrapure and sterilized water in order to remove the excess aptamer. In the present research, 1 mM MCH solution (5 µL) (volume ratio of absolute ethanol to water (3 to 4:1) was added and incubated at 25 °C for 30 min. MCH was used to block the surface of the FLGMs through self-assembly to reduce nonspecific binding. Subsequently, the modified electrodes were washed by buffer to remove any unattached agent and then dried using nitrogen gas after each incubation process.
Electrochemical Detection of Serpin A12 Protein
Following the aptamer immobilization process, different serpin A12 concentrations were added on the modified electrodes (MCH/aptamer/FLGMs/SPCEs). After incubating aptasensor for 30 min to interact with the different concentration of serpin A12, the prepared electrode was rinsed with ultrapure water and dried under N2 gas flow. Then the aptasensor was placed into an electrochemical chamber (containing solution of 5 mM [Fe (CN) 6]3-/4- in 0.1M KCl), The DPV response of serpin A12/MCH/thiolated aptamer/FLGMs/SPCEs in the presence of several concentration of serpin A12 was evaluated in experimental condition (interval and modulation time were 0.2 s and 0.05 s, respectively) and potential range was between +0.6 to −0.4 V). Scheme 1 depicts a schematic representation of various stages of the proposed serpin A12 aptasensor fabrication.
 |
Scheme 1 Illustration of the electrochemical aptasensor fabrication and the procedure of serpin A12 detection; before (A) and after (B) analyte-incubation. |
Results and Discussion
Characterization of the FLGMs
FESEM images of both SPCEs and FLGM-modified SPCEs are shown in Figure 1. FLGMs have been used to immobilize the thiolated DNA aptamer, providing a higher loading surface for the immobilization of aptamer on the electrode surface and also improved signal transduction by raising the electroactive surface area.38,39 The sharp edges of the microstructures provides a highly reactive surface for chemically bonding to thiolated aptamer.40 Activation process was conducted in 0.5 M H2SO4 solution by CV from −0.1 to 1.3 V with scan rate of 0.1 V/s in order to obtain steady and repetitive voltammograms. Presence of most active sites on the electrode surface and removal of the oxide coating in previous studies demonstrated the significant increase in electrochemical performance.41,42 The SPCE was characterized by CV (−0.4 to +0.6 V) in a solution of 0.1 M KCl containing 5 mM K3 [Fe (CN) 6]/K4 [Fe (CN) 6] with scan rates of 0.1 V/s, after the activation process. The deposition time of the FLGMs could considerably affect the size, deposition quantity and extent of the Au microstructures on the SPCE.31,38 Considering the maximum response acquired, the electrodeposition time of the FLGMs was fixed at 150 s in order to obtain superior EC performance of SPCEs. Following the deposition of the FLGMs on the electrode surface, the CV measurements were performed by using the modified FLGMs and activated-bare SPCEs in solution of 0.1 M KCl containing 5 mM [Fe(CN)6]3−/4− (pH 7.4) (Figure 2).
 |
Figure 1 Field emission scanning electron microscopy images of carbon electrodes; (A) Bare screen-printed carbon electrode, (B) Flower-like gold microstructures modified screen-printed carbon electrode with 0.6M HAuCl4/0.5M H2SO4 (optimal electrodeposition time=150 s). |
 |
Figure 2 Recorded cyclic voltammograms and Nyquist plots of impedance spectra of the screen-printed carbon electrodes in different stages of the aptasensor designing [analysis in solution of 0.1 M PBS, containing 5 mM [Fe(CN)6]3–/4– in 0.1 M KCl (pH 7.4)]: (blue curve) bare screen-printed carbon electrode (SPCE), (red curve) Flower-like gold microstructures (FLGMs)/SPCE, (violet curve) aptamer/FLGMs/SPCE, (green curve) 6-Mercapto-1-Hexanol (MCH)/aptamer/FLGMs/SPCE, and (yellow curve) 0.039 ng/mL serpin A12/MCH/aptamer/FLGMs/SPCE. |
Label-Free Aptasensor (Serpin A12/MCH/Thiolated Aptamer/FLGMs/SPCEs) Characterization
All the steps of the fabrication of the aptasensor (serpin A12/thiolated aptamer/FLGMs/SPCEs) were controlled by EIS and CV measurements. All experiments were carried out in solution of 0.1 M PBS, containing 5 mM [Fe(CN)6]3–/4– in 0.1M KCl (pH 7.4). K3[Fe(CN)6]/K4[Fe(CN)6] as a redox probe was applied for EC transduction.28,43 CVs scanned potential range from −0.4 to 0.6 V and scan rates of 0.1 V/s were obtained. Figure 2 depicts the redox probe CVs scans of the bare SPCE (blue curve), FLGMs/SPCE (red curve), aptamer/FLGMs/SPCE (violet curve), MCH/aptamer/FLGMs/SPCE (green curve) and 0.039 ng/mL serpin A12/aptamer/FLGMs/SPCE (yellow curve). CV and EIS techniques were used for monitoring the elaboration protocol of the aptasensor. Functional characteristics of the redox probe were explored for different stages with variations in the values of current response and peak-to-peak separations (ΔEp=Epa–Epc). The CV results of redox probe at the SPCE demonstrated a pair of reversible reduction/oxidation peaks (ΔEp= 0.153 V) (Figure 2, blue curve). After modification with FLGMs, the peak current significantly increased and ΔEp decreased to 0.148 V (Figure 2, red curve), as suggested in previous studies, FLGMs plays a key role in enhancing the electroactive surface area and providing the conductive bridges for the electron transfer of the redox probe.31,38 Self-assembly of thiol-terminated aptamer onto the FLGM-modified SPCE induced a significant decrease in peak currents of redox probe [Fe(CN)6]3–/4– and a slight increase in ΔEp (0.203 V) was found (Figure 2, violet curve). When the surface of the FLGMs/SPCE was coated with thiolated aptamer, the faradaic current response decreased significantly whilst peak potential separation increased. This indicates that serpin A12 specific aptamer significantly decreases efficient electron transfer area and active sites caused by repulsive force generated by aptamer phosphate groups.44 Based on the green curve in Figure 2, with addition MCH on electrode surface, an additional barrier is produced between the redox mediator and electrode surface that led to further decline in redox peak current and elevation of peak to peak potential separation (ΔEp=0.233V).45 At last, the label-free aptasensor was incubated for 30 min with 0.039 ng/mL serpin A12; the faradaic peak current value increased significantly and peak potential separation clearly decreased (ΔEp=0.156V). In Figure 2, the yellow curve shows a rise in peak currents after the protein binding process. Serpin A12 (MW 45.2 KDa, pI=9.31) has a positive charge at pH 7.4 (under neutral conditions). The results demonstrated the binding of aptamer to serpin A12 that creates a surplus positive charge on the surface of electrode, and the value of peak current increased due to electrostatic attraction between the negatively charged [Fe(CN)6]3–/4– and positive charge density of serpin A12, which result in enhancement of the effective redox reaction.
Optimization of the Analytical Parameters for Serpin A12 Detection
We optimized several variables of the aptasensing including incubation time, aptamer self-assembly time, electrodeposition time, and aptamer concentration. The aptamer concentration is a critical factor in the design of aptasensor to achieve a better response to the target analyte. As a result, different concentrations of the thiolated aptamer were evaluated to achieve the optimum response against serpin A12. Optimization of concentration of serpin A12 specific aptamer was carried out on the FLGMs/SPCE surface with 10.0 μL aptamer, installed in various concentrations (5–30 μM). After an increment in concentration of aptamer, the highest peak current value was achieved at 20 μM of aptamer concentration. It is supposable that the surface of modified electrode was saturated at a concentration of 20 μM aptamer, therefore, 20 μM as an optimum concentration of aptamer could be regarded (Figure S1A). Several time intervals within the range of 4–25 h was evaluated in order to complete the optimal time response for self-assembly. The maximum peak current value in DPV occurred when self-assembly time increased to 12 h (Figure S1B). After 12 h, excessive aggregation of aptamer on the electrode surface resulted in saturation of reactive sites. That is why we selected 12 h as the optimum reaction time for self-assembly. The influence of serpin A12 incubation time on the signal current response was investigated. The dependence of incubation time (10–50 min) on the DPV peak current response after serpin A12 (0.039 ng/mL) addition was shown in (Figure S1C). The total current value enhanced with increase of the incubation time that resulted in a plateau at 30 min. This suggests that serpin A12 was saturated on the modified SPCE surface (MCH/thiolated aptamer/FLGMs/SPCE). The various deposition time of FLGMs were characterized by CV (Figure S2). Oxidation and reduction currents rise distinctly in parallel with an increase in deposition time. Generally, the current response value increased along with the electrodeposition time increment from 30 s to 150 s (Figure S1D). Therefore, 150 s was chosen as the optimal electrodeposition time of FLGMs-modified electrode surface to achieve the optimal aptasensor state.
EIS Spectra of Surface-Modified Electrodes
EIS has been proven to be one of the most effective tools to analyze the real condition of the aptasensor in each assembly stage as one of the electrochemical technologies. Impedance spectrum (Nyquist plot) is composed of a semicircle section at high frequency regions corresponding to the electron transfer resistance process and a linear part of the lower frequencies representing the diffusion process. Randles equivalent circuit was used to fit the electrochemical impedance data as a model (Figure S3). The diameter of the semicircle represents the charge-transfer resistance (Rct) at the electrode surface and a straight line shows the diffusion resistance.46,47 EIS measurements were recorded at an AC voltage amplitude of +10 mV and frequency in a range from 0.01 Hz to 100 kHz, superimposed on a direct current (DC) potential of +0.13 V. Figure 2 shows the Nyquist plots of impedance spectra in a solution of 0.1 M PBS, containing 5 mM [Fe(CN)6]3–/4– in 0.1 M KCl (pH 7.4) obtained at each electrode surface modification step. Figure 2 (blue curve) represents the electrochemical impedance of the bare SPCE which is semicircle. The diameter of the semicircle with a Rct value of about 1.987 kΩ was observed. Subsequently, the electrodeposition of FLGMs on the working electrodes of bare SPCE resulted in a remarkable decline in the Rct level to 0.18 kΩ and a significant increase in the conductivity that confirmed the measurements of CV (Figure 2, red curve). As already stated, this increase in the current value, could be related to the extension of the electrode’s accessible surface area to the redox probe. After immobilization of thiolated capture aptamer and MCH onto the FLGMs/SPCE, the diameter of semicircles of the impedance spectrum significantly increases due to the blocked electron transfer between the electrode surface and the redox probe (Figure 2, violet curve about 4.418 kΩ and Figure 2, green curve about 4.610 kΩ, respectively). Finally, after interaction with 0.039 ng/mL serpin A12 and the captivity of analyte by the aptamer, remarkable decrease in the Rct value was observed (to 3.955 kΩ) (Figure 2, yellow curve). As mentioned earlier, this is attributed to the fact that the electrostatic effect dominates over the steric hindrance effect. The positive charge of serpin A12 on the aptamer-modified electrode surface electrostatically attracts the negatively charged redox probe and makes the electron transfer easier.48
Detection of Serpin A12 with the Aptasensor
In order to further demonstrate the serpin A12 detection assay, the quantitative detection of serpin A12 was achieved under the optimal experimental conditions by DPV (potential range of 0.6 to −0.4 V interval time= 0.2 s, modulation amplitude= 0.05 V). Various concentration of serpin A12 in PBS 0.1 M (pH 7.4) was incubated on the fabricated aptasensor and eventually was detected in a solution of 5 mM [Fe(CN)6]3−/4− containing 0.1 M KCl (pH 7.4). Figure 3 shows the corresponding DPV peak current that increased with elevated concentration of serpin A12. These results are in accordance with the CV and EIS results. The linear relationship between cathodic peak current and logarithmic concentration of serpin A12 was obtained in the range from 0.039 to 10 ng/mL. Figure 4 illustrates the performance of the aptasensor at different serpin A12 concentration by DPV. As the concentration of serpin A12 increases, capture aptamer specifically recognizes a higher quantity of serpin A12 in a gradual increase in electrochemical signal reactions. In the linear concentration of 0.039–10 ng/mL serpin A12 analyte, the limit of detection (LOD) was observed to be 0.020 ng/mL [defined as blank sample (buffer) +3 SD] using the regression equation ΔI=−4.3401 Log Cserpin A12 (ng/mL)–7.1764 with the coefficient of determination r2= 0.9979 in buffer (Figure 4 inset). The responses of three modified SPCEs prepared at exactly same conditions for detection of serpin A12 at 0.039 ng/mL were examined and the relative standard deviation (RSD) was 3.67%, indicating the acceptable reproducibility of proposed aptasensor. The long-term storage stability of the fabricated aptasensor was also examined. For this purpose, three SPCEs were stored at 4°C for two weeks with free preservatives and intermittently assayed every three days. The value remained at 94.91% of the initial signal after 14 days, suggesting good stability of the fabricated aptasensor. The comparison of the analytical performance of the presented label-free aptasensor with previously reported biosensors are summarized in Table 1. It can be noted that in comparison with the suggested EC aptasensor, most of these methods are time-consuming, expensive, and have higher LODs. In addition, the linear response range of detection of serpin A12 in our designed aptasensor covers the physiopathological concentration range of serpin A12 in plasma.
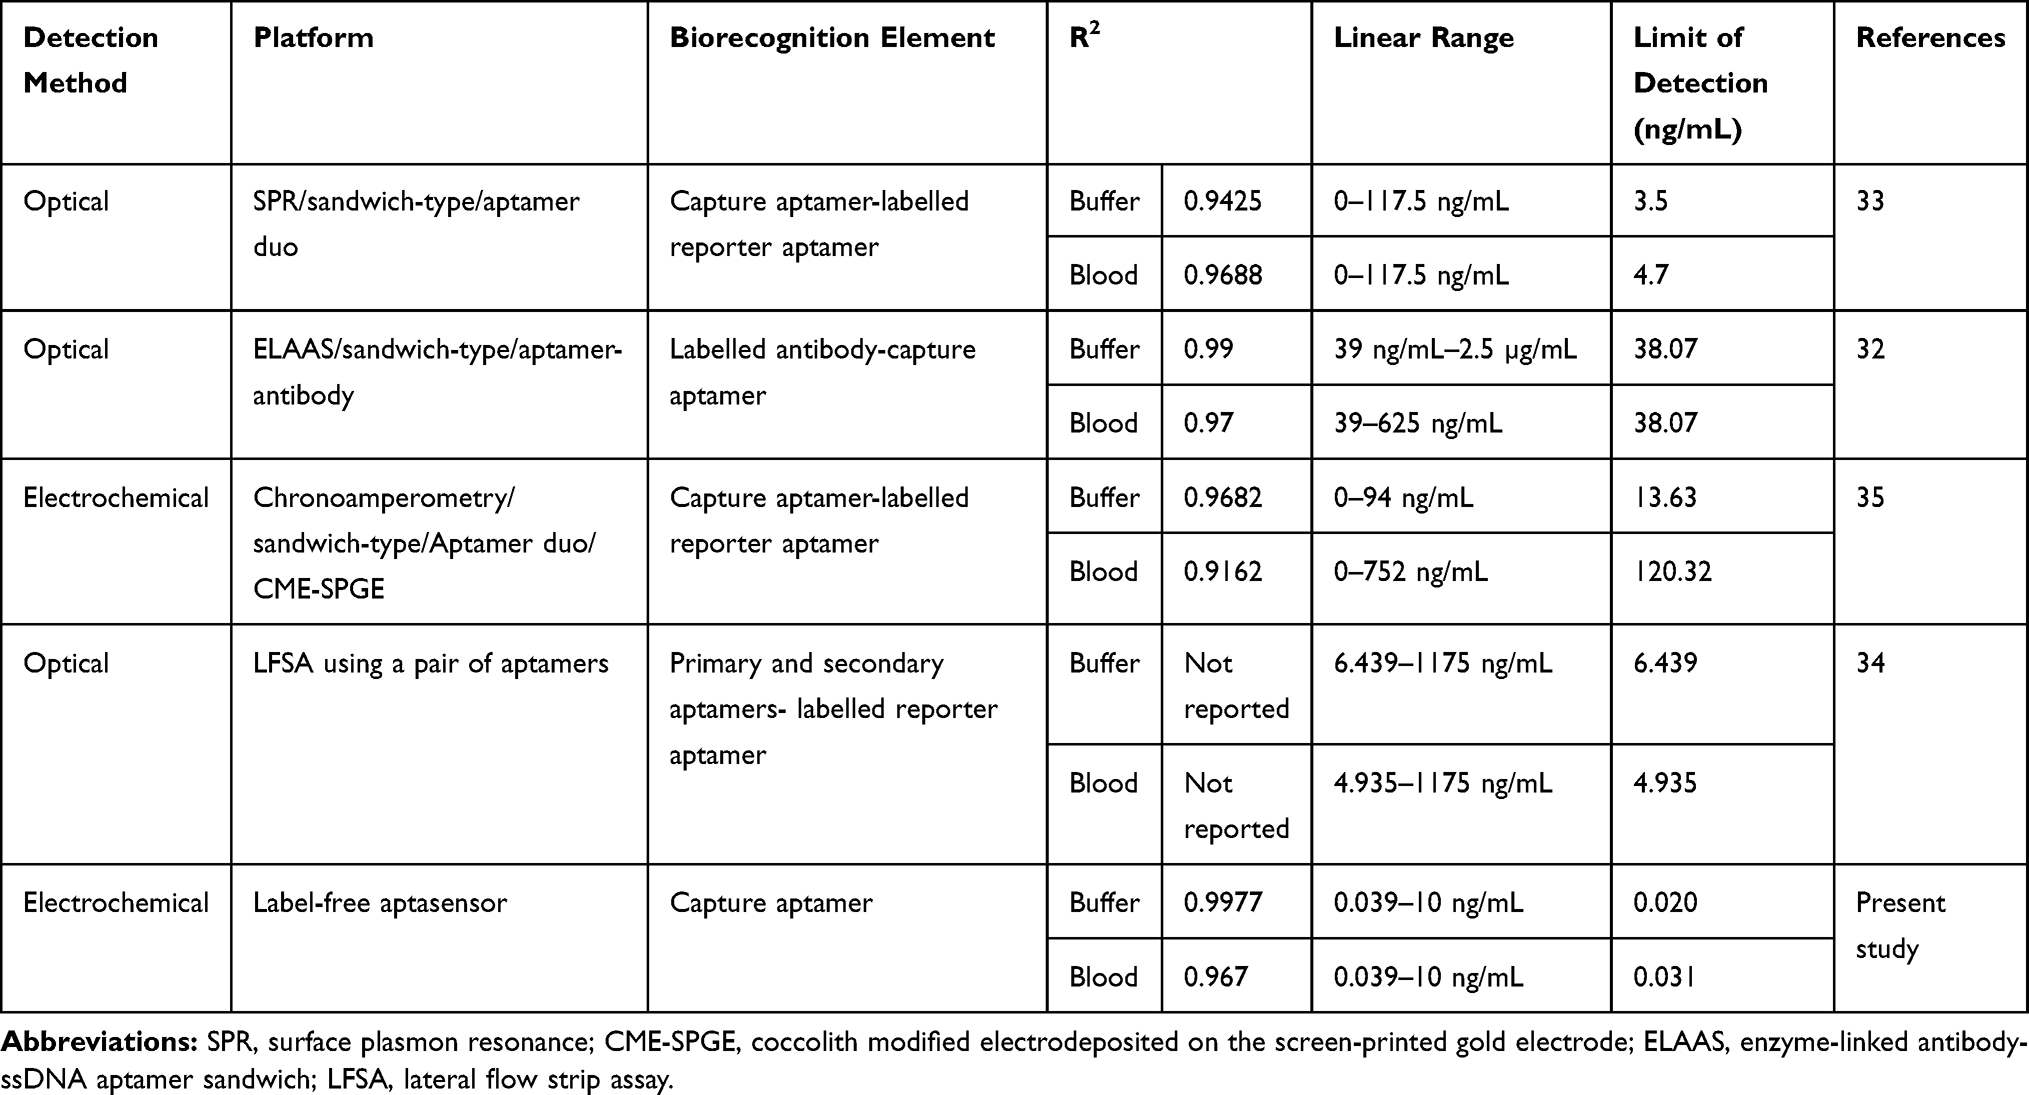 |
Table 1 Analytical Performance of the Presented Aptasensor Compared with Previously Reported Studies for Detection of Serpin A12 |
 |
Figure 3 Differential pulse voltammograms of the serpin A12-aptamer modified 6-Mercapto-1-Hexanol/aptamer/Flower-like gold microstructures/screen-printed carbon electrode after incubation with different concentrations of serpin A12. Analysis in solution of 0.1 M PBS, containing 5 mM [Fe(CN)6]3–/4– in 0.1 M KCl (pH 7.4), (a–f): 0, 0.039, 0.156, 0.625, 2.56, and 10 ng/mL. |
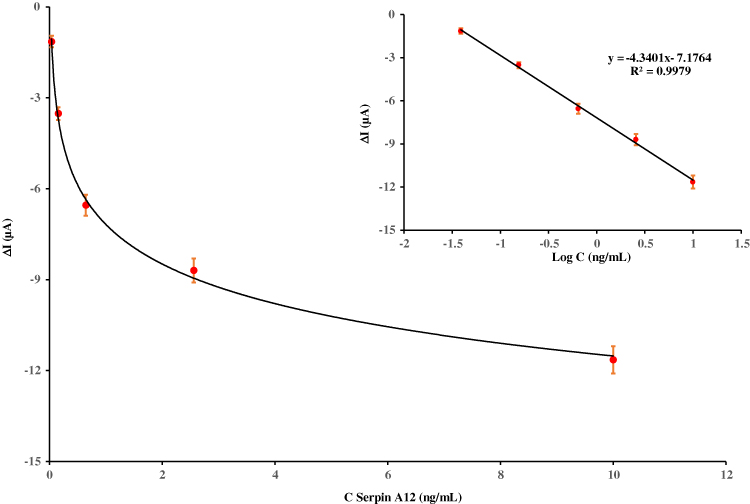 |
Figure 4 The calibration curve of the fabricated aptasensor after incubation with various concentration of serpin A12 in buffer solution: 0 ng/mL, 0.039 ng/mL, 0.156 ng/mL, 0.625 ng/mL, 2.56 ng/mL, and 10 ng/mL, 1000 ng/mL. The inset is the linear relationship between differential pulse voltammetry peak current response and serpin A12 concentration. The standard deviations of three duplicate measurements are indicated by error bars. |
Selectivity
Specificity is a key analytical parameter that affects the efficacy of the aptasensor in clinical analysis. This novel label-free aptasensor after binding to other plasma proteins of diabetic individuals, such as adiponectin (6 mg/mL), RBP4 (21 mg/mL), and BSA (33.33 mg/mL) was incubated for 30 min at 37°C, followed by DPV signals measured. According to the acquired outcomes from test samples, lower response of peak current could be ascribed to the low affinity of the fabricated aptasensor to the nonspecific proteins and good selectivity for serpin A12 (Figure 5).
 |
Figure 5 The selectivity test of the assay for serpin A12 on the fabricated aptasensor after incubation in 0.039 ng/mL, 6 mg/mL, 21 mg/mL, and 33.33 mg/mL of serpin A12, adiponectin, RBP4 and BSA, respectively. Standard deviations of the measurements performed with three independent tests are indicated by error bars. |
Analysis of Real Sample
In order to demonstrate the aptasensor performance for detection of serpin A12 in real samples, the control plasma samples after dilution in the PBS solution (1:10) were spiked with five different concentrations of serpin A12 and analyzed using the proposed aptasensor. Data indicates satisfactory results of the recoveries and relative standard deviation values (90.17% to 101.69% and 2.91% to 5.29%, respectively) for the fabricated aptasensor (Table 2). Under the same conditions described in DPV quantitative analysis section, the calibration curve (Figure S4) for detection of serpin A12 in plasma samples was performed under optimized condition. In the linear dynamic range of 0.039–10 ng/mL serpin A12 analyte which is in the physiological range of interest, the detection limit was found to be 0.031 ng/mL by use of regression equation ΔI=−3.3572 Log Cserpin A12 (ng/mL)–4.8823 with the coefficient of determination (R2= 0.968) presented at Figure S2 inset. It is interesting to note that the LOD for serpin A12 spiked slightly higher in the control plasma samples than in the buffer solution, but still lower than the physiological range. This demonstrates that the designed label-free aptasensor can be used for accurate detection of serpin A12 in real samples.
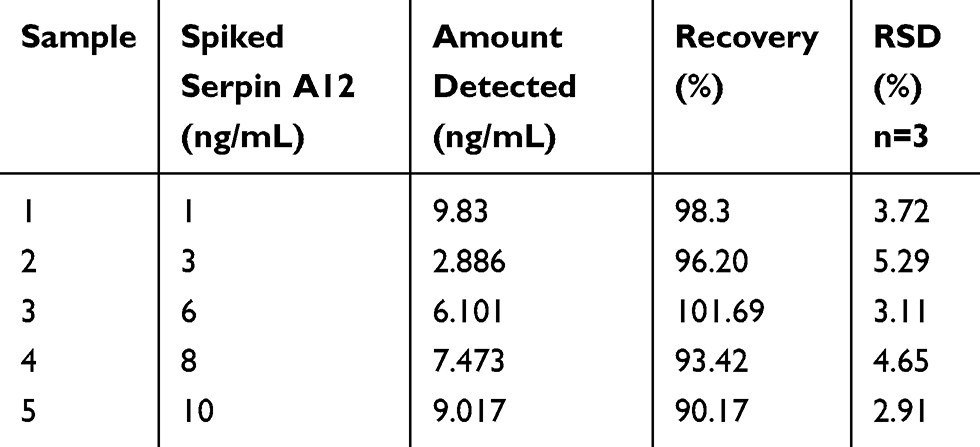 |
Table 2 The Recoveries of Different Concentrations of Serpin A12 in Spiked Plasma Samples Using the Fabricated Aptasensor |
Conclusion
In summary, a simple, sensitive, and label-free EC biosensor was designed on the basis of an aptamer for detection of serpin A12 as a diabetes biomarker. The FLGMs provided an effective and highest surface area for immobilization of the aptamer. Unlike previous studies, an established EC aptasensor was designed for the detection of serpin A12 using label-free one-capture aptamer, nevertheless in comparison with other designed aptasensors, the present fabricated aptasensor is more sensitive for detecting serpin A12. Interestingly, the sensitivity of detection of serpin A12 was 0.020 ng/mL by the developed aptasensor. In addition, we demonstrated that the aptasensor can be successfully applied to the detection of serpin A12 in real samples. The aptasensor offers acceptable reproducibility, good selectivity and stability. Advantages of our designed aptasensor include simple design, high accuracy with rapid response, and possessing potential for clinical usage. Our aptasensor can also sense concentrations in physiologic and pathologic ranges of plasma serpin A12 with the least amount of plasma (10 µL).
Highlights
- Circulating plasma serpin A12 shows significant changes in diabetic individuals
- Aptamer-based EC biosensor to measure serpin A12 was designed
- Electrodeposition of Au nanostructures was used on the SPCE.
Acknowledgments
The authors gratefully acknowledge the support of this work by Tehran University of Medical Sciences (TUMS) (95-04-33-33731) and National Institute for Medical Research Development (NIMAD) (958928). Authors wish to thank INSF.
Author Contributions
All authors made substantial contributions to conception and design, acquisition of data, or analysis and interpretation of data; took part in drafting the article or revising it critically for important intellectual content; gave final approval of the version to be published; and agree to be accountable for all aspects of the work.
Disclosure
The authors report no conflicts of interest in this work.
References
1. Zhou X, Chen Y, Tao Y, Zhang W, Xu W, Lu X. Serum vaspin as a predictor of adverse cardiac events in acute myocardial infarction. J Am Heart Assoc. 2019;8(2):e010934. doi:10.1161/JAHA.118.010934
2. Heiker JT. Vaspin (serpinA12) in obesity, insulin resistance, and inflammation. J Pept Sci. 2014;20(5):299–306. doi:10.1002/psc.v20.5
3. Mierzyński R, Poniedziałek-Czajkowska E, Dłuski D, et al. Nesfatin-1 and vaspin as potential novel biomarkers for the prediction and early diagnosis of gestational diabetes mellitus. Int J Mol Sci. 2019;20(1):159. doi:10.3390/ijms20010159
4. Salek-Maghsoudi A, Hassani S, Momtaz S, et al. Biochemical and molecular evidence on the role of vaspin in early detection of the insulin resistance in a rat model of high-fat diet and use of diazinon. Toxicol. 2019;411:1–14. doi:10.1016/j.tox.2018.10.014
5. Hida K, Poulsen P, Teshigawara S, et al. Impact of circulating vaspin levels on metabolic variables in elderly twins. Diabetologia. 2012;55(2):530–532. doi:10.1007/s00125-011-2385-0
6. Yang L, Chen S, Yuan G, Wang D, Chen J. Changes and clinical significance of serum vaspin levels in patients with type 2 diabetes. Genet Mol Res. 2015;14(3):11356–11361. doi:10.4238/2015.September.25.2
7. Youn B-S, Klöting N, Kratzsch J, et al. Serum vaspin concentrations in human obesity and type 2 diabetes. Diabetes. 2008;57(2):372–377. doi:10.2337/db07-1045
8. El Dayem SMA, Battah AA, El Bohy AEM, El Shehaby A, El Ghaffar EA. Relationship of plasma level of chemerin and vaspin to early atherosclerotic changes and cardiac autonomic neuropathy in adolescent type 1 diabetic patients. J Pediatr Endocrinol Metab. 2015;28(3–4):265–273. doi:10.1515/jpem-2014-0215
9. Sperling M, Grzelak T, Pelczyńska M, et al. Concentrations of omentin and vaspin versus insulin resistance in obese individuals. Biomed Pharmacother. 2016;83:542–547. doi:10.1016/j.biopha.2016.07.012
10. Salek-Maghsoudi A, Vakhshiteh F, Torabi R, et al. Recent advances in biosensor technology in assessment of early diabetes biomarkers. Biosens Bioelectron. 2018;99:122–135. doi:10.1016/j.bios.2017.07.047
11. Hassani S, Akmal MR, Salek-Maghsoudi A, et al. Novel label-free electrochemical aptasensor for determination of diazinon using gold nanoparticles-modified screen-printed gold electrode. Biosens Bioelectron. 2018;120:122–128. doi:10.1016/j.bios.2018.08.041
12. Nimjee SM, White RR, Becker RC, Sullenger BA. Aptamers as therapeutics. Annu Rev Pharmacol Toxicol. 2017;57(1):61–79. doi:10.1146/annurev-pharmtox-010716-104558
13. Chen A, Yang S. Replacing antibodies with aptamers in lateral flow immunoassay. Biosens Bioelectron. 2015;71:230–242. doi:10.1016/j.bios.2015.04.041
14. Hassani S, Momtaz S, Vakhshiteh F, et al. Biosensors and their applications in detection of organophosphorus pesticides in the environment. Arch Toxicol. 2017;91(1):109–130. doi:10.1007/s00204-016-1875-8
15. Vashist SK, Luppa PB, Yeo LY, Ozcan A, Luong JH. Emerging technologies for next-generation point-of-care testing. Trends Biotechnol. 2015;33(11):692–705. doi:10.1016/j.tibtech.2015.09.001
16. Xia Y, Si J, Li Z. Fabrication techniques for microfluidic paper-based analytical devices and their applications for biological testing: a review. Biosens Bioelectron. 2016;77:774–789. doi:10.1016/j.bios.2015.10.032
17. Afonso AS, Uliana CV, Martucci DH, Faria RC. Simple and rapid fabrication of disposable carbon-based electrochemical cells using an electronic craft cutter for sensor and biosensor applications. Talanta. 2016;146:381–387. doi:10.1016/j.talanta.2015.09.002
18. Sánchez-Tirado E, Martínez-García G, González-Cortés A, Yáñez-Sedeño P, Pingarrón J. Electrochemical immunosensor for sensitive determination of transforming growth factor (TGF)-β1 in urine. Biosens Bioelectron. 2017;88:9–14. doi:10.1016/j.bios.2016.05.093
19. Yamanaka K, Vestergaard M, Tamiya E. Printable electrochemical biosensors: a focus on screen-printed electrodes and their application. Sensors. 2016;16(10):1761. doi:10.3390/s16101761
20. Li L, Zhao H, Chen Z, Mu X, Guo L. Aptamer-based electrochemical approach to the detection of thrombin by modification of gold nanoparticles. Anal Bioanal Chem. 2010;398(1):563–570. doi:10.1007/s00216-010-3922-2
21. Zhao F, Xie Q, Xu M, Wang S, Zhou J, Liu F. RNA aptamer based electrochemical biosensor for sensitive and selective detection of cAMP. Biosens Bioelectron. 2015;66:238–243. doi:10.1016/j.bios.2014.11.024
22. Rohrbach F, Karadeniz H, Erdem A, Famulok M, Mayer G. Label-free impedimetric aptasensor for lysozyme detection based on carbon nanotube-modified screen-printed electrodes. Anal Biochem. 2012;421(2):454–459. doi:10.1016/j.ab.2011.11.034
23. Nimse SB, Song K, Sonawane MD, Sayyed DR, Kim T. Immobilization techniques for microarray: challenges and applications. Sensors. 2014;14(12):22208–22229. doi:10.3390/s141222208
24. Carrasquilla C, Lau PS, Li Y, Brennan JD. Stabilizing structure-switching signaling rna aptamers by entrapment in sol–gel derived materials for solid-phase assays. J Am Chem Soc. 2012;134(26):10998–11005. doi:10.1021/ja304064a
25. Sun D, Lu J, Chen D, et al. Label-free electrochemical detection of HepG2 tumor cells with a self-assembled DNA nanostructure-based aptasensor. Sens Actuators B Chem. 2018;268:359–367. doi:10.1016/j.snb.2018.04.142
26. Arya SK, Zhurauski P, Jolly P, Batistuti MR, Mulato M, Estrela P. Capacitive aptasensor based on interdigitated electrode for breast cancer detection in undiluted human serum. Biosens Bioelectron. 2018;102:106–112. doi:10.1016/j.bios.2017.11.013
27. Duan R, Lou X, Xia F. The development of nanostructure assisted isothermal amplification in biosensors. Chem Soc Rev. 2016;45(6):1738–1749. doi:10.1039/C5CS00819K
28. Florea A, Taleat Z, Cristea C, Mazloum-Ardakani M, Săndulescu R. Label free MUC1 aptasensors based on electrodeposition of gold nanoparticles on screen printed electrodes. Electrochem commun. 2013;33:127–130. doi:10.1016/j.elecom.2013.05.008
29. Mehlhorn A, Rahimi P, Joseph Y. Aptamer-based biosensors for antibiotic detection: a review. Biosensors. 2018;8(2):54. doi:10.3390/bios8020054
30. Muthurasu A, Kim HY. Facile electrochemical synthesis of three dimensional flowerlike gold microstructure for electrochemical oxidation of hydrogen peroxide. Electrochim Acta. 2018;283:1425–1431. doi:10.1016/j.electacta.2018.07.092
31. Nootchanat S, Lertvachirapaiboon C, Amornkitbamrung V, Uppachai P, Ekgasit S, Wongravee K. Shape evolution of 3D flower-like gold microstructures from gold nanosheets via oriented attachment. Mater Des. 2017;125:158–166. doi:10.1016/j.matdes.2017.04.012
32. Lee SJ, Park J-W, Kim I-A, Youn B-S, Gu MB. Sensitive detection of adipokines for early diagnosis of type 2 diabetes using enzyme-linked antibody-aptamer sandwich (ELAAS) assays. Sens Actuators B Chem. 2012;168:243–248. doi:10.1016/j.snb.2012.04.016
33. Raston NHA, Gu MB. Highly amplified detection of visceral adipose tissue-derived serpin (vaspin) using a cognate aptamer duo. Biosens Bioelectron. 2015;70:261–267. doi:10.1016/j.bios.2015.03.042
34. Raston NHA, Nguyen V-T, Gu MB. A new lateral flow strip assay (LFSA) using a pair of aptamers for the detection of Vaspin. Biosens Bioelectron. 2017;93:21–25. doi:10.1016/j.bios.2016.11.061
35. Kim SH, Nam O, Jin E, Gu MB. A new coccolith modified electrode-based biosensor using a cognate pair of aptamers with sandwich-type binding. Biosens Bioelectron. 2019;123:160–166. doi:10.1016/j.bios.2018.08.021
36. Chen J, Hu W, Wei J, et al. An electrochemical aptasensing platform for carbohydrate antigen 125 based on the use of flower-like gold nanostructures and target-triggered strand displacement amplification. Microchimica Acta. 2019;186(6):388. doi:10.1007/s00604-019-3497-3
37. Wang X, Yang T, Jiao K. Controllable fabrication of Au micro/nanostructures on self-doped polyaniline nanofibers via electrochemical deposition and its application for DNA immobilization. Chin Sci Bull. 2010;55(36):4125–4131. doi:10.1007/s11434-010-4224-y
38. Stine KJ. Biosensor applications of electrodeposited nanostructures. Appl Sci. 2019;9(4):797. doi:10.3390/app9040797
39. Urmann K, Modrejewski J, Scheper T, Walter J-G. Aptamer-modified nanomaterials: principles and applications. BioNanoMaterials. 2017;18:1–2.
40. Fan Z, Huang X, Tan C, Zhang H. Thin metal nanostructures: synthesis, properties and applications. Chem Sci. 2015;6(1):95–111. doi:10.1039/C4SC02571G
41. González-Sánchez MI, Gómez-Monedero B, Agrisuelas J, Iniesta J, Valero E. Electrochemical performance of activated screen printed carbon electrodes for hydrogen peroxide and phenol derivatives sensing. J Electroanal Chem. 2019;839:75–82. doi:10.1016/j.jelechem.2019.03.026
42. Wan H, Sun Q, Li H, Sun F, Hu N, Wang P. Screen-printed gold electrode with gold nanoparticles modification for simultaneous electrochemical determination of lead and copper. Sens Actuators B Chem. 2015;209:336–342. doi:10.1016/j.snb.2014.11.127
43. Fan L, Zhao G, Shi H, Liu M, Li Z. A highly selective electrochemical impedance spectroscopy-based aptasensor for sensitive detection of acetamiprid. Biosens Bioelectron. 2013;43:12–18. doi:10.1016/j.bios.2012.11.033
44. Zhou L, Li D-J, Gai L, Wang J-P, Li Y-B. Electrochemical aptasensor for the detection of tetracycline with multi-walled carbon nanotubes amplification. Sens Actuators B Chem. 2012;162(1):201–208. doi:10.1016/j.snb.2011.12.067
45. Zeng G, Zhang C, Huang D, et al. Practical and regenerable electrochemical aptasensor based on nanoporous gold and thymine-Hg2+-thymine base pairs for Hg2+ detection. Biosens Bioelectron. 2017;90:542–548. doi:10.1016/j.bios.2016.10.018
46. Haji-Hashemi H, Habibi MM, Safarnejad MR, Norouzi P, Ganjali MR. Label-free electrochemical immunosensor based on electrodeposited Prussian blue and gold nanoparticles for sensitive detection of citrus bacterial canker disease. Sens Actuators B Chem. 2018;275:61–68. doi:10.1016/j.snb.2018.07.148
47. Han Y, Wang J, Zhang H, Zhao S, Ma Q, Wang Z. Electrochemical impedance spectroscopy (EIS): an efficiency method to monitor resin curing processes. Sens Actuators a Phys. 2016;250:78–86. doi:10.1016/j.sna.2016.08.028
48. Shafaat A, Faridbod F, Ganjali MR. Label-free detection of cytochrome C by a conducting polymer-based impedimetric screen-printed aptasensor. New J Chem. 2018;42(8):6034–6039. doi:10.1039/C7NJ03844E
 © 2020 The Author(s). This work is published and licensed by Dove Medical Press Limited. The
full terms of this license are available at https://www.dovepress.com/terms
and incorporate the Creative Commons Attribution
- Non Commercial (unported, 3.0) License.
By accessing the work you hereby accept the Terms. Non-commercial uses of the work are permitted
without any further permission from Dove Medical Press Limited, provided the work is properly
attributed. For permission for commercial use of this work, please see paragraphs 4.2 and 5 of our Terms.
© 2020 The Author(s). This work is published and licensed by Dove Medical Press Limited. The
full terms of this license are available at https://www.dovepress.com/terms
and incorporate the Creative Commons Attribution
- Non Commercial (unported, 3.0) License.
By accessing the work you hereby accept the Terms. Non-commercial uses of the work are permitted
without any further permission from Dove Medical Press Limited, provided the work is properly
attributed. For permission for commercial use of this work, please see paragraphs 4.2 and 5 of our Terms.