Back to Journals » Medical Devices: Evidence and Research » Volume 12
An automated mammogram classification system using modified support vector machine
Authors Kayode AA ![]() , Akande NO, Adegun AA
, Akande NO, Adegun AA ![]() , Adebiyi MO
, Adebiyi MO
Received 27 February 2019
Accepted for publication 18 June 2019
Published 12 August 2019 Volume 2019:12 Pages 275—284
DOI https://doi.org/10.2147/MDER.S206973
Checked for plagiarism Yes
Review by Single anonymous peer review
Peer reviewer comments 2
Editor who approved publication: Dr Scott Fraser
Aderonke Anthonia Kayode,1 Noah Oluwatobi Akande,1 Adekanmi Adeyinka Adegun,1 Marion Olubunmi Adebiyi2
1Computer Science Department, Landmark University, Omu-Aran, Kwara State, Nigeria; 2Department of Computer and Information Sciences, Covenant University, Ota, Ogun State, Nigeria
Purpose: Breast cancer remains a serious public health problem that results in the loss of lives among women. However, early detection of its signs increases treatment options and the likelihood of cure. Although mammography has been established to be a proven technique of examining symptoms of cancer in mammograms, the manual observation by radiologists is demanding and often prone to diagnostic errors. Therefore, computer aided diagnosis (CADx) systems could be a viable alternative that could facilitate and ease cancer diagnosis process; hence this study.
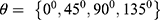
Methodology: The inputs to the proposed model are raw mammograms downloaded from the Mammographic Image Analysis Society database. Prior to the classification, the raw mammograms were preprocessed. Then, gray level co-occurrence matrix was used to extract fifteen textural features from the mammograms at four different angular directions: θ={0°, 45°, 90°, 135°}, and two distances: D={1,2}. Afterwards, a two-stage support vector machine was used to classify the mammograms as normal, benign and malignant.
Results: All of the 37 normal images used as test data were classified as normal (no false positive) and all 41 abnormal images were correctly classified to be abnormal (no false negative), meaning that the sensitivity and specificity of the model in detecting abnormality is 100%. After the detection of abnormality, the system further classified the abnormality on the mammograms to be either “benign” or “malignant”. Out of 23 benign images, 21 were truly classified as benign. Also, out of 18 malignant images, 17 were truly classified to be malignant. From these findings, the sensitivity, specificity, positive predictive value, and negative predictive value of the system are 94.4%, 91.3%, 89.5%, and 95.5%, respectively.
Conclusion: This article has further affirmed the prowess of automated CADx systems as a viable tool that could facilitate breast cancer diagnosis by radiologists.
Keywords: cancer diagnosis, CADx systems, radiologists, diagnostic errors, GLCM
Introduction
Breast cancer is a deadly disease that plagued women population in developing countries.1,2 However, early detection of the symptoms of breast cancer could facilitate its treatment and it has been established that mammography is the best technique for this task.3,4 This technique involves the examination of X-ray images of the breast for symptoms such as architectural distortion, calcifications, masses, etc.
Although mammography has been established to be a viable technique in the diagnosis of breast cancer, its interpretation by Radiologists’ are most times in question as different Radiologists may come up with different interpretations.5,6 Azar7 argued that interpretation of mammogram is a cognitive skill which Radiologists develop over time. Nevertheless, digital image processing and machine learning approaches can proffer a solution to many of the inherent problems encounter by Radiologists when interpreting mammogram manually.
Mammogram processing (enhancement and segmentation) enhances visual interpretation. Also, intelligent classifier aids expert in detection and classification of mammograms.8
Methodology
The detailed steps employed in the classification task are documented in this section. It involves mammogram acquisition, mammogram processing, feature extraction and the classification models, all of which were implemented in MATLAB 2015.
Mammogram acquisition
Raw mammograms were downloaded from MIAS database.9 Out of 322 mammograms available in the database, 126 normal, 60 benign and 48 malignant mammograms were carefully selected. Of these, 37 normal, 23 benign, 18 malignant mammograms were used as test data while the remaining 156 mammograms were used for training the system.
Mammogram processing
Mammography uses low dose x-ray for imaging which produces a low qualitymammograms.10 In addition, Kayode et al11 ascertained that image acquisition comes with lots of inherent problems which include scratches, dust artifact, scanner induced artifacts and excessive background noise which can further undermine the reliability of X-ray images, therefore, it is expedient to pre-process digital images so as to improve their quality.
Furthermore, image enhancement includes removing noise and adjusting image contrast so that the identification of key features becomes easier. In this article, image enhancement was achieved using Contrast Limited Adaptive Histogram Equalization (CLAHE). Also, segmentation was done in order to separate the needed region also known as the region of interest (ROI) from the entire breast tissue. Otsu threshold algorithm was implemented in MATLAB to extract ROI from the entire mammogram image.
Extraction of features from mammogram’s ROI
Radiologists analyze ROI found on mammograms by examining morphological features, such as size, margin and shape of the ROI; this helps them to differentiate between normal and abnormal mammograms and also to differentiate between an abnormal benign mammogram from an abnormal malignant mammogram. However, it should be noted that decisions concerning these morphological features are cognitive and greatly depend on Radiologists’ experience and opinion; therefore, it is essential to use computers to facilitate the extraction of GLCM features related to image texture, coarseness and heterogeneity, which are not necessarily seen by unaided eye.
GLCM is the most common statistical method used to compute textural features from gray level images such as mammograms. GLCM features consider the spatial relationship between the pixel of interest and its neighbouring pixels thereby providing us with textural features. Each element (m, n) in the resultant GLCM is simply the sum of the number of times that the pixel with value m occurred in the specified angular direction and distance to a pixel with value n in the input image.12
In this article, the thirteen GLCM features, proposed and by Haralick et al13 with two other features called cluster prominence and cluster shade, proposed by Tsatsoulis14 were extracted from mammograms. These GLCM features have been reported to adequately convey information about the textural characteristics of an image. The features are listed in Table 1. The detailed discussion about the features is documented in13,14 respectively.
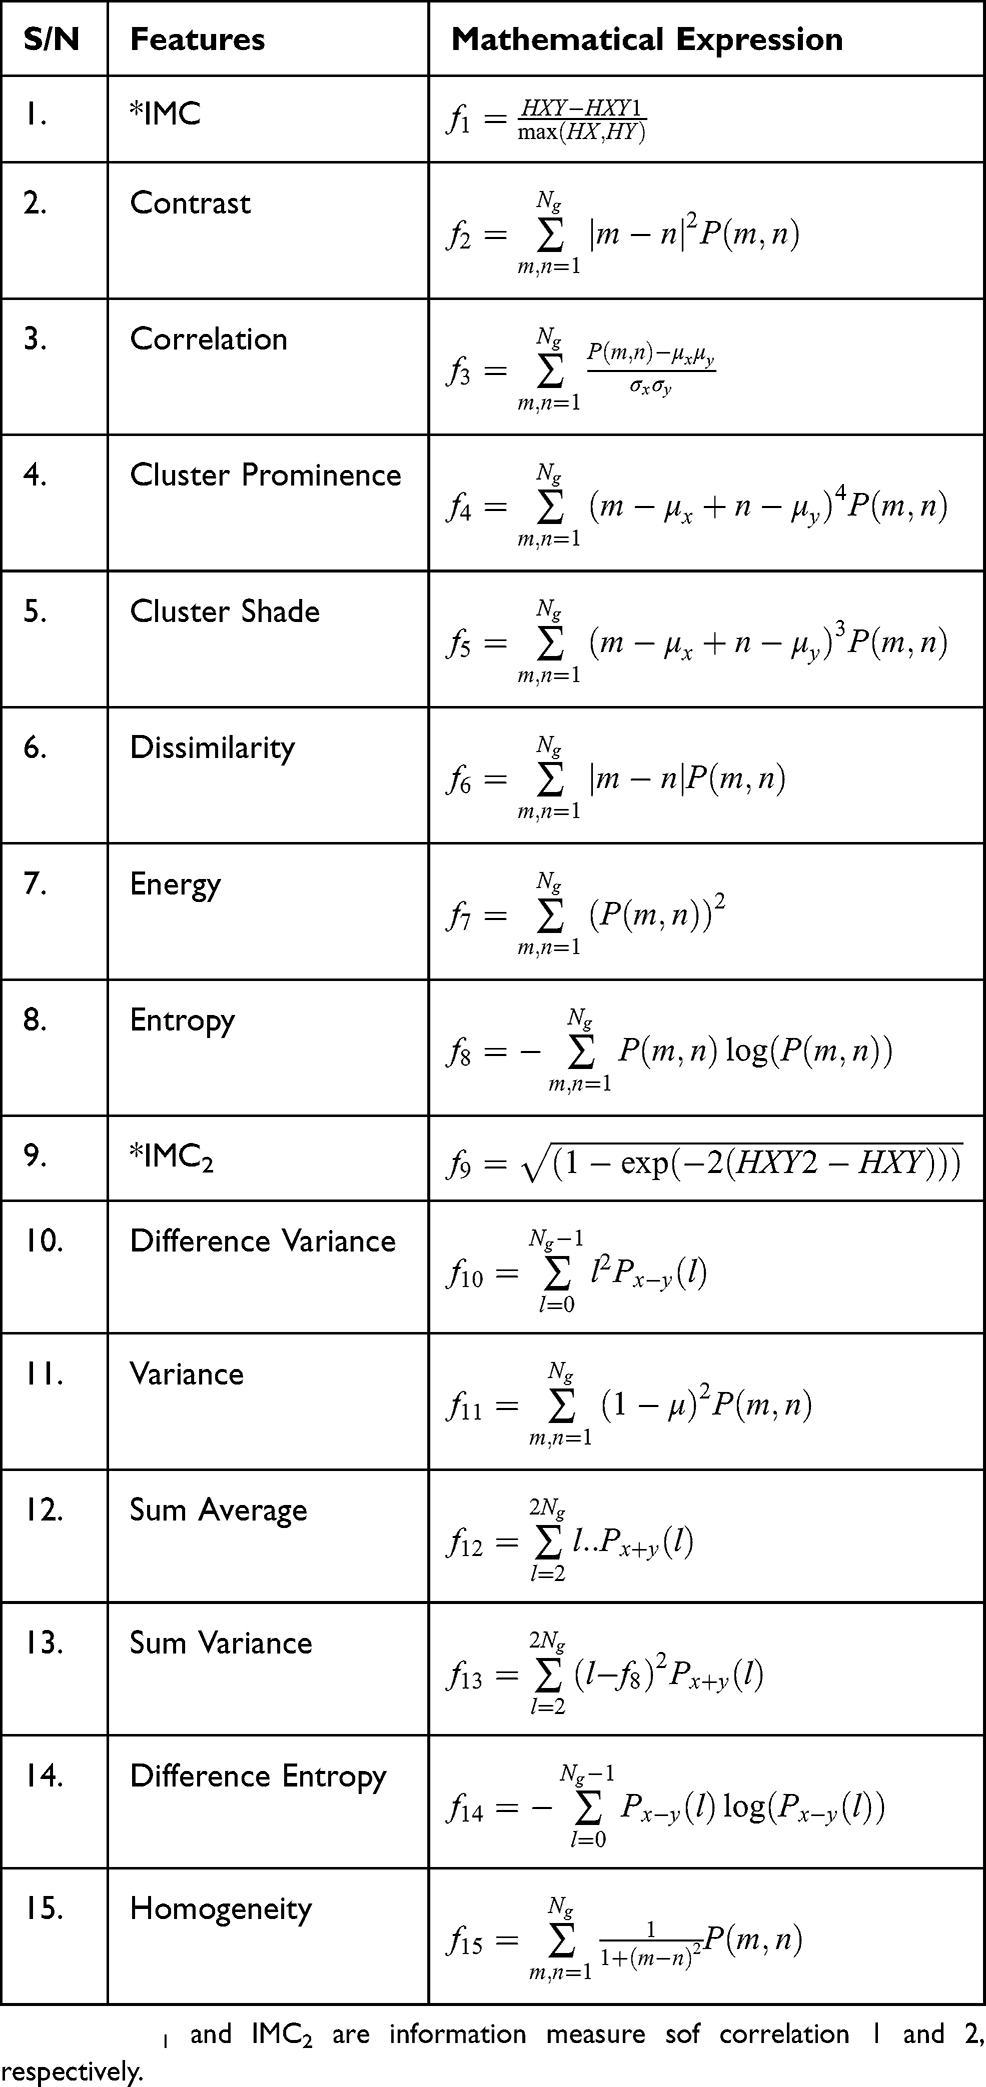 |
Table 1 Textural features extracted from the dataset |
Unlike in the existing works,15–18 where a single GLCM feature was created for each image using horizontal direction,  and distance,
  this study is of the opinion that a single GLCM is inadequate to characterize the textural features of an image, therefore, in addition to the horizontal direction
  and distance
  two diagonals
  and the vertical direction
  at distance
  at distance
  which correspond to multiple GLCMs features at four directions and two distances 1 and 2 were computed. The following pseudocode was used to extract the features:
 do
do //GLCMs at angular directions
 do
do //sum of co-occurrence matrices
 do
do


Classification of mammograms
SVM was used for classification purposes. In MATLAB programming tool, SVM functions support only two classes based on its fundamental principle as a binary classifier. Due to three attributes of interest: normal, benign and malignant, SVM was trained twice, first to classify mammograms to either normal or abnormal, and second, to classify abnormal mammograms to benign or malignant. By this two-stage approach the three attributes of mammograms will be accommodated as illustrated in Figure 1.
 |
Figure 1 Two-level classification approach using support vector machine (SVM). |
Experimental results
Figure 2 illustrates the Graphic User Interface (GUI) designed for the preprocessing stage. Raw mammograms were fed into the system one after the other then CLAHE was employed for the preprocessing. Afterwards, the suspicious region otherwise known as ROI was extracted from the enhanced image; this is illustrated in Figure 3.
 |
Figure 2 Mammogram enhancement using Contrast Limited Adaptive Histogram Equalization (CLAHE). |
 |
Figure 3 Region of interest (ROI) extraction. |
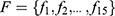
Fifteen GLCM features presented in Table 1 were extracted from the ROI as illustrated with Figures 4 and 5 respectively. The averages of the features at the two distances were calculated as shown in Figure 6 while the overall averages of each of the features which serve as input to SVM classifier, were also calculated as shown in Figure 7.
 |
Figure 4 Gray level co-occurrence matrix (GLCM) features computed at D=1. |
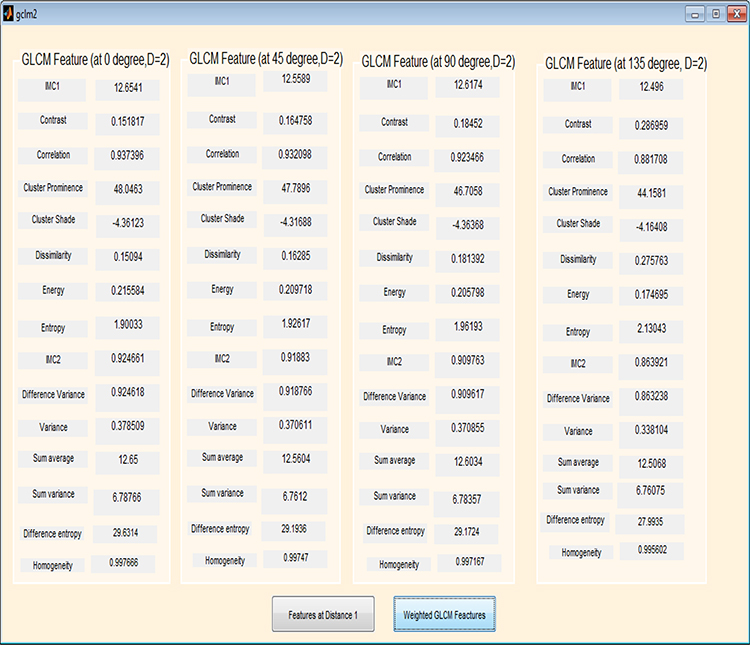 |
Figure 5 Gray level co-occurrence matrix (GLCM) features computed at D=2. |
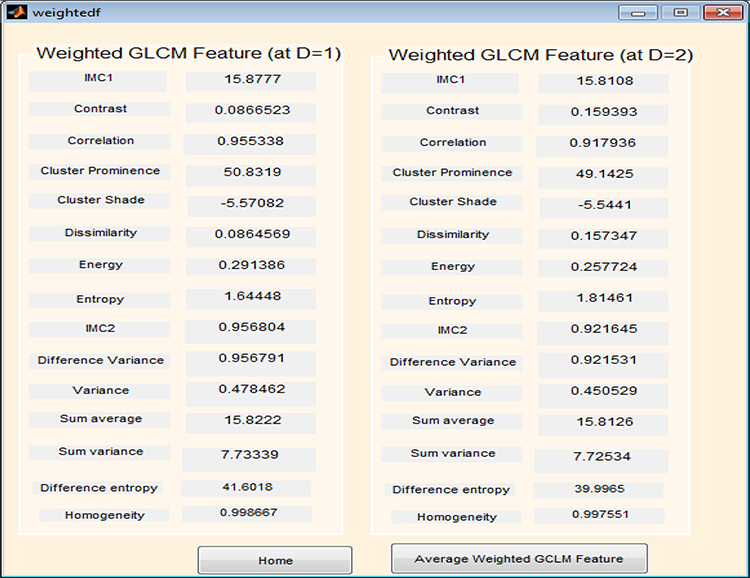 |
Figure 6 Weighted gray level co-occurrence matrix (GLCM) features computed at distances 1 and 2. |
 |
Figure 7 Overall average gray level co-occurrence matrix (GLCM) features computed. |
The first-stage classification entails categorizing the mammograms as either normal or abnormal as illustrated in Figure 8; this is termed the first-stage classification. If the image is normal the algorithm stops. However, if any abnormality is detected, the algorithm further classifies the abnormality into benign or malignant (see Figure 9); this is second-stage classification.
 |
Figure 8 First-stage of classification: (A) normal mammogram classification; (B) abnormal mammogram classification. |
 |
Figure 9 Second-stage classification: (A) benign; (B) malignant. |
System testing and performance evaluation
The model was tested to determine if the learning algorithm really performed its recognition task of differentiating normal and abnormal image on one hand and malignant and benign on the other hand.
The aim of this step is to introduce the model to the 78 unseen mammograms after it has been trained with a training dataset so as to test how well it performed.
First-stage classification
Using the expert’s classification provided alongside the dataset as the actual class, in the first-stage classification, all the 37 normal images were classified as normal (no false positive) and all 41 abnormal images were correctly classified to be abnormal (no false negative) meaning that the model can accurately detect abnormality, that is, each of the sensitivity, specificity and accuracy of the model in detecting abnormality is 100%
Second-stage classification
After the detection of abnormality, the system further classified the abnormality on the mammograms to be either “Benign” or “Malignant”. This is the second-stage classification. Out of 23 benign images, 21 were classified as truly benign while 2 are misclassified to be malignant. Also, out of 18 malignant images, 17 were classified to be malignant while an image was misclassified to be benign. These values are entered into a confusion matrix as shown in Table 2.
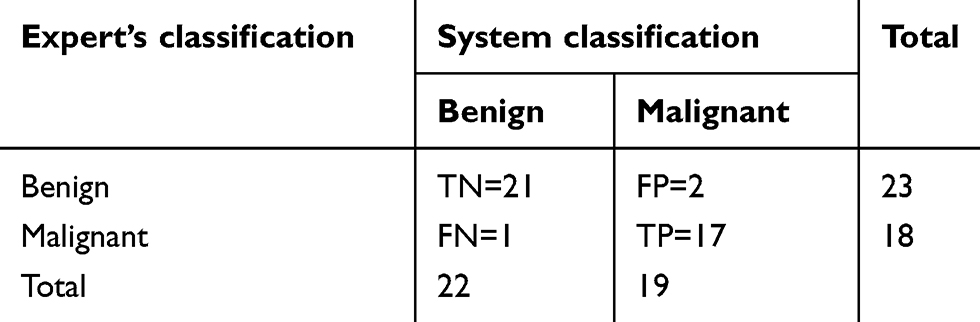 |
Table 2 The system’s confusion matrix |
Results from proposed technique and existing works
Table 3 presents the results of existing works who also classified MIAS database mammograms using SVM. These are compared with the results obtained from the proposed technique. Results obtained from existing works have classified mammograms in MIAS database to either normal or abnormal mammograms or benign or malignant mammograms. However, this work reported an automated MIAS database mammograms classification in which mammogram are classified first to abnormal and normal, after which the abnormal mammograms were further classified into benign or malignant mammograms.
 |
Table 3 Results from proposed technique and existing works |
Results and discussion
For the first stage classification, the sensitivity, specificity, PPV and NPV of the model are all 100%. This means that the system is 100% accurate of differentiating abnormal mammograms from normal ones.
Using the information on the confusion matrix labeled Table 2, the second level sensitivity, specificity; PPV and NPV of the model were calculated thus:
(1) (2) (3) (4)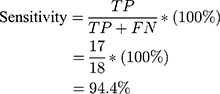
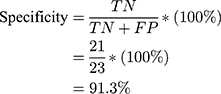
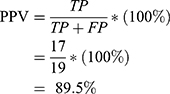
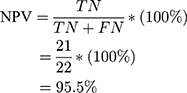
From the performance metrics, the probability that the system would detect a malignancy among patients that have cancer is 0.944, that is, sensitivity =94.4%; the probability that the system would classify a patient’s mammogram image as benign among patients that do not have cancer is 0.913 (specificity =91.3%). Also, the probability that a mammogram would be actually malignant when it is classified to be cancerous by the system is 0.895 (PPV =89.5%) and the probability that the mammogram would be benign when the system says it is not malignant is 0.955, that is, NPV =95.5%.
Conclusion
The significant variability that occurs when interpreting the same mammogram independently by different radiologists leads to diagnostic errors. It is therefore imperative to find an improved method to aid the detection and classification of ROI on mammograms. This article has discussed an automated mammogram classification system that uses a modified SVM classification technique. Performance evaluation results obtained suggested that the system could be used as radiologists’ potential tool for supporting decision making in mammogram interpretation. This could in turn help Radiologists to make an accurate and timely decision, thereby increasing the efficiency of their diagnostic skills.
Data availability
Raw mammograms used in this work are publicly available at mini-MIAS: http://peipa.essex.ac.uk/pix/mias/.
Acknowledgments
The authors’ appreciation goes to Landmark University Centre for Research and Development, Landmark University, Omu-Aran, Nigeria for fully sponsoring the publication of this research. Also, we acknowledge all authors whose works are referenced in this paper.
Disclosure
The authors report no conflicts of interest in this work.
References
1. Erhabor O, Abdulrahaman Y, Retsky M, et al. Breast Cancer in Nigeria: Diagnosis, Management and Challenges. UK: AuthorHouse; 2016.
2. Said MA, Henry AS, Ewunonu EO, et al. Breast cancer mortality in a resource-poor country: a 10-year experience in a tertiary institution. Sahel Med J. 2017;20:77–93.
3. Charate AP, Jamge SB. The preprocessing methods of mammogram images for breast cancer detection. IJRITCC. 2017;5(1):261–264.
4. Andreea GI, Pegza R, Lascu L, et al. The role of imaging techniques in diagnosis of breast cancer. Curr Health Sci J. 2011;37(2):241–248.
5. Duijm LE, Louwman MW, Groenewoud JH, et al. Inter-observer variability in mammography screening and effect of type and number of readers on screening outcome. Br J Cancer. 2009;100(6):901–907.
6. Elmore JG, Miglioretti DL, Reisch LM, et al. Screening mammograms by community radiologists: variability in false-positive rates. J Natl Cancer Inst. 2002;94(18):1373–1380.
7. Azar AT. Statistical analysis for radiologists’ interpretations variability in mammograms. Int J Syst Biol Biomed Technol. 2014;1(4):28–46. doi:10.4018/ijsbbt.2012100103
8. Dougherty G. Image analysis in medical imaging: recent advances in selected examples. Biomed Imaging Interv J. 2010;6(3):1–10.
9. Suckling J, Parker J, Dance DR, et al. The mammographic image analysis society digital mammogram database. In: Gale AG, Astley SM, Dance DR, Cairns AY (editors). Proceedings of the 2nd International Workshop on Digital Mammography. Amsterdam: Excerpta Medica; 1994.
10. Luqman MM, Nor AMI. Preprocessing technique for mammographic images. Int J Comput Sci Inf Technol Res. 2014;2(4):226–231.
11. Kayode AA, Odeniyi OA, Efunboade AO. Enhancement and segmentation of mammograms for further analysis. IJCSIS. 2017;15(6):417–424.
12. Vasantha M, Bharathi VS, Dhamodharan R. Medical image feature extraction, selection and classification. Int J Eng Sci Technol. 2010;2(6):2071–2076.
13. Haralick RM, Shanmugam K, Dinstein I. Textural features for image classification. IEEE Trans Syst Man Cybern. 1973;SMC-3(6):610–621.
14. Soh LK, Tsatsoulis C. Texture analysis of SAR sea ice imagery using gray level co-occurrence matrices. IEEE Trans Geosci Remote Sens. 1999;37(2):780–795.
15. Khuzi AM, Besar R, Zaki WM, et al. Identification of masses in digital mammogram using gray level co-occurrence matrices. Biomed Imaging Interv J. 2009;5(3):1–13.
16. Nithya R, Santhi B. Classification of normal and abnormal patterns in digital mammograms for the diagnosis of breast cancer. Int J Comput Appl. 2011;28(6):21–26.
17. Maitra IK, Nag S, Bandyopadhyay SB. Identification of abnormal masses in digital mammography images. Int J Comput Graphics. 2011;2(1):17–30.
18. Pradeep N, Girisha H, Sreepathi B, et al. Feature extraction of mammograms. Int J Bioinformatics Res. 2012;4(1):241–244.
19. Savita L., Rupali T, Almas S, Prapti DD.Detection and classification of breast mass using support vector machine. IOSR J Comput Eng. 2011;1–6.
20. Domínguez AR, Nandi AK. Toward breast cancer diagnosis based on automated segmentation of masses in mammograms. Pattern Recognit. 2009;42:1138–1148. doi:10.1016/j.patcog.2008.08.006
21. Rejani YIA, Selvi ST. Early detection of breast cancer using SVM classifier technique. Int J Comput Sci Eng. 2009;1(3):127–130.
22. Moayedi F, Azimifar Z, Boostani R, Katebi S. Contourlet-based mammography mass classification using the SVM family. Comput Biol Med. 2010;40(4):373–383. doi:10.1016/j.compbiomed.2009.12.006
23. Dheeba J, Tamil S. Classification of malignant and benign microcalcification using SVM classifier. 2011
24. Kavitha S, Thyagharajan KK. Features Based Mammogram Image Classification Using Weighted Feature Support Vector Machine. International Conference on Computing and Communication Systems. Berlin (Heidelberg): Springer; 2011:320–329.
25. Zhang E, Wang F, Li Y, Bai X. Automatic detection of microcalcifications using mathematical morphology and a support vector machine. Biomed Mater Eng. 2014;24(1):53–59.2. doi:10.3233/BME-130783
26. Kamra A, Jain VK, Singh S, Mittal S. Characterization of architectural distortion in mammograms based on texture analysis using support vector machine classifier with clinical evaluation. J Digit Imaging. 2016;29(1):104–114.
27. Rouhi R, Jafari M, Kasaei S, Keshavarzian P. Benign and malignant breast tumors classification based on region growing and CNN segmentation. Expert Syst Appl. 2015;42(3):990–1002. doi:10.1016/j.eswa.2014.09.020.
28. Damasceno E, Oseas A, Filho DC, et al. Method of differentiation of benign and malignant masses in digital mammograms using texture analysis based on phylogenetic diversity. Comput Electr Eng. 2018:210–222. doi:10.1016/j.compeleceng.2018.03.038
29. Kaur P, Singh G, Kaur P. Intellectual detection and validation of automated mammogram breast cancer images by multi-class SVM using deep learning classification. Inf Med Unlocked. 2019;1–19. doi:10.1016/j.imu.2019.01.001
 © 2019 The Author(s). This work is published and licensed by Dove Medical Press Limited. The
full terms of this license are available at https://www.dovepress.com/terms
and incorporate the Creative Commons Attribution
- Non Commercial (unported, 3.0) License.
By accessing the work you hereby accept the Terms. Non-commercial uses of the work are permitted
without any further permission from Dove Medical Press Limited, provided the work is properly
attributed. For permission for commercial use of this work, please see paragraphs 4.2 and 5 of our Terms.
© 2019 The Author(s). This work is published and licensed by Dove Medical Press Limited. The
full terms of this license are available at https://www.dovepress.com/terms
and incorporate the Creative Commons Attribution
- Non Commercial (unported, 3.0) License.
By accessing the work you hereby accept the Terms. Non-commercial uses of the work are permitted
without any further permission from Dove Medical Press Limited, provided the work is properly
attributed. For permission for commercial use of this work, please see paragraphs 4.2 and 5 of our Terms.