Back to Journals » Clinical Ophthalmology » Volume 19
Amygdala Connectivity Alterations in High Myopia: A Resting-State fMRI Study with SVM-Based Classification
Authors Dong ZE ![]() , Ji Y, Zhou L, Yuan HY, Chai H, Duan YC, Yao LL, Wu XR
, Ji Y, Zhou L, Yuan HY, Chai H, Duan YC, Yao LL, Wu XR
Received 31 May 2025
Accepted for publication 18 September 2025
Published 17 October 2025 Volume 2025:19 Pages 3837—3849
DOI https://doi.org/10.2147/OPTH.S543962
Checked for plagiarism Yes
Review by Single anonymous peer review
Peer reviewer comments 2
Editor who approved publication: Dr Scott Fraser
Zhuo-Er Dong,* Yu Ji,* Lin Zhou, Hao-Yu Yuan, Hua Chai, Yi-Chong Duan, Li-Li Yao, Xiao-Rong Wu
Ophthalmology Department of the First Affiliated Hospital, Jiangxi Medical College, Nanchang University, Nanchang, Jiangxi Province, 330006, People’s Republic of China
*These authors contributed equally to this work
Correspondence: Xiao-Rong Wu, Ophthalmology Department of the First Affiliated Hospital, Jiangxi Medical College, Nanchang University, Nanchang, Jiangxi Province, People’s Republic of China, Tel +86 13617093259, Email [email protected]
Background: High myopia (HM) is strongly linked to emotional disorders like anxiety and depression. While prior neuroimaging findings in HM are varied, the role of the amygdala—the brain’s core emotion center—remains critically under-explored. Given evidence of limbic system changes in other ophthalmic disorders (eg, glaucoma), we investigated amygdala-specific functional connectivity (FC) in HM.
Methods: We acquired resting-state fMRI data from 82 HM patients and 59 healthy controls (HCs). Using a seed-based approach with the bilateral amygdalae, whole-brain FC was compared between groups. A support vector machine (SVM) then evaluated the classification power of the identified FC alterations.
Results: Compared to HCs, HM patients showed significantly increased FC between the amygdala and key regions in the visual, default mode, and executive control networks, including the calcarine fissure, precuneus, and middle frontal gyrus. SVM models achieved robust classification performance, with an area under the curve (AUC) up to 0.765.
Conclusion: This study provides the first report on amygdala-centric network reorganization in HM. These FC patterns show potential as neuroimaging biomarkers. Our findings offer preliminary evidence for a neural substrate underlying the emotional and cognitive dysregulation in HM, highlighting the need to address mental health in these patients.
Keywords: high myopia, amygdala, functional connectivity, resting-state functional magnetic resonance imaging, support vector machine, machine learning
Introduction
Myopia, the world’s most common eye abnormality and a common cause of vision loss, is a global disease that places a tremendous burden on society, with an estimated 1.406 billion people worldwide suffering from myopia, or 22.9% of the population.1 High myopia (HM), compared with regular myopia, is associated with an increased likelihood of ocular complications such as macular hemorrhage, retinal detachment, and choroidal neovascularization (CNV), potentially resulting in visual impairment.2–4 This ophthalmic disorder now demonstrates unprecedented demographic expansion, as evidenced by statistical models forecasting 5 billion global cases of HM before mid-century,5 and has therefore become a global public health problem of increasing concern. It is worth noting that HM has been widely noticed by scholars because it leads to high mood swings in patients and makes them susceptible to anxiety and depression.,6,7 In addition, the amygdala is often considered the physical organ that produces depression, anxiety, fear, and other emotions in humans.8,9
As a key modulator of neurocognitive functions, the amygdala—an almond-shaped nuclear complex situated in the medial temporal lobe—orchestrates emotional processing, attentional mechanisms, mnemonic encoding, and cross-modal sensory coordination.10 Its integrity is closely linked to mental health; for instance, magnetic resonance imaging studies have consistently associated depressive states with volumetric reductions in the amygdala.11 This is particularly relevant as patients with high myopia (HM) frequently report a higher burden of depressive and anxiety symptoms.12 This clinical overlap strongly suggests that the amygdala may be a critical neuroanatomical substrate underlying the emotional dysregulation in HM. The rationale for focusing specifically on the amygdala in high myopia is substantially strengthened by convergent evidence from other ophthalmic disorders, which identifies this structure as a key site of vulnerability beyond the visual pathway. For instance, neuroimaging studies in glaucoma have documented direct structural consequences, revealing significant atrophy in the left amygdala of affected patients.13 This link extends beyond gross structural changes to encompass functional integrity; research on patients with a genetic form of macular dystrophy has uncovered impairments in cognitive processes heavily modulated by the amygdala, such as emotional learning and memory consolidation.14 Crucially, these functional deficits were observed even when other limbic structures like the hippocampus appeared structurally intact, highlighting the necessity of investigating brain function, not just structure. Taken together, this body of evidence—spanning both structural and functional domains—firmly establishes the amygdala as a critical node susceptible to pathology in chronic eye diseases. This makes it imperative to clarify how the functional connectivity of the amygdala is altered in high myopia, an area that, until now, has remained unexplored. Therefore, we intend to investigate the link between HM and the amygdala.
In addition, dHb is paramagnetic, and water molecules in partially deoxygenated blood undergo a more pronounced dephasing phenomenon, resulting in a weakening of the T2-weighted image of venous blood and dHb-containing tissues, which is reflected as a weakening of the fMRI signal, which is called the blood oxygen level dependent (BOLD) effect.15–17 Utilizing the BOLD signal, functional magnetic resonance imaging (fMRI) enables non-task-based assessment of neurological activity, providing millimeter-scale visualization of dynamic structural and functional changes through non-invasive methodology.18–21 When the brain performs tasks, active regions consume oxygen to maintain function, which causes an increase in local dHb levels. When fMRI studies are performed, positively activated brain regions are thus reflected as enhanced fMRI signals. Therefore, when performing fMRI studies, positively activated brain regions are reflected as enhanced fMRI signals.22,23 Functional connectivity (FC) analysis is among the various analytical approaches employed in resting-state functional magnetic resonance imaging (rs-fMRI) research, which refers to the temporal dependency of spontaneous neuronal activity between anatomically separated different brain regions, which does not take into account the directionality or causality between the brain regions, and is a kind of directionless connectivity.24,25 Rs-fMRI holds substantial promise for elucidating the brain’s functional architecture.26 Prior to this, Wei et al found that hippocampal functional connectivity (FC) was impaired in patients with HM, indicating that individuals with HM could exhibit impairments affecting affective-cognitive coordination, ocular regulatory mechanisms, along with integrative sensory functions.27 Huang et al demonstrated altered amplitude of low-frequency fluctuations (ALFF) in discrete neuroanatomical regions among individuals with HM which may indicate changes in language comprehension and attentional control deficits in HM patients.28 Cheng et al found that the comparison of DC values between HM and LM could reflect the different changes in the two brain regions, suggesting that differential neurophysiological mechanisms underlying HM compared to LM.29 Currently, despite extensive research on brain changes in HM, changes in the subamygdala in HM are not yet known, and there is still a lack of evidence for this, so more research is needed from us.
Machine learning (ML), a core branch of artificial intelligence, enables computers to autonomously learn and optimize performance from massive datasets without relying on explicit programming. At its essence, ML involves constructing algorithmic models capable of deciphering inherent patterns in data, thereby achieving accurate predictions and intelligent decision-making for specific tasks.30,31 Among various ML approaches, Support Vector Machine (SVM) implements automated classification by maximizing the margin of separation hyperplanes (support vectors), demonstrating exceptional performance in classification tasks due to its high sensitivity to subtle patterns within complex datasets.32–34 Previous research has demonstrated SVM’s remarkable advantages in ophthalmic disease classification. For instance, this technique has been successfully applied to automated identification of diabetic retinopathy (DR) in diabetic patients,35 exhibited efficient large-scale data processing capabilities in glaucoma screening,36 and provided new perspectives for personalized treatment planning by quantifying key features of keratoconus and predicting its progression trends.37 Given SVM’s established efficacy in ophthalmic disease classification, this study proposes to employ SVM methodology to achieve automated classification between HM and healthy controls (HCs) based on amygdala-related neuroimaging markers under the influence of HM.
Utilizing rsfMRI, this investigation examined amygdala-related FC abnormalities across whole-brain networks among individuals with HM, seeking to identify potential neuroimaging biomarkers for this condition. Employing the amygdalar-seeded FC methodology, our neuroimaging protocol implemented whole-brain connectivity mapping to map connectivity patterns, followed by SVM classification to evaluate the diagnostic utility of these FC patterns in distinguishing HM patients from healthy controls. Our investigation was guided by two key hypotheses derived from existing literature: that HM patients would exhibit impaired emotional processing capabilities due to disrupted amygdala connectivity and that these amygdala-related FC patterns could serve as reliable neuroimaging markers for HM classification, given the amygdala’s well-established role in emotional regulation and its potential vulnerability in visual impairment conditions.
Methods
Population Recruitment Processing
This study utilized the same participant cohort and identical inclusion/exclusion criteria as our prior investigation.27 The original recruitment was conducted at The First Affiliated Hospital of Nanchang University in 2021 (August to December), comprising 82 patients with HM and 59 demographically matched healthy controls (HCs). While our previous work focused on characterizing hippocampal functional connectivity (FC) alterations in HM patients compared to HCs, the present study adopts an innovative computational framework to systematically evaluate amygdala-centered FC perturbations across whole-brain networks in the HM cohort. This approach leverages the same well-phenotyped participant sample to address distinct but complementary neurobiological questions, thereby extending our understanding of HM-related network dysfunction beyond hippocampal circuitry.
The sample size was determined by the availability of eligible participants during the recruitment period. To evaluate whether the sample size was adequate, we conducted a post-hoc power analysis using G*Power 3.1. With 82 patients and 59 healthy controls, the statistical power was 0.829 at a significance level of 0.05 (two-tailed) to detect a medium effect size (Cohen’s d = 0.5), indicating that the cohort size was sufficient for the present analyses.
Functional MRI Data Processing Workflow
Neuroimaging Data Acquisition
Resting-state functional MRI (rs-fMRI) scans were performed using a Siemens 3T MAGNETOM Prisma scanner (Erlangen, Germany) equipped with an 8-channel phased-array head coil at the Radiology Department of the First Affiliated Hospital of Nanchang University. During the 8-minute acquisition protocol, participants were instructed to remain awake with eyes closed while 240 contiguous whole-brain volumes were collected using a gradient-echo planar imaging (EPI) sequence.
Participant Preparation
During pre-scan preparation, participants were directed to maintain eyes-closed, supine positioning while sustaining wakefulness in a state of non-directed mentation. To minimize external noise and head movement, participants wore earplugs and had symmetrical foam pads positioned bilaterally. A sleep monitoring device was employed to verify wakefulness throughout the procedure.
Post-Scan Protocol
Following the scan, participants underwent a brief mental state assessment to confirm procedural safety.
Imaging Parameters
- Rs-fMRI: Field of view (FOV) = 240 × 240 mm2; repetition time (TR) = 2000 ms; echo time (TE) = 40 ms; flip angle = 90°; matrix = 64 × 64; 30 axial slices with 4 mm thickness and 1 mm gap.
- High-resolution T1-weighted anatomical images: TR/TE = 1900/2.26 ms; flip angle = 9°; FOV = 240 × 240 mm2; matrix = 256 × 256; 176 sagittal slices at 1 mm thickness.
Data Preprocessing
First, participants exhibiting clinically significant brain lesions (assessed through structural MRI and neurological evaluation) were excluded from the cohort. The rs-fMRI data were then screened and examined using the MRIcro software package (www.MRIcro.com) to remove data from subjects with incomplete images and large head movements or artifacts. Finally, data preprocessing was based on the MATLAB 2012a (Mathworks, Natick, MA, USA) platform and the SPM 8 (http://www.fil.ion.ucl.ac.uk/spm) software package, and the DPIBI (http://www.restfmri.net) software package was used for analysis. The specific steps are described below and the analytical workflow is shown in Figure 1:
 |
Figure 1 Resting-state fMRI data preprocessing process. (a) Data screening and format conversion. (b) Covariate removal and filtering. (c) Grouping and statistical analysis: ① Group: HM group vs HC group; ② Machine learning validation: SVM classification (area under the ROC curve ≈ 0.765). Abbreviations: fMRI, functional magnetic resonance imaging; HM, high myopia; HC, healthy control; ROC, receiver operating characteristic; SVM, support vector machine. |
- Image data format conversion: Converts image data in DICOM format to image data in NIFTI format.
- The initial 10 time points were discarded to accommodate two critical stabilization phases: (a) establishment of magnetic field equilibrium, and (b) participant acclimation to gradient-induced acoustic noise. This standard preprocessing step ensures the attainment of steady-state BOLD signals.
- Time layer correction: The signals from the remaining 230 time points are corrected to the same moment according to a certain algorithm.
- Head motion correction: Although rigid head immobilization was maintained throughout image acquisition, some subtle movements were inevitable due to the long scanning time, breathing or swallowing of the subject, etc., which interfered with the BOLD signals, and thus the head motion had to be corrected. A rigid-body transformation of the 24 head-movement parameters was used, and no subjects were excluded due to head translations >3 mm and/or rotations >3° based on the estimates of the motion calibration.
- Segmentation alignment: To ensure a proper alignment process, we used the DARTELA toolbox to create custom templates based on the T1 structural images of all subjects, and then used the optimized custom templates to segment the aligned structural images of all subjects into three parts.
- The functional neuroimaging data underwent standardized spatial preprocessing using the following pipeline: First, individual subject scans were coregistered to the Montreal Neurological Institute (MNI-152) standard stereotaxic space through nonlinear transformation. This spatial normalization procedure included reslicing to isotropic 3mm³ voxels for optimal balance between spatial resolution and computational efficiency. Subsequently, a Gaussian spatial filter with 6mm full-width at half maximum (FWHM) was applied to reduce inter-subject anatomical variability while preserving meaningful functional signals.
- Removal of covariates and linear drift: Covariates such as whole-brain mean signal, Friston-24 motion parameters, along with white matter and CSF signal were removed using multiple regression, and linear convergence effects of subjects’ machine adaptation and machine temperature were removed by the de-linear drift technique.
- Filtering: The data is processed with a bandwidth of 0.01–0.08Hz to reduce the negative impacts caused by low-frequency drift as well as high-frequency noise on the accuracy of the data. Temporal band-pass filtering (0.01–0.08 Hz) was applied to the time series. This frequency range has been widely adopted in resting-state fMRI studies, as it captures spontaneous low-frequency fluctuations associated with neural activity while effectively reducing low-frequency drift and high-frequency physiological noise.38,39
Functional Connectivity Analysis
For functional connectivity (FC) analysis, we utilized the DPARSF 4.5 toolbox with the following processing pipeline: First, the bilateral amygdala was selected as regions of interest (ROIs) based on the automated anatomical labeling (AAL) atlas. Whole-brain voxel-wise FC maps were subsequently created through Pearson correlation analysis of the mean time series from each amygdala ROI with all remaining brain voxels.
To examine distinct amygdala connectivity profiles comparing HM patients with healthy controls (HCs), we conducted between-group t-tests implemented in the DPABI toolkit. Statistical significance was determined using false discovery rate (FDR) correction for multiple comparisons. To improve the robustness of our findings, we applied an additional cluster-extent threshold requiring a minimum of Y contiguous voxels for each significant cluster.
Support Vector Machine Analysis
For pattern classification analysis, we implemented a support vector machine (SVM) algorithm using the LIBSVM toolbox (version 3.2x) in MATLAB 2017b (MathWorks). The primary objective was to evaluate whether amygdala-based functional connectivity (FC) patterns may serve as potential neuroimaging biomarkers for distinguishing HM patients from healthy controls (HCs). To reduce dimensionality and avoid overfitting, amygdala-based whole-brain FC features were first extracted and then subjected to a two-step feature selection strategy: (i) univariate two-sample t-tests with FDR correction (P < 0.05, FDR-corrected) to preselect candidate features; and (ii) recursive feature elimination (RFE) embedded within the SVM to determine the optimal feature subset. The selected features were then used to train an SVM classifier with a radial basis function (RBF) kernel. Hyperparameters (C and γ) were optimized via grid search, and model performance was evaluated using leave-one-out cross-validation (LOOCV). Classification accuracy, sensitivity, and specificity were calculated to quantify the discriminative ability of the model.
Statistical Analysis
To compare zFC between HM patients and healthy controls, we conducted independent two-sample t-tests. Multiple comparisons were corrected using FDR theory, with age and sex included as covariates in the regression (P < 0.05, FDR-corrected).
Results
Basic Information
Our sample included 82 HM patients (43M/39F; mean age = 26.5±5.3) and 59 controls (24M/35F; mean age = 25.7±3.1).
Differences of FC Between HM and HC
Comparative analyses revealed distinct amygdala connectivity patterns between HM patients and HCs (Figures 2 and 3). Following false discovery rate correction (P < 0.05), patients with HM exhibited significantly enhanced functional connectivity between the right amygdala and multiple cortical regions, including the left calcarine fissure and surrounding cortex, the right precuneus, and the left middle frontal gyrus, left median cingulate and paracingulate gyri. Similarly, increased connectivity was observed between the left amygdala and both the left middle occipital gyrus and left middle frontal gyrus. The complete stereotaxic coordinates (MNI space) and corresponding effect sizes (Cohen’s d) for these findings are systematically presented in Tables 1 and 2. These results demonstrate a distinct pattern of amygdala network reorganization in HM patients, characterized by strengthened connectivity with visual association areas and frontal executive regions.
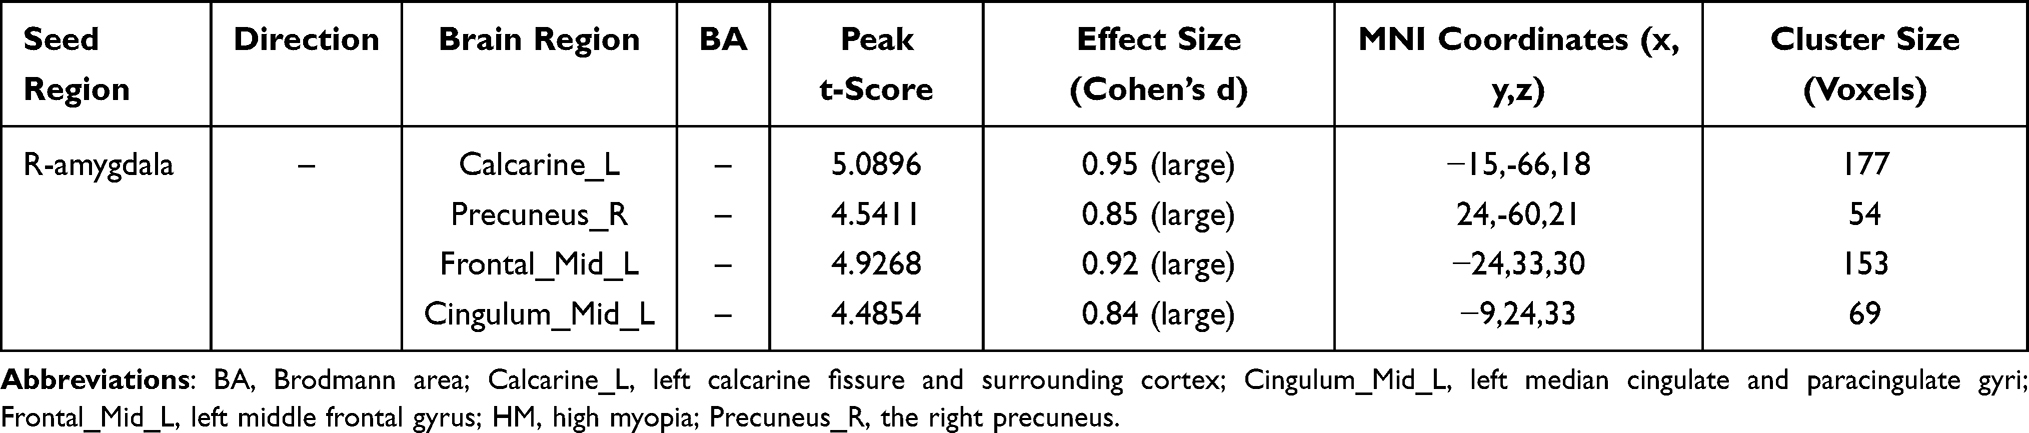 |
Table 1 Right Amygdala Functional Connectivity Alterations in HM |
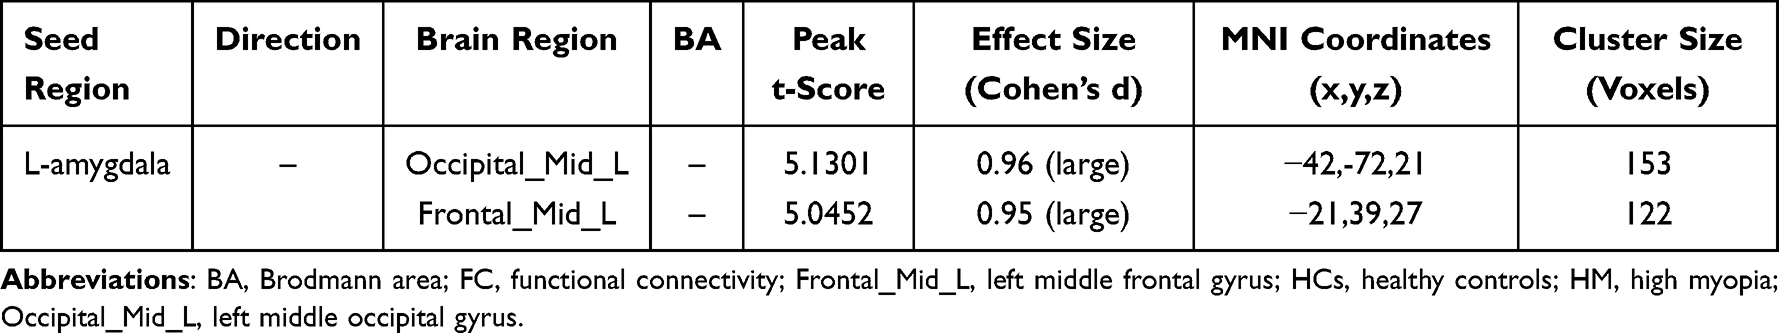 |
Table 2 Left Amygdala Functional Connectivity Alterations in HM |
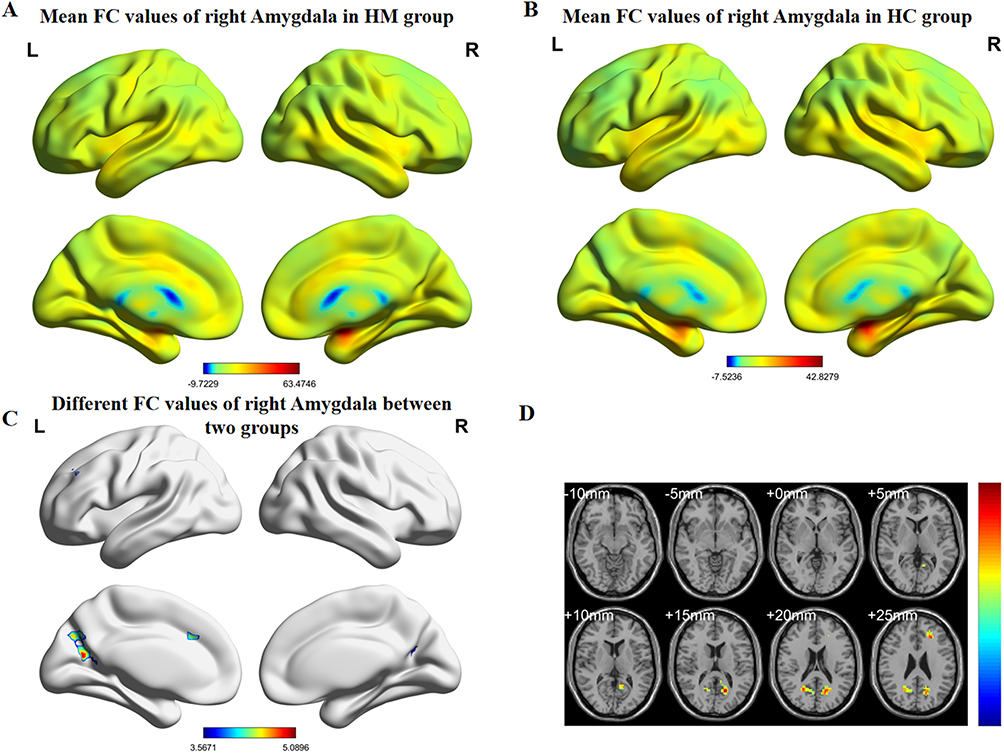 |
Figure 2 (A) HM group’s mean values of functional connectivity for right amygdala. (B) HC group’s mean values of functional connectivity for the right amygdala. (C) Differential functional connectivity values of the right amygdala between groups. (D) Statistically significant differences in right amygdala functional connectivity between HM and HC groups. Abbreviations: FC, functional connectivity; HM, high myopia; HC, healthy control. |
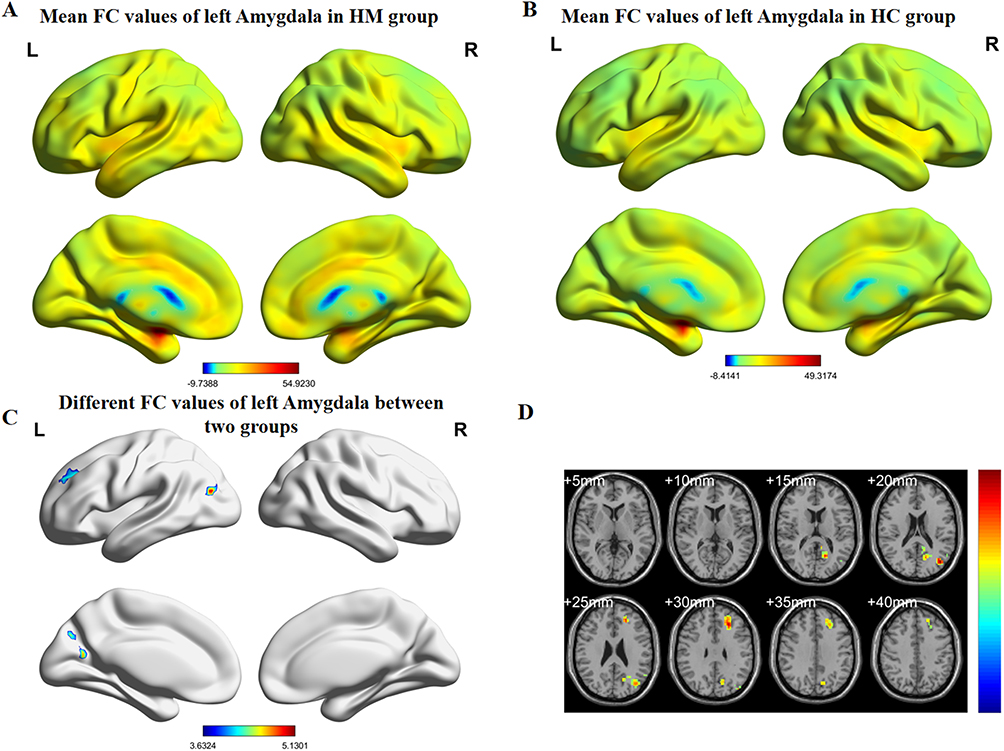 |
Figure 3 (A) HM group’s mean values of functional connectivity for left amygdala. (B) HC group’s mean values of functional connectivity for the left amygdala. (C) Group differences in left amygdala functional connectivity. (D) Statistically significant differences in left amygdala functional connectivity between HM and HC groups. Abbreviations: FC, functional connectivity; HM, high myopia; HC, healthy control. |
Correlation with Clinical Variables
To investigate the relationship between the observed FC changes and the clinical severity of high myopia, we performed a post-hoc Spearman correlation analysis. We examined the relationship between the FC values of the significant brain regions (as listed in 3.2) and three key clinical metrics: diopter, disease duration, and axial length. The analysis revealed no statistically significant correlations between the FC values and these clinical variables (all p > 0.05). The scatterplots for these analyses are provided in the Supplementary Materials (Supplementary Figures S1, S2, and S4).
Support Vector Machine Classification Results
Figure 4 and Table 3 demonstrate the SVM results based on amygdala imaging metrics for classifying patients with HM. The accuracy and area under the curve are 0.723 and 0.728 on the left side, and 0.731 and 0.765 on the right side, respectively, which means that the amygdala Imaging Indicators could be effective in HM patients diagnosis clinically. To visually represent the model’s classification performance in more detail, a confusion matrix was generated, which summarizes the classification results for each group (see Supplementary Figure S3).
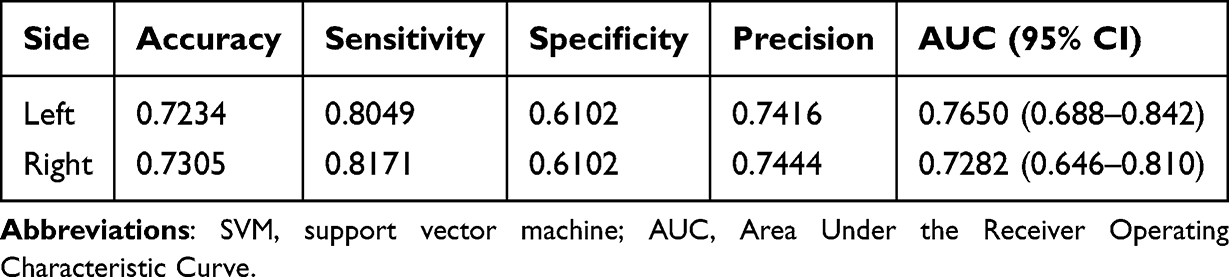 |
Table 3 SVM Classification of Patients with High Myopia Based on the Amygdala Imaging Index |
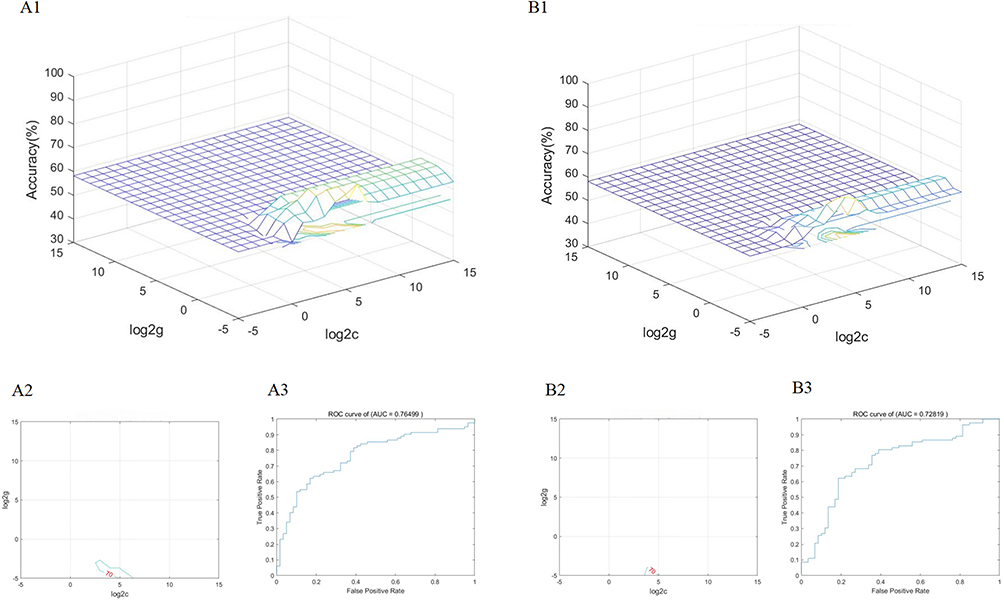 |
Figure 4 (A1) SVM classifier performance (AUC) for HM patients derived from right amygdala imaging features. (A2) Parameter selection result map of SVM classification results for patients with HM based on right amygdala imaging metrics (3D view). (A3) Plot of the results of parameter selection for the SVM classification of patients with HM based on right amygdala imaging metrics (contour plot). (B1) SVM classifier performance (AUC) for HM patients derived from left amygdala imaging features. (B2) Parameter selection result map of SVM classification results for patients with HM based on left amygdala imaging metrics (3D view). (B3) Plot of the results of parameter selection for the SVM classification of patients with HM based on left amygdala imaging metrics (contour plot). Abbreviations: AUC, area under the curve; ROC, receiver operating characteristic. |
Discussion
The core innovation of this study is the identification of a distinct pattern of amygdala-centric network reorganization in high myopia (HM), providing a tangible neural substrate for the emotional and cognitive challenges associated with the condition. In this study, we found that under rs-fMRI, the amygdala in individuals with HM enhanced FC with other brain regions, including the right amygdala with the left calcarine fissure and surrounding cortex (Calcarine_L), the right precuneus (Precuneus_R), and the left middle frontal gyrus (Frontal_Mid_L), left median cingulate and paracingulate gyri (Cingulum_Mid_L); and left amygdala with left middle occipital gyrus (Occipital_Mid_L), the left middle frontal gyrus (Frontal_Mid _L). Crucially, the robustness of this connectivity pattern was validated by a support vector machine (SVM) analysis, which successfully distinguished HM patients from controls, underscoring its potential as a biomarker for HM-associated neural reorganization.
We first used the amygdala as a seed area to assess the changes in connectivity between the amygdala and all other brain regions using the FC method. We found multiple brain regions with altered functional links to the amygdala in patients with HM. The association between the right precuneus and the amygdala has been previously expressed in the literature, with the amygdala and precuneus interacting to shape a person’s emotional response to self-relevant stimuli. Patterns of functional connectivity (especially anti-correlations) between the amygdala and precuneus may serve as neural markers of the effects of long-term exercise interventions on emotion regulation.40,41 In addition to this, the precuneus may also play a role in regulating emotional responses by influencing amygdala activity. For example, when we engage in self-reflection or positive thinking exercises, the precuneus may help to down-regulate amygdala activity, thereby reducing negative emotions.42,43 In the context of HM, the observed enhanced connectivity may therefore represent a neural marker of the increased demand for self-referential emotional processing and regulation, possibly reflecting the chronic stress and worry associated with vision loss.
Second, previous studies have demonstrated that amygdala emotional stimulation modulates function of the visual cortex.44,45 As part of the visual transmission process, left calcarine fissure and surrounding cortex belong to the visual cortex, which receives visual input from the retina and performs early-stage visual information processing, such as detecting edges, lines, and motion.46,47 Therefore, the enhanced FC between the amygdala and the calcarine cortex in HM patients may reflect a compensatory top-down modulation, where the emotion-processing network attempts to amplify and prioritize degraded or ambiguous visual information. Further research is warranted to elucidate the precise mechanism.
Third, the left middle frontal gyrus (MFG) is a key player in the symphony of higher-order cognitive functions. It is part of the prefrontal cortex, an area often referred to as the “command center” of the brain. Studies have shown that working memory, attention, regulation of verbal fluency, and language comprehension are key functions of MFG.48–50 In our HM cohort, the enhanced amygdala-MFG connectivity likely signifies the increased cognitive effort required to manage the visual deficit while maintaining attention. This heightened coupling represents a neural correlate of the constant cognitive load experienced by these patients.
Fourth, the left median cingulate and paracingulate gyri (DCG.L) are part of the cingulate gyrus, one of the nodes of the default mode network (DMN), which is associated with emotion regulation and cognitive function.51 It has been shown that in patients with early-onset bipolar disorder (BD), the FC of the middle cingulate gyrus is enhanced, reflecting altered functional connectivity within the DMN, with likely implications for destabilizing emotion regulation and cognitive control.52 In HM patients, this enhanced FC within a key DMN node may similarly reflect a heightened state of introspection and emotional self-monitoring, providing a potential mechanism for the increased prevalence of anxiety and depressive symptoms in this population.
Finally, the left middle occipital gyrus (MOG) constitutes a core component of the visual processing system and plays a more important role in some aspects of visual processing and may be involved in detail processing, object recognition, or spatial analysis, such as reading and language-related visual tasks.53 HM is often accompanied by retinal and choroidal thinning and optic nerve damage, resulting in blurred or diminished incoming visual signals.54,55 To compensate for low-quality input, the brain may optimize the efficiency of information integration by enhancing functional connectivity in vision-related brain regions, and left hemisphere lateralization functions (eg, language or fine analysis) may be mobilized to compensate for visual deficits.56 The enhanced FC in the MOG found in our study strongly supports this compensatory hypothesis. We propose that this heightened connectivity is a neuroplastic adaptation aimed at optimizing the processing of poor-quality visual input.
In addition, to further probe the clinical significance of these network alterations, we explored their relationship with diopter, disease duration, and axial length. However, in line with our results, no significant linear correlations were observed. These null findings may reflect limitations such as our sample size, as well as the complex, multifactorial interaction between chronic visual deficits and the brain’s functional architecture. The relationship is likely not a simple linear one and may be modulated by other unmeasured variables. Therefore, future research should incorporate a richer array of quantitative ophthalmic (eg, retinal thickness) and clinical data to better capture the intricate interplay between the eye and the brain’s emotional-cognitive systems.
In this study, SVM was used to validate the pattern of intergroup differences in FC. As a class of supervised machine learning algorithms, SVM has been widely used in the field of neuroimaging biomarker mining by virtue of its robustness in high-dimensional data classification. Previous studies have shown that SVM has demonstrated significant advantages in the directions of depression diagnosis57,58 and dementia identification.59 Our team’s previous study also confirmed that the SVM model constructed based on the dynamic FC (dynamic FC, dFC) of the left primary visual cortex (left V1) could effectively differentiate patients with HM from the healthy population (AUC=0.786).30 In this study, we further extended the SVM framework to functional connectivity analysis of amygdala subregions. The results showed that the feature combination based on the left amygdala (AUC=0.728, 95% CI: 0.652–0.804) and the right amygdala (AUC=0.765, 95% CI: 0.694–0.836) was able to achieve the classification of HM patients with high discriminative efficacy. This successful classification validates the biological significance of the identified amygdala-centric FC pattern and reinforces its potential as a robust neuroimaging biomarker. Finally, it should be noted that although we comprehensively evaluated the classification performance of the Support Vector Machine (SVM) model by reporting the AUC values and their 95% confidence intervals, we were unable to provide a calibration plot because the current LIBSVM-based pipeline outputs categorical predictions rather than probabilistic scores. This methodological limitation may restrict the full assessment of calibration performance, and future studies are warranted to implement probability-based calibration analyses.
This study has several limitations that should be noted. First, while our findings provide a compelling neural model for the psycho-cognitive aspects of HM, a key limitation of this study is the absence of standardized clinical assessments to quantify the emotional and cognitive status of the participants. Future research should incorporate a battery of psychometric scales, such as the Hamilton Anxiety Rating Scale (HAMA), Hamilton Depression Rating Scale (HAMD), Montreal Cognitive Assessment (MOCA), and Mini-Mental State Examination (MMSE). The inclusion of such data would be crucial for establishing direct brain-symptom correlations and for exploring whether the observed amygdala network alterations are specifically linked to emotional dysregulation, cognitive changes, or both, thereby providing a more comprehensive clinical context for our neuroimaging findings. In addition, the present SVM analysis was designed for group-level classification rather than individual-level prediction. Therefore, while altered amygdala-based FC patterns may serve as potential imaging markers reflecting emotional-cognitive involvement in HM, they cannot yet be used to predict which patients are at higher risk of emotional disorders. Such translational applications will require larger, longitudinal cohorts and predictive modeling frameworks.
Overall, we hope to use this study to better understand the effects of HM on the brain, particularly the amygdala, utilizing imaging metrics so that potential diagnostic and therapeutic avenues can be explored.
In conclusion, this study shifts the focus of neuroimaging in HM from purely visual pathways to the critical interface of vision, emotion, and cognition. By identifying a specific pattern of amygdala-centric network reorganization, we provide a potential neural framework for the heightened emotional and cognitive burden in these patients. These findings not only deepen our understanding of the whole-body impact of HM but also highlight the importance of addressing the psychological well-being of patients. The identified FC patterns serve as a promising avenue for developing future diagnostic biomarkers and exploring targeted therapeutic interventions.
Conclusion
The experimental results show that compared with the normal control group, the functional connectivity of certain brain areas in HM patients is significantly enhanced. This indicates that HM may cause significant changes in brain area activity, which is accompanied by clinical symptoms related to abnormal amygdala function, thereby becoming a cause of depressive and anxious emotions in some HM patients. This study provides further evidence for the link between HM and neurologic impairment, and patients with HM should be highly cared for on an emotional-psychological level along with clinical treatment. Future studies with larger, longitudinal cohorts are needed to validate amygdala-based functional connectivity as a potential biomarker and to explore whether targeted interventions, such as cognitive training or neuromodulatory approaches, may mitigate the neuro-emotional consequences of high myopia.
Data Sharing Statement
MRI data collection for this project was conducted at Jiangxi Provincial Medical Imaging Clinical Research Center/Clinical Research Center For Medical Imaging In Jiangxi Province (No. 20223BCG74001).
Ethics Statement
The studies involving human participants were reviewed and approved by the Declaration of Helsinki and was approved by the medical ethics committee of the First Affiliated Hospital of Nanchang University. The research program was approved by the institutional review board of the First Affiliated Hospital of Nanchang university. The participants provided their written informed consent to participate in this study.
Acknowledgments
We acknowledge the assistance provided by the National Nature Science Foundation of China (grant no. 82160207); Key projects of Jiangxi Youth Science Fund (No. 20202ACBL216008); Science and Technology Plan of Jiangxi Provincial Health and Health Commission (202130156); Postgraduate Innovation Special Fund Project in Jiangxi Province (YC2022—s198).
Author Contributions
All authors made a significant contribution to the work reported, whether that is in the conception, study design, execution, acquisition of data, analysis and interpretation, or in all these areas; took part in drafting, revising or critically reviewing the article; gave final approval of the version to be published; have agreed on the journal to which the article has been submitted; and agree to be accountable for all aspects of the work.
Funding
Funding sources are listed below: 1. National Natural Science Foundation of China (No.82160207); 2. Key projects of Jiangxi Youth Science Fund (No. 20202ACBL216008); 3. Science and Technology Plan of Jiangxi Provincial Health and Health Commission (No. 202130156); 4. Graduate student projects in Jiangxi Province (No.2025KXJYS601).
Disclosure
The authors declare that the research was conducted in the absence of any commercial or financial relationships that could be construed as a potential conflict of interest.
References
1. Modjtahedi BS. Public Health Burden and Potential Interventions for Myopia. Ophthalmology. 2018;125(5):628–630.
2. Wong TY, Ferreira A, Hughes R, et al. Epidemiology and disease burden of pathologic myopia and myopic choroidal neovascularization: an evidence-based systematic review. Am J Ophthalmol. 2014;157(1):9–25.e12.
3. Lin F, Zhao Z, Li F, et al. Longitudinal Macular Retinal and Choroidal Microvasculature Changes in High Myopia. Invest Ophthalmol Vis Sci. 2021;62(15):1. doi:10.1167/iovs.62.15.1
4. Montero JA, Ruiz-Moreno JM. Treatment of choroidal neovascularization in high myopia. Curr Drug Targets. 2010;11(5):630–644. doi:10.2174/138945010791011929
5. Holden BA, Fricke TR, Wilson DA, et al. Global Prevalence of Myopia and High Myopia and Temporal Trends from 2000 through 2050. Ophthalmology. 2016;123(5):1036–1042. doi:10.1016/j.ophtha.2016.01.006
6. Osuagwu UL, Meribe N, Nkanga ED, et al. Quality of life and depression among patients with high myopia in Nigeria: a cross sectional study. Int J Ophthalmol. 2023;16(12):2071–2081. doi:10.18240/ijo.2023.12.21
7. Zhang H, Gao H, Zhu Y, et al. Relationship Between Myopia and Other Risk Factors With Anxiety and Depression Among Chinese University Freshmen During the COVID-19 Pandemic. Front Public Health. 2021;9:774237. doi:10.3389/fpubh.2021.774237
8. Phelps EA, LeDoux JE. Contributions of the amygdala to emotion processing: from animal models to human behavior. Neuron. 2005;48(2):175–187. doi:10.1016/j.neuron.2005.09.025
9. Muller VI, Habel U, Derntl B, et al. Incongruence effects in crossmodal emotional integration. Neuroimage. 2011;54(3):2257–2266. doi:10.1016/j.neuroimage.2010.10.047
10. Baxter MG, Murray EA. The amygdala and reward. Nat Rev Neurosci. 2002;3(7):563–573. doi:10.1038/nrn875
11. Campbell S, Marriott M, Nahmias C, et al. Lower hippocampal volume in patients suffering from depression: a meta-analysis. Am J Psychiatry. 2004;161(4):598–607. doi:10.1176/appi.ajp.161.4.598
12. Mi Y, Chen K, Lin S, et al. Lactobacillaceae-mediated eye-brain-gut axis regulates high myopia-related anxiety: from the perspective of predictive, preventive, and personalized medicine. EPMA J. 2024;15(4):573–585. doi:10.1007/s13167-024-00387-z
13. Wang J, Li T, Sabel BA, et al. Structural brain alterations in primary open angle glaucoma: a 3T MRI study. Sci Rep. 2016;6(1):18969. doi:10.1038/srep18969
14. Arrigoni FI, Matarin M, Thompson PJ, et al. Extended extraocular phenotype of PROM1 mutation in kindreds with known autosomal dominant macular dystrophy. Eur J Hum Genet. 2011;19(2):131–137. doi:10.1038/ejhg.2010.147
15. Wu C, Ferreira F, Fox M, et al. Clinical applications of magnetic resonance imaging based functional and structural connectivity. Neuroimage. 2021;244:118649. doi:10.1016/j.neuroimage.2021.118649
16. Vanderwal T, Eilbott J, Castellanos FX. Movies in the magnet: naturalistic paradigms in developmental functional neuroimaging. Dev Cogn Neurosci. 2019;36:100600. doi:10.1016/j.dcn.2018.10.004
17. Domi T, Vossough A, Stence NV, et al. The Potential for Advanced Magnetic Resonance Neuroimaging Techniques in Pediatric Stroke Research. Pediatr Neurol. 2017;69:24–36. doi:10.1016/j.pediatrneurol.2016.12.015
18. Raimondo L, Oliveira ĹAF, Heij J, et al. Advances in resting state fMRI acquisitions for functional connectomics. Neuroimage. 2021;243:118503. doi:10.1016/j.neuroimage.2021.118503
19. Wang R, Liu N, Tao -Y-Y, et al. The Application of rs-fMRI in Vascular Cognitive Impairment. Front Neurol. 2020;11:951. doi:10.3389/fneur.2020.00951
20. Chen Z, Liu Y, Lin C, et al. Aberrant cerebral blood flow and functional connectivity in patients with vestibular migraine: a resting-state ASL and fMRI study. J Headache Pain. 2024;25(1):84. doi:10.1186/s10194-024-01792-5
21. Colombo B, Rocca MA, Messina R, et al. Resting-state fMRI functional connectivity: a new perspective to evaluate pain modulation in migraine? Neurol Sci. 2015;36(S1):41–45. doi:10.1007/s10072-015-2145-x
22. Gauthier CJ, Fan AP. BOLD signal physiology: models and applications. Neuroimage. 2019;187:116–127. doi:10.1016/j.neuroimage.2018.03.018
23. Guensch DP, Michel MC, Huettenmoser SP, et al. The blood oxygen level dependent (BOLD) effect of in-vitro myoglobin and hemoglobin. Sci Rep. 2021;11(1):11464. doi:10.1038/s41598-021-90908-x
24. van den Heuvel MP, Hulshoff PH. Exploring the brain network: a review on resting-state fMRI functional connectivity. Eur Neuropsychopharmacol. 2010;20(8):519–534. doi:10.1016/j.euroneuro.2010.03.008
25. Lurie DJ, Kessler D, Bassett DS, et al. Questions and controversies in the study of time-varying functional connectivity in resting fMRI. Netw Neurosci. 2020;4(1):30–69. doi:10.1162/netn_a_00116
26. Laumann TO, Snyder AZ, Mitra A, et al. On the Stability of BOLD fMRI Correlations. Cereb Cortex. 2017;27(10):4719–4732. doi:10.1093/cercor/bhw265
27. Wei B, Fu -W-W, Ji Y, et al. Exploration of Hippocampal Functional Connectivity Alterations in Patients with High Myopia via Seed-Based Functional Connectivity Analysis. Clin Ophthalmol. 2023;17:3443–3451. doi:10.2147/OPTH.S434797
28. Huang X, Zhou F-Q, Hu Y-X, et al. Altered spontaneous brain activity pattern in patients with high myopia using amplitude of low-frequency fluctuation: a resting-state fMRI study. Neuropsychiatr Dis Treat. 2016;12:2949–2956. doi:10.2147/NDT.S118326
29. Cheng Y, Yan L, Hu L, et al. Differences in network centrality between high and low myopia: a voxel-level degree centrality study. Acta Radiol. 2020;61(10):1388–1397. doi:10.1177/0284185120902385
30. Ji Y, Huang S-Q, Cheng Q, et al. Exploration of static functional connectivity and dynamic functional connectivity alterations in the primary visual cortex among patients with high myopia via seed-based functional connectivity analysis. Front Neurosci. 2023;17:1126262. doi:10.3389/fnins.2023.1126262
31. Ibrahim B, Suppiah S, Ibrahim N, et al. Diagnostic power of resting-state fMRI for detection of network connectivity in Alzheimer’s disease and mild cognitive impairment: a systematic review. Hum Brain Mapp. 2021;42(9):2941–2968. doi:10.1002/hbm.25369
32. Huang S, Cai N, Pacheco PP, et al. Applications of Support Vector Machine (SVM) Learning in Cancer Genomics. Cancer Genomics Proteomics. 2018;15(1):41–51. doi:10.21873/cgp.20063
33. Wang Z. A hybrid SVM-GLM approach for fMRI data analysis. Neuroimage. 2009;46(3):608–615. doi:10.1016/j.neuroimage.2009.03.016
34. He D, Ren D, Guo Z, et al. Insomnia disorder diagnosed by resting-state fMRI-based SVM classifier. Sleep Med. 2022;95:126–129. doi:10.1016/j.sleep.2022.04.024
35. Nissen T, Nørgaard TL, Schielke KC, et al. Performance of a Support Vector Machine Learning Tool for Diagnosing Diabetic Retinopathy in Clinical Practice. J Pers Med. 2023;13(7):1128. doi:10.3390/jpm13071128
36. Wu CW, et al. Glaucoma Detection Using Support Vector Machine Method Based on Spectralis OCT. Diagnostics. 2022;12(2):1.
37. Han X, Shen Y, Gu D, et al. Prediction of posterior elevation stability in keratoconus. Front Bioeng Biotechnol. 2023;11:1288134. doi:10.3389/fbioe.2023.1288134
38. Cordes D, Haughton VM, Arfanakis K, et al. Frequencies contributing to functional connectivity in the cerebral cortex in “resting-state” data. AJNR Am J Neuroradiol. 2001;22(7):1326–1333.
39. Biswal B, Zerrin Yetkin F, Haughton VM, et al. Functional connectivity in the motor cortex of resting human brain using echo-planar MRI. Magn Reson Med. 1995;34(4):537–541. doi:10.1002/mrm.1910340409
40. Lohaus M, Maurer A, Upadhyay N, et al. Differential modulation of resting-state functional connectivity between amygdala and precuneus after acute physical exertion of varying intensity: indications for a role in affective regulation. Front Hum Neurosci. 2024;18:1349477. doi:10.3389/fnhum.2024.1349477
41. Liu Y, Li M, Zhang B, et al. Transcriptional patterns of amygdala functional connectivity in first-episode, drug-naive major depressive disorder. Transl Psychiatry. 2024;14(1):351. doi:10.1038/s41398-024-03062-z
42. Ferri J, Schmidt J, Hajcak G, et al. Emotion regulation and amygdala-precuneus connectivity: focusing on attentional deployment. Cogn Affect Behav Neurosci. 2016;16(6):991–1002. doi:10.3758/s13415-016-0447-y
43. Kumar J, Vollm B, Palaniyappan L. Oxytocin affects the connectivity of the precuneus and the amygdala: a randomized, double-blinded, placebo-controlled neuroimaging trial. Int J Neuropsychopharmacol. 2014;18(5). doi:10.1093/ijnp/pyu051
44. Taubert J, Wardle SG, Patterson A, et al. Beyond faces: the contribution of the amygdala to visual processing in the macaque brain. Cereb Cortex. 2024;34(6). doi:10.1093/cercor/bhae245.
45. Ousdal OT, Andreassen OA, Server A, et al. Increased amygdala and visual cortex activity and functional connectivity towards stimulus novelty is associated with state anxiety. PLoS One. 2014;9(4):e96146. doi:10.1371/journal.pone.0096146
46. Dai W, Wang T, Li Y, et al. Cortical direction selectivity increases from the input to the output layers of visual cortex. PLoS Biol. 2025;23(1):e3002947. doi:10.1371/journal.pbio.3002947
47. Han X, Liu C, Chen Y, et al. Myopia prediction: a systematic review. Eye. 2022;36(5):921–929. doi:10.1038/s41433-021-01805-6
48. Dong JW, Brennan NMP, Izzo G, et al. fMRI activation in the middle frontal gyrus as an indicator of hemispheric dominance for language in brain tumor patients: a comparison with Broca’s area. Neuroradiology. 2016;58(5):513–520. doi:10.1007/s00234-016-1655-4
49. Yang L, Xiao A, Li Q-Y, et al. Hyperintensities of middle frontal gyrus in patients with diabetic optic neuropathy: a dynamic amplitude of low-frequency fluctuation study. Aging. 2022;14(3):1336–1350. doi:10.18632/aging.203877
50. Simpson GV, Weber DL, Dale CL, et al. Dynamic activation of frontal, parietal, and sensory regions underlying anticipatory visual spatial attention. J Neurosci. 2011;31(39):13880–13889. doi:10.1523/JNEUROSCI.1519-10.2011
51. Zhang S, Li B, Liu K, et al. Abnormal Voxel-Based Degree Centrality in Patients With Postpartum Depression: a Resting-State Functional Magnetic Resonance Imaging Study. Front Neurosci. 2022;16:914894. doi:10.3389/fnins.2022.914894
52. Hu Z, Tan Y, Zhou F, et al. Aberrant functional connectivity within and between brain networks in patients with early-onset bipolar disorder. J Affect Disord. 2023;338:41–51. doi:10.1016/j.jad.2023.05.057
53. Renier LA, Anurova I, De Volder AG, et al. Preserved functional specialization for spatial processing in the middle occipital gyrus of the early blind. Neuron. 2010;68(1):138–148. doi:10.1016/j.neuron.2010.09.021
54. Burgoyne CF, Wang YX, Jeoung JW, et al. OCT Optic Nerve Head Morphology in Myopia II: peri-Neural Canal Scleral Bowing and Choroidal Thickness in High Myopia-An American Ophthalmological Society Thesis. Am J Ophthalmol. 2023;252:225–252. doi:10.1016/j.ajo.2023.03.002
55. Wang YX, Panda-Jonas S, Jonas JB. Optic nerve head anatomy in myopia and glaucoma, including parapapillary zones alpha, beta, gamma and delta: histology and clinical features. Prog Retin Eye Res. 2021;83:100933. doi:10.1016/j.preteyeres.2020.100933
56. Lei J, Fan Y, Wu Y, et al. Microvascular Alterations of Peripapillary Choriocapillaris in Young Adult High Myopia Detected by Optical Coherence Tomography Angiography. J Pers Med. 2023;13(2):289. doi:10.3390/jpm13020289
57. Ahire N. EEG-derived brainwave patterns for depression diagnosis via hybrid machine learning and deep learning frameworks. Applied Neuropsychology. Adult. 2025;1–10. doi:10.1080/23279095.2025.2457999
58. Zhang B, Liu S, Chen S, et al. Common and unique neural activities in subclinical depression and major depressive disorder indicate the development of brain impairments in different depressive stages. J Affect Disord. 2022;317:278–286. doi:10.1016/j.jad.2022.08.128
59. Hassouneh A, Danna-Dos-Santos A, Bazuin B, et al. Multiscale Analysis of Alzheimer’s Disease Using Feature Fusion in Cognitive and Sensory Brain Regions. Digit Biomark. 2025;9(1):23–39. doi:10.1159/000543165
 © 2025 The Author(s). This work is published and licensed by Dove Medical Press Limited. The
full terms of this license are available at https://www.dovepress.com/terms
and incorporate the Creative Commons Attribution
- Non Commercial (unported, 4.0) License.
By accessing the work you hereby accept the Terms. Non-commercial uses of the work are permitted
without any further permission from Dove Medical Press Limited, provided the work is properly
attributed. For permission for commercial use of this work, please see paragraphs 4.2 and 5 of our Terms.
© 2025 The Author(s). This work is published and licensed by Dove Medical Press Limited. The
full terms of this license are available at https://www.dovepress.com/terms
and incorporate the Creative Commons Attribution
- Non Commercial (unported, 4.0) License.
By accessing the work you hereby accept the Terms. Non-commercial uses of the work are permitted
without any further permission from Dove Medical Press Limited, provided the work is properly
attributed. For permission for commercial use of this work, please see paragraphs 4.2 and 5 of our Terms.