Back to Journals » International Journal of Women's Health » Volume 13
Amniotic Fluid Volume Estimation from 20 Weeks to 28 Weeks. Do You Measure Perpendicular to the Floor or Perpendicular to the Uterine Contour?
Authors Hughes D, Simmons B, Magann E ![]() , Wendel M, Whittington JR
, Wendel M, Whittington JR ![]() , Ounpraseuth S
, Ounpraseuth S
Received 25 September 2021
Accepted for publication 11 November 2021
Published 25 November 2021 Volume 2021:13 Pages 1139—1144
DOI https://doi.org/10.2147/IJWH.S340378
Checked for plagiarism Yes
Review by Single anonymous peer review
Peer reviewer comments 2
Editor who approved publication: Dr Marleen van Gelder
Dawn Hughes,1 Brianna Simmons,1 Everett Magann,1 Michael Wendel,1 Julie R Whittington,1 Songthip Ounpraseuth2
1Department of Obstetrics & Gynecology, University of Arkansas for Medical Sciences, Little Rock, AR, USA; 2Department of Biostatistics, University of Arkansas for Medical Sciences, Little Rock, AR, USA
Correspondence: Everett Magann
Department of Obstetrics and Gynecology, University of Arkansas for Medical Sciences, 4301 W. Markham St. Slot # 518, Little Rock, AR, 72205-7199, USA
Tel +1 501-686-8345
Fax +1 501-526-7820
Email [email protected]
Objective: Two different techniques are described in the literature for measuring amniotic fluid pockets to estimate amniotic fluid volume. This study was undertaken to determine if ultrasound estimates using amniotic fluid index (AFI) and single deepest pocket (SDP) techniques should be measured perpendicular to floor vs perpendicular to uterine contour in pregnancies between 20 and 28 weeks.
Study Design: Amniotic fluid was measured using AFI and SDP techniques in low risk pregnant women undergoing an indicated ultrasound between 20 and 28 weeks of gestation. Measurements of both AFI and SDP were made holding the ultrasound transducer perpendicular to the floor and then perpendicular to the uterine contour. Pearson’s correlation coefficient was used to assess the association between estimated amniotic fluid volumes determined by the transducer perpendicular to the floor versus transducer perpendicular to the uterine contour; intra-class correlation coefficient was used to test agreement of the two techniques.
Results: Measurements were collected on 160 women between 20 and 28 weeks. For pregnancies between 20 and 28 weeks, the level of correlation for AFI was 0.67 (95% CI 0.57– 0.74) [moderate] and for SDP was 0.47 (95% CI: 0.34– 0.58) [poor].
Conclusion: In pregnancies between 20 and 28 weeks, the correlation of AFI values perpendicular to floor and perpendicular to the uterine contour remains moderate, either measurement can be used to estimate amniotic fluid volume. The correlation for SDP is poor and it remains uncertain which technique, perpendicular to floor or perpendicular to uterine contour, should be used for estimating amniotic fluid volume.
Keywords: amniotic fluid, fluid measurement, obstetric ultrasound, single deepest pocket, amniotic fluid index, pregnancy
Introduction
The ultrasound estimation of the amniotic fluid volume is done many times every day in a busy obstetric practice. The estimation is done at the time of the fetal anatomic survey as well as at the time of antenatal testing to determine if the amniotic fluid volume is low, normal or high. Estimations of low or high volumes identify pregnancies at risk for fetal anomalies at the time of fetal anatomy scan, and abnormal volumes at the time of antenatal testing identify at-risk pregnancies for additional surveillance or even delivery depending on the gestational age.1,2
Two methods of measuring the amniotic fluid pockets have been identified and are commonly used to estimate the amniotic fluid volume. These methods are the amniotic fluid index (AFI) and the single deepest pocket (SDP). The techniques describing how to measure the AFI and the SDP are different in the literature. In the technique by Rutherford, the ultrasound transducer is held perpendicular to the floor with the maximum vertical pocket identified in each quadrant measured and the maximum vertical pockets are summed.3 Moore et al, in his nomogram of the AFI, describes the transducer as being maintained in a vertical and sagittal alignment.4 The NICHD study of amniotic fluid volume describes an alignment of the transducer that is parallel to the floor.5 In the measuring technique by Chamberlain, the ultrasound transducer is held perpendicular to the uterine contour with the maximum vertical pockets measured in each of the 4 quadrants.6 The importance of using the best technique (perpendicular to the floor or perpendicular to the uterine contour) to estimate the amniotic fluid volume cannot be overemphasized. Since many decisions and interventions are undertaken if the amniotic fluid volume is labelled as abnormal, we must continually evaluate our techniques of measurement and their accuracy in labeling an amniotic fluid volume as oligohydramnios, normal fluid volume or polyhydramnios. We have previously published an assessment of these 2 techniques in pregnancies between 28 and 40 weeks.7 We observed that the level of agreement was moderate between the measurement techniques (perpendicular to the floor vs perpendicular to the uterine contour) for both the AFI and SDP, suggesting that either technique could be used to estimate those amniotic fluid volumes.
Do these techniques of measuring the amniotic fluid volume continue to correlate well when the uterine size is smaller, between 20 and 28 weeks? The purpose of this study is to determine if the ultrasound estimates using the AFI and the SDP measured perpendicular to the floor vs perpendicular to the uterine contour continue to agree when estimating the amniotic fluid volumes between 20 and 28 weeks.
Materials and Methods
This was a prospective study of women undergoing ultrasound examinations between 20 and 28 weeks at our medical teaching institution. The protocol was approved and informed consent was waived by the University of Arkansas for Medical Sciences Institutional Review Board (#217814) on 3/23/2018. Waivers of consent and HIPAA authorization were requested and granted. The rationale for the waivers was that this study is no more than minimal risk to the subjects and the research involves no procedures for which written consent is normally required outside of the research context. The waiver will not adversely affect subjects’ rights or welfare because nothing about their care will change. This study could not be practicably carried out without the waiver because at no time will the study team have direct contact with subjects. The only people to have direct contact with study subjects are the ultrasound techs who do not meet the definition of being engaged in the research and who would be unable to answer any questions about the research. This study will generate no information that is immediately relevant to the individual subjects. This research study on humans has been performed in accordance with the principles stated in the Declaration of Helsinki.”
Our inclusion criteria were women with low-risk pregnancies undergoing an ultrasound examination between 20 and 28 weeks of gestational age, at a time when the amniotic fluid volume would normally be measured for obstetrical indications. Our exclusion criteria included any fetus with structural anomalies or soft markers for fetal aneuploidy, pregnancies complicated by type 1, type 2, or gestational diabetes, or hypertensive disorders of pregnancy or other maternal/fetal conditions which might influence the amniotic fluid volume. We also excluded pregnancies in which the amniotic fluid volume would not normally be measured at the time of ultrasound examination.
All measurements were done with the patient lying supine on the examination table, without maternal tilt. All scans were done by Registered Diagnostic Medical Sonologists (RDMS) or maternal fetal medicine fellows/staff using the Voluson E8 ultrasound machines (GE Healthcare, Milwaukee, WI). The ultrasonographer measured the AFI and SDP with the transducer perpendicular to the floor and then repeated the measurement with the ultrasound transducer perpendicular to the uterine contour. All measurements were done using gray scale only for both the perpendicular to the floor and the perpendicular to the uterine contour techniques.
We provided summary statistics of the study population with frequencies and percentages for categorical measures; whereas, means and standard deviations (SDs) were derived for continuous measures. For skewed data, we reported the median, 25th, and 75th percentiles. Initially, for both AFI and SDP, Pearson’s correlation coefficient was used to assess the association between estimated AFV determined by transducer perpendicular to the floor versus transducer perpendicular to the uterine contour. Given the emphases on the degree of concordance between the two techniques of calculating AFI and SDP, we derived the intra-class correlation coefficient (ICC) to assess agreement. Koo and Li noted that the degree of agreement that exists based on ICC is as follows: <0.5 (poor), 0.5–0.75 (moderate), 0.75–0.90 (good), >0.90 (excellent). Additionally, we used the Bland-Altman plot to provide a quantitative estimate of how closely the values from the two techniques lie. The Bland-Altman plot was used to estimate agreement through a scatter plot of the difference between measurements taken by transducer perpendicular to the floor versus transducer perpendicular to the uterine contour (Y-axis) against the average of the two measurements (X-axis). This is simply a graphical representation of bias with 95% limits of agreement.
Results
We collected AFI and SDP information for 160 women who underwent fetal ultrasound examinations between 20 and 28 weeks gestational age. The average maternal age for our overall study population was approximately 28 years old (SD = 6.39) and a little over half of the mothers were White (see Table 1). The mean AFI based on the measurements taken by transducer perpendicular to the floor was 15.04 cm (SD = 3.15), while the mean AFI based on the technique with transducer perpendicular to the uterine contour was 17.05 cm (SD = 4.15). The SDP means based on transducer perpendicular to the floor compared to uterine contour were 5.11 cm (SD = 1.18) and 5.75 cm (SD = 1.38), respectively. The scatterplot in Figure 1 displays the level of association between estimates of AFI and SDP as measured by the two techniques (ie, floor vs uterine contour). The Pearson correlation coefficient for measurements taken perpendicular to the floor versus the uterine contour for AFI was 0.67 (95% CI: 0.57–0.74) and for SDP, the correlation was 0.47 (95% CI: 0.34–0.58).
 |
Table 1 Descriptive Statistics for Study Population (N = 160) |
 |
Table 2 Pearson’s Correlation Coefficient and Intra-Class Correlation Coefficient with Bootstrap Confidence Interval |
 |
Figure 1 Scatterplot of AFI and SDP estimates based on measures perpendicular to the floor versus uterine contour. |
Next, we present the ICCs for both estimates of AFV based on AFI and SDP. For AFI, the level of agreement between values based on transducer perpendicular to the floor and transducer perpendicular to the uterine contour was considered moderate (ICC = 0.56; bootstrap 95% CI: 0.49–0.63). Based on the guidelines described in Koo and Li (2016), the ICC of SDP was considered poor and the level of agreement was much lower compared to the AFI with ICC = 0.42 (bootstrap 95% CI: 0.31–0.52) (Table 2). Figure 2 represents the Bland-Altman plot for AFI with the representation of the limits of agreement. As noted previously, the limits are calculated by using the mean and the standard deviation of the differences between the measurements from the two techniques. For AFI, the average of the difference between the two techniques was −2.01 cm (dotted line below 0 in Figure 2). Because the mean difference was not zero, on average, estimating AFI with the transducer perpendicular to the uterine contour increased the measurement by 2.01 cm compared with the approach with the transducer perpendicular to the floor. Assuming that the differences followed a normal distribution, 95% of differences were between - 8.13 and 4.10 cm. Figure 3 displays the Bland-Altman plot for SDP. Here, the average mean difference was - 0.63 with the limits of agreement ranging from −3.25 cm to 1.98 cm.
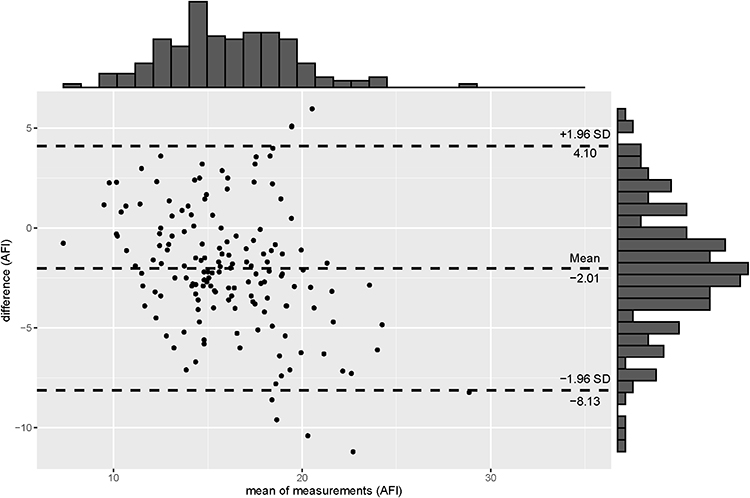 |
Figure 2 Bland-Altman plot for AFI, with the representation of the limits of agreements. |
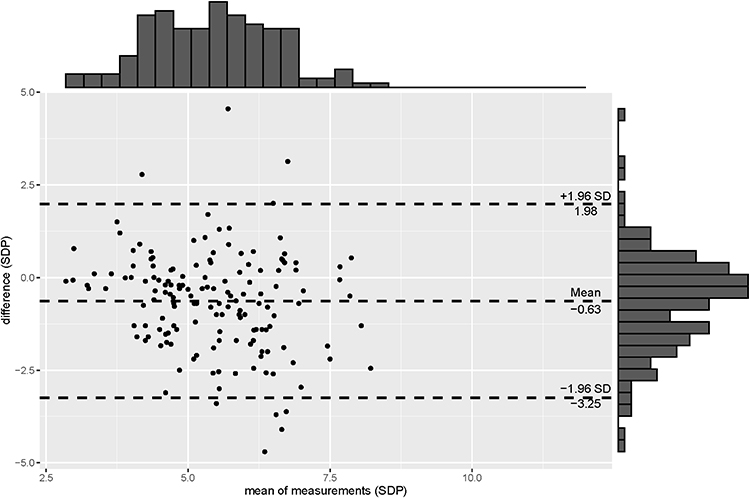 |
Figure 3 Bland-Altman plot for SDP, with the representation of the limits of agreements. |
Discussion
In the initial study (28–40 weeks),5 we evaluated the correlation between the AFI and SDP measured perpendicular to floor vs perpendicular to the uterine contour and found that the correlation was moderate, suggesting that either technique could be used to measure and estimate the amniotic fluid volume between 28 weeks and 40 weeks. In this follow-up study, we evaluated the AFI and SDP from 20 to 28 weeks comparing measurements done perpendicular to the floor and perpendicular to the uterine contour and observed that the correlation remained moderate for the AFI, but the correlation was poor for the SDP technique. In the current study; although the level of agreement based on the ICC for AFI was lower than the previous study,5 it remained a moderate level of agreement. In contrast, the level of agreement for SDP technique is poor, which decreased.
The only other study we identified that evaluated both US measurements of the AFI and SDP in which the ultrasound transducer was held perpendicular to the floor or perpendicular to the uterine contour was a study from Turkey.8 The investigators were comparing the subjective assessment, AFI, SDP and 2-diameter pocket measurements prior to cesarean delivery to the actual volumes measured at cesarean delivery. Unfortunately, the investigators did not correlate the ultrasound measurements by the technique used (perpendicular to the floor vs perpendicular to the uterine contour) when associating the ultrasound measurements to the actual volumes.
This study is limited because it only evaluated the measurement techniques in low-risk pregnancies and did not evaluate inter- and intra-observer variability during the study. The strength of this study is the number of pregnancies evaluated (20 at each gestational age between 20 and 28 weeks). Future studies would be needed to either correlate measurements perpendicular to the floor vs perpendicular to the uterine contour to dye-determined or actual measured amniotic fluid volumes at cesarean delivery in pregnancies at <28 weeks to determine which technique is more accurate in estimating the amniotic fluid volume, or associate those techniques with antepartum, intrapartum, or perinatal pregnancy outcomes to determine if the measurement should be perpendicular to the floor or to the uterine contour when measuring the SDP between 20 and 28 weeks.
Funding
There was no funding for this study.
Disclosure
JRW is a military service member. This work was prepared as part of her official duties. Title 17 U.S.C. 105 provides that “Copyright protection under this title is not available for any work of the United States government.” Title 17 U.S.C. 101 defines a United States government work as a work prepared by a military service member or employee of the United States government as part of that person’s official duties. EM wrote the chapter on ultrasound assessment of Amniotic Fluid volume Oligohydramnios for UptoDate. The authors report no other conflicts of interest in this work.
References
1. American College of Obstetricians and Gynecologists. Ultrasound in Pregnancy. Washington, DC: American College of Obstetricians and Gynecologists; 2016.
2. American College of Obstetricians and Gynecologists. Antepartum Fetal Surveillance. Washington, DC: American College of Obstetricians and Gynecologists; 2014.
3. Rutherford SE, Phelan JP, Smith CV, et al. The four-quadrant assessment of amniotic fluid volume: an adjunct to antepartum fetal heart rate testing. Obstet Gynecol. 1987;70:353–356.
4. Moore TR, Cayle JE. The amniotic fluid index in normal human pregnancy. Am J Obstet Gynecol. 1990;162(5):1168–1173. doi:10.1016/0002-9378(90)90009-V
5. Owen J, Albert PS, Buck Louis GM. A contemporary amniotic fluid volume chart for the United States: the NICHD fetal growth studies-singletons. Am J Obstet Gynecol. 2019;221(1):
6. Chamberlain PF, Manning FA, Morrison I, et al. Ultrasound evaluation of amniotic fluid volume. I. The relationship of marginal and decreased amniotic fluid volumes to perinatal outcome. Am J Obstet Gynecol. 1984;150:245–249. doi:10.1016/S0002-9378(84)90359-4
7. Hughes DS, Whittington JR, Kim H, Gunderman B, Ounpraseuth S, Magann EF. Is there a difference in sonographic estimation of amniotic fluid volume when measuring with the probe perpendicular to the floor compared with perpendicular to the uterine contour? J Obstet Gynaecol Can. 2019;41(9):1295–1301. doi:10.1016/j.jogc.2019.01.017
8. Madendag Y, Madendag IC, Sahin E, Aydin E, Sahin ME, Acmaz G. How well do the popular ultrasonic techniques estimate amniotic fluid volume and diagnose oligohydramnios, in fact? Ultrasound Q. 2019;35(1):35–38. doi:10.1097/RUQ.0000000000000408
 © 2021 The Author(s). This work is published and licensed by Dove Medical Press Limited. The
full terms of this license are available at https://www.dovepress.com/terms
and incorporate the Creative Commons Attribution
- Non Commercial (unported, 3.0) License.
By accessing the work you hereby accept the Terms. Non-commercial uses of the work are permitted
without any further permission from Dove Medical Press Limited, provided the work is properly
attributed. For permission for commercial use of this work, please see paragraphs 4.2 and 5 of our Terms.
© 2021 The Author(s). This work is published and licensed by Dove Medical Press Limited. The
full terms of this license are available at https://www.dovepress.com/terms
and incorporate the Creative Commons Attribution
- Non Commercial (unported, 3.0) License.
By accessing the work you hereby accept the Terms. Non-commercial uses of the work are permitted
without any further permission from Dove Medical Press Limited, provided the work is properly
attributed. For permission for commercial use of this work, please see paragraphs 4.2 and 5 of our Terms.