Back to Journals » Neuropsychiatric Disease and Treatment » Volume 12
Altered intra- and interregional synchronization in relapsing–remitting multiple sclerosis: a resting-state fMRI study
Authors Wu L, Zhang Y, Zhou F ![]() , Gao L
, Gao L ![]() , He L, Zeng X
, He L, Zeng X ![]() , Gong H
, Gong H
Received 23 October 2015
Accepted for publication 11 January 2016
Published 15 April 2016 Volume 2016:12 Pages 853—862
DOI https://doi.org/10.2147/NDT.S98962
Checked for plagiarism Yes
Review by Single anonymous peer review
Peer reviewer comments 2
Editor who approved publication: Professor Wai Kwong Tang
Lin Wu,1,2,* Yue Zhang,3,* Fuqing Zhou,1,2,* Lei Gao,2 Laichang He,1,2 Xianjun Zeng,1,2 Honghan Gong1,2
1Department of Radiology, The First Affiliated Hospital, Nanchang University, 2Jiangxi Province Medical Imaging Research Institute, 3Department of Radiology, The Affiliated Hospital of Jiangxi University of Traditional Chinese Medicine, Nanchang, Jiangxi Province, People’s Republic of China
*These authors contributed equally to this work
Background and purpose: Neuroimaging studies of relapsing–remitting multiple sclerosis (RRMS) have found structural disconnection and large-scale neural network dysfunction. However, few studies have explored the local brain activity of RRMS patients in the resting state.
Patients and methods: In this study, regional homogeneity (ReHo) and resting-state functional connectivity (FC) were used to investigate intra- and interregional synchronized activity in 22 patients with RRMS and 22 matched healthy controls (HCs).
Results: Compared with HCs, patients with RRMS showed significantly decreased ReHo in the left insula and right caudate. Through further seed-based FC analysis, we found decreased FC between the left insula and left precentral gyrus in patients with RRMS compared with HCs, as well as increased FC between the right caudate and right dorsolateral prefrontal cortex. Pearson’s correlation analysis showed that a decreased ReHo value in the left insula was associated with an increased total white matter lesion loads (TWMLL) score (r=-0.594, P=0.004) or a worsened paced auditory serial addition test score (r=0.536, P=0.010). No other significant correlations were observed between the FC value (left insula - left precentral gyrus) and clinical scores (P=0.246–0.982). The ReHo value of the right caudate was negatively correlated with disease duration (r=-0.526, P=0.012) and with the TWMLL score (r=-0.596, P=0.003). Moreover, a positive correlation was observed between the FC value (right caudate - right dorsolateral prefrontal cortex) and the TWMLL score (r=0.523, P=0.012) or the modified fatigue impact scale-5 score (r=0.608, P=0.003).
Conclusion: Together, these findings suggest that the insula with regional dysfunction involves disconnection with sensorimotor regions, and demyelinating lesion-related intra- and interregional dysfunction in the caudate is associated with the impact of fatigue on cognitive control functions. Abnormal synchronization of intra- and interregional activity in the insula and caudate may play important roles in the pathology of RRMS.
Keywords: relapsing–remitting multiple sclerosis, functional MRI, resting state, regional homogeneity, functional connectivity, caudate, insula
Introduction
Multiple sclerosis (MS) is a chronic, inflammatory, demyelinating, and neurodegenerative disease of the central nervous system which is a common cause of progressive neurological deficits in young adults.1 Moreover, neurological symptoms including sensorimotor deficits, cognitive impairment, and fatigue2–4 in patients with MS affect a range of daily activities such as working, driving, and social integration.5 Nevertheless, the mechanisms of MS-related neurocognitive deficits and psychological health issues remain unknown. Diffuse white matter and gray matter lesions are widely believed to account for these neurocognitive problems and disabilities. Conventional magnetic resonance imaging (MRI) currently serves as an important diagnostic tool for MS, but it possesses shortcomings, including low sensitivity to gray matter lesions and diffuse white matter involvement, and a low ability to predict clinical status.6
Over the past two decades, advanced MRI techniques have enriched our understanding of the mechanisms underlying the structural and functional abnormalities that cause the neurological symptoms of MS. Together, cross-sectional and longitudinal studies have shown that gray matter atrophy occurs in the early stages of the disease,7 and is associated with clinical disability8 and cognitive deterioration.9,10 These studies have also shown that cortical atrophy preferentially affects the frontotemporal area in patients with relapsing–remitting MS (RRMS).11 In addition to the white matter abnormalities identified by conventional MRI, structural studies utilizing diffusion-tensor MRI have revealed abnormalities in normal-appearing white matter, cortex, and deep gray matter nuclei, particularly in the frontal and temporal regions, the motor strip, and the basal ganglia at the earliest stages of MS.12,13 These studies reported that these abnormalities had a more pronounced association with increased disease duration and neurologic impairments.12,13 Studies of resting-state functional MRI (rs-fMRI) have demonstrated the integrity of intra-network functional connectivity (FC) and changes in inter-network coupling in MS patients in the default mode network,14–16 sensorimotor network,17,18 and visual network.19 These findings suggest that functional disconnection parallels both structural damage and clinical impairment.
Regional homogeneity (ReHo) provides an approach to investigate the local synchronization of spontaneous activity within neighboring voxels in the resting state.20 Previous studies have demonstrated that ReHo has high test–retest reliability and neurobiological relevance, and it could serve as a neuroimaging marker to investigate the human brain function.21,22 ReHo analysis has been successfully used to detect brain dysfunction in many diseases, such as neuromyelitis optica,23 schizophrenia,24 depression,25 and autism.26 Dogonowski et al27 have shown a link between impaired regional integration in the cerebellum and general disability or ataxia using the ReHo method in MS. To the best of our knowledge, little is known about local functional homogeneity across the brain in MS. Furthermore, it is unclear whether such changes simply imply an abnormal local synchronization of low-frequency blood oxygenation level dependent (BOLD) signals reflective of abnormal metabolic activity or a successive relationship. FC is provided as a statistical correlation coefficient of BOLD signal coherence between remote brain regions and can help to further clarify this issue.
In this study, we hypothesized that regional function and subserving interregional connectivity networks would be affected by abnormal local functional homogeneity in RRMS. To test this hypothesis, we collected rs-fMRI data from patients with RRMS and compared the data from the RRMS group with data from healthy controls (HCs) to examine both intraregional synchronized activity (ie, ReHo) and interregional synchronized activity (ie, FC) within the whole brain in RRMS. We also predicted that RRMS patients would show abnormal brain activity associated with clinical marks. This study may enrich our understanding of the neural underpinnings of RRMS.
Materials and methods
Participants
Twenty-two MS patients (9 males, 13 females; mean age: 44.6 [range: 21–57] years) were recruited from the Department of Neurology of the First Affiliated Hospital of Nanchang University, according to McDonald’s criteria.28 The inclusion criteria for the patients were as follows: 1) presenting with a relapsing–remitting course29 and 2) no clinical relapse symptoms occurring during scanning. The exclusion criteria were as follows: 1) an Expanded Disability Status Scale score >2.5 (corresponding to minimal disability),30 2) treatment with immunomodulatory medication, and 3) any brain lesions attributed to tumor or stroke, as assessed on the basis of medical history or MRI.
In addition, we recruited 22 age- and sex-matched healthy subjects to form a control group. All of the subjects self-reported as right-handed. This study was conducted in accordance with the Declaration of Helsinki. The study protocol was approved by the Institutional Review Board of the First Affiliated Hospital of Nanchang University. Written informed consent was obtained from each subject prior to the study.
Data acquisition
All MR images were obtained on a 3.0 T MR scanner (Trio Tim; Siemens Medical Systems, Erlangen, Germany). Foam pads and earplugs were used to reduce head motion and scanner noise, respectively. T2-weighted images, three-dimensional T1-weighted images, and rs-fMRI images were acquired using the following sequences: 1) T2-weighted turbo spin-echo imaging (repetition time [TR]/echo time [TE] =5,100/117 ms, number of excitations =3, echo train length =11, matrix =416×416, field of view [FOV] =240×240 mm, slice =22, slice thickness =6.5 mm, orientation = axial); 2) three-dimensional T1-weighted imaging (TR/TE =1,900/2.26 ms, number of excitations =1, matrix =240×256, FOV =215×230 mm, slices =176, slice thickness =1.0 mm, orientation = sagittal); and 3) rs-fMRI scan using a standard T2*-weighted gradient echo sequence with the following parameters: TR/TE =2,000/30 ms, flip angle =90°, FOV =200×200 mm, matrix =64×64, 30 interleaved axial slices with 4 mm thickness with an interslice gap of 1.2 mm, number of time points =240. During the fMRI scanning, subjects were instructed to keep their eyes closed, not to think about anything in particular, and not to fall asleep.
Data preprocessing
All rs-fMRI data were processed using Statistical Parametric Mapping (SPM8, Welcome Trust Centre for Neuroimaging, London, UK) and Data Processing Assistant for Resting-State fMRI Advanced Edition V2.2 (DPARSFA; Chinese Academy of Sciences, Beijing, People’s Republic of China). For each subject, we discarded the first ten volumes to avoid the possible effects of scanner instability and the adaptation of subjects to the scanner environment. The preprocessing steps included slice timing to correct within-scan acquisition time differences between slices, realignment to the first volume to correct head motion (a six-parameter spatial transformation), spatial normalization to the Montreal Neurological Institute template using a six-parameter spatial transformation, and resampling images into a spatial resolution of 3×3×3 mm3. We then performed signal linear detrending and voxelwise temporal bandpass filtering (0.01–0.08 Hz), and subsequently regressed out the nuisance covariates, including eight covariates (ie, signals from white matter and CSF, as well as six head motion parameters).
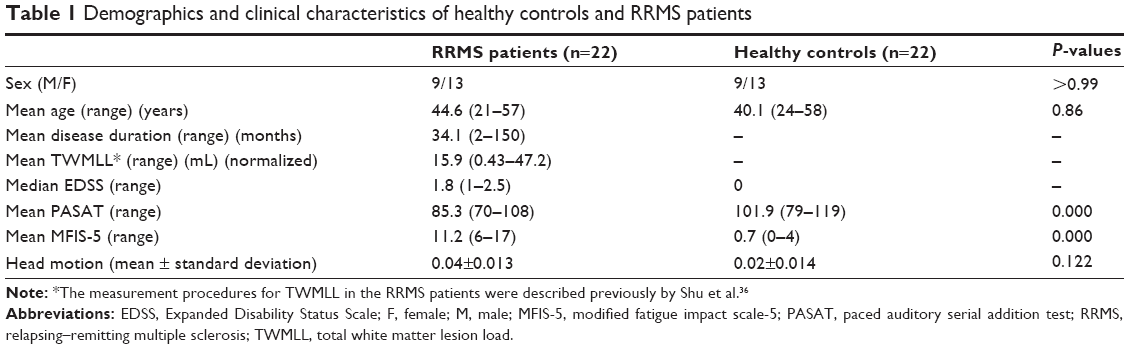
Recent studies31–33 have indicated that head motion can significantly influence the results derived from rs-fMRI. So, we computed the voxel-specific framewise displacement (FDvox) for each subject by using the DPARSF toolbox as described in a previous study.34 Using two-sample t-tests, we estimated the mean FDvox across all subjects and found no significant group difference (report in Table 1). In this study, we excluded subjects for further analysis if the translation or rotation of head movement was greater than 2 mm or 2° in any direction.
 | Table 1 Demographics and clinical characteristics of healthy controls and RRMS patients |
ReHo analysis
rs-fMRI data without spatial smoothing were used for ReHo analysis with DPARSFA.35 Kendall’s coefficient of concordance was calculated to measure the local synchronization of 27 nearest neighboring voxels with Equation 1,20 and the ReHo value was assigned to the central voxel. Then, a ReHo map was obtained in a voxelwise manner. Thus, each individual ReHo map was generated. A standardized ReHo map was created by dividing every individual ReHo map by each participant’s global mean Kendall’s coefficient concordance value within the brain mask. Finally, the standardized ReHo maps were spatially smoothed using a Gaussian kernel (full width at half maximum) of 4 mm. Notably, spatial smoothing before ReHo calculation dramatically increased the ReHo value.35
|
|
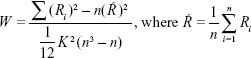
Where W is the Kendall’s coefficient concordance for a given voxel, ranging from 0 to 1; Ri is the sum rank of the ith time point; K is the number of time series within a measured cluster (27, one given voxel plus the number of its neighbors); n is the number of ranks (n=230 time points).
FC analysis
A seed-based correlation approach was used for FC analysis. The seed was defined in the difference regions of the ReHo analysis. FC analysis was performed using the data resulting from preprocessing. We calculated the temporal correlation between the seed region and every other voxel within the brain. We used eight nuisance covariates: the six head motion parameters, a white matter time course, and a cerebrospinal fluid time course. Fisher’s z transformation was used to improve the normality of the correlation coefficients, and the resulting correlation coefficients were transformed into z values. All of the above procedures were executed using DPARSFA software.
Statistical analysis
Statistical analysis was performed using the software Statistical Package for the Social Sciences Version 17.0 (SPSS Inc., Chicago, IL, USA) for demographic and clinical data and SPM8 for fMRI data. Age and sex were included as covariates in the present and following statistical analysis of functional data. An independent two-sample t-test was performed on the standardized ReHo and FC maps using SPM8 software. ReHo and FC were reported at a two-tailed voxelwise significance level threshold of P<0.01 and cluster level of P<0.05 with Gaussian Random Field (GRF) correction. We used Pearson’s correlation analysis to assess the relationship between the rs-fMRI measurements (ie, ReHo values and the strength of FC from the connections indicating significant group differences) and the clinical presentation of the subjects. The statistical significance level was set at P<0.05 (uncorrection).
Results
Demographic and clinical data
Table 1 provides the demographic information of the RRMS patients and HCs, and demonstrates the clinical features of RRMS patients. The two groups displayed no significant differences in age, sex, or handedness.
Decreased ReHo in RRMS patients
Compared with HCs, RRMS patients showed decreased ReHo in the left insula (Brodmann Area [BA] 13) and right caudate. No significant increase in ReHo was observed. Table 2 and Figure 1 show the group differences in ReHo between RRMS patients and HCs (voxel-level P<0.01, cluster-level P<0.05, GRF correction).
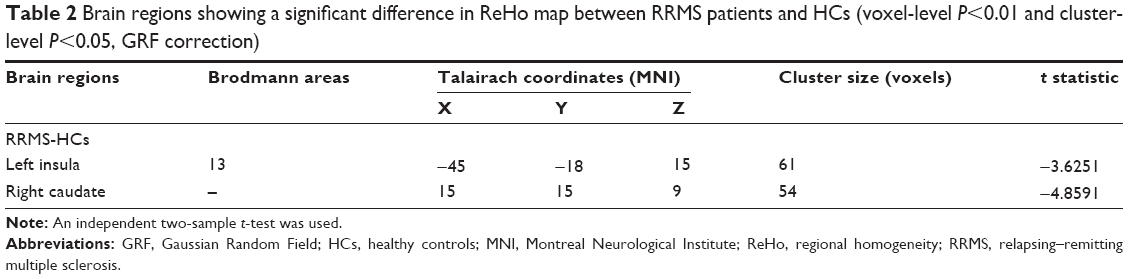 | Table 2 Brain regions showing a significant difference in ReHo map between RRMS patients and HCs (voxel-level P<0.01 and cluster-level P<0.05, GRF correction) |
 | Figure 1 Group differences in ReHo between RRMS patients and HCs (voxel-level P<0.01, cluster-level P<0.05, GRF correction). |
Seed-based FC of altered ReHo regions
Based on group comparison in ReHo, the left insula and right caudate were selected as seed regions of interest for FC analysis. Consequently, we found decreased FC between the left insula and left precentral gyrus (lPreCG) (BA6) in patients with RRMS compared with HCs, while we observed increased FC between the right caudate and right dorsolateral prefrontal cortex (rDLPFC) (BA9) in patients (voxel-level P<0.01, cluster-level P<0.05, GRF correction) (Table 3 and Figure 2).
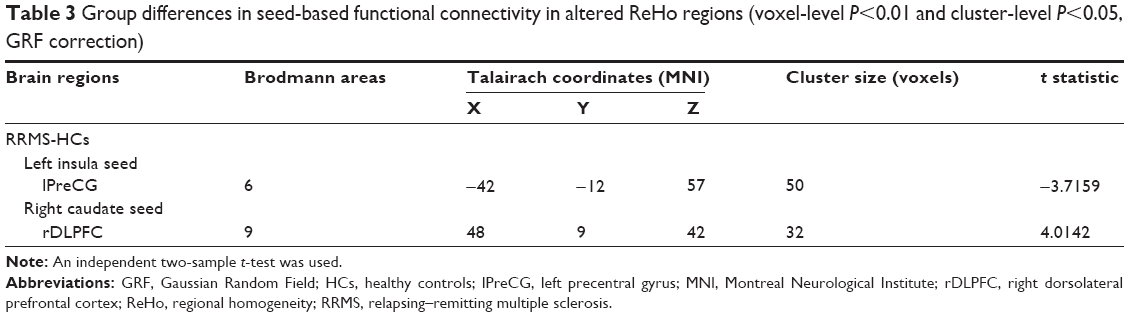 | Table 3 Group differences in seed-based functional connectivity in altered ReHo regions (voxel-level P<0.01 and cluster-level P<0.05, GRF correction) |
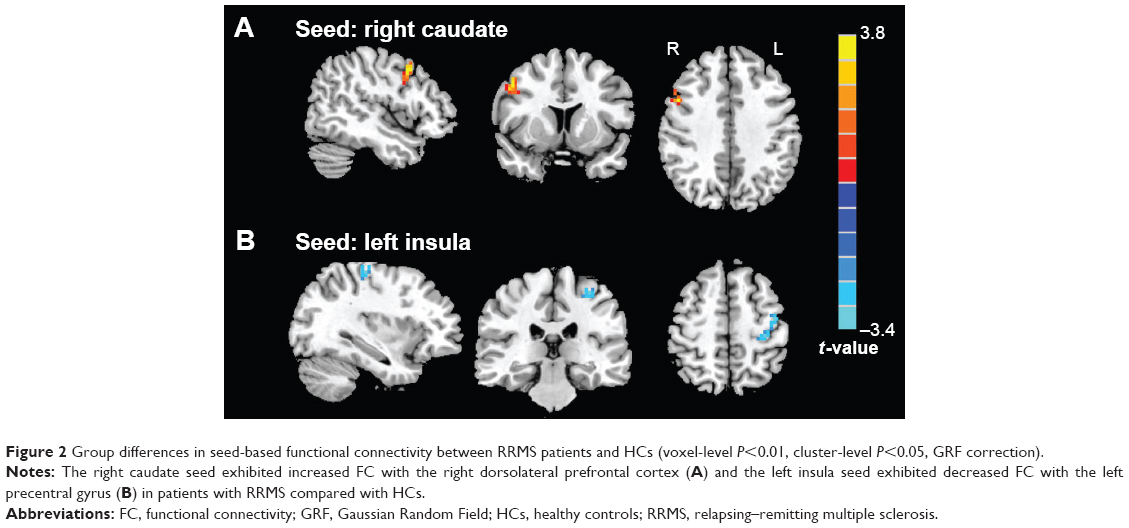 | Figure 2 Group differences in seed-based functional connectivity between RRMS patients and HCs (voxel-level P<0.01, cluster-level P<0.05, GRF correction). |
Correlations between ReHo/FC and clinical variables
We found that a decreased ReHo in the left insula was negatively correlated with total white matter lesion loads (TWMLL) score (Figure 3A), while it was positively correlated with paced auditory serial addition test (PASAT) score (Figure 3B). We found that a decreased ReHo in the right caudate was negatively correlated with TWMLL score (Figure 3C) and disease duration score (Figure 3D). No other significant correlations were identified between altered ReHo and the other clinical scores assessed. A positive correlation was observed between the intensity of FC (right caudate - rDLPFC) and TWMLL score (Figure 3E) or modified fatigue impact scale-5 (MFIS-5) score (Figure 3F). No other significant correlations were identified between the intensity of FC (left insula - lPreCG) and the clinical scores assessed (Table 4).
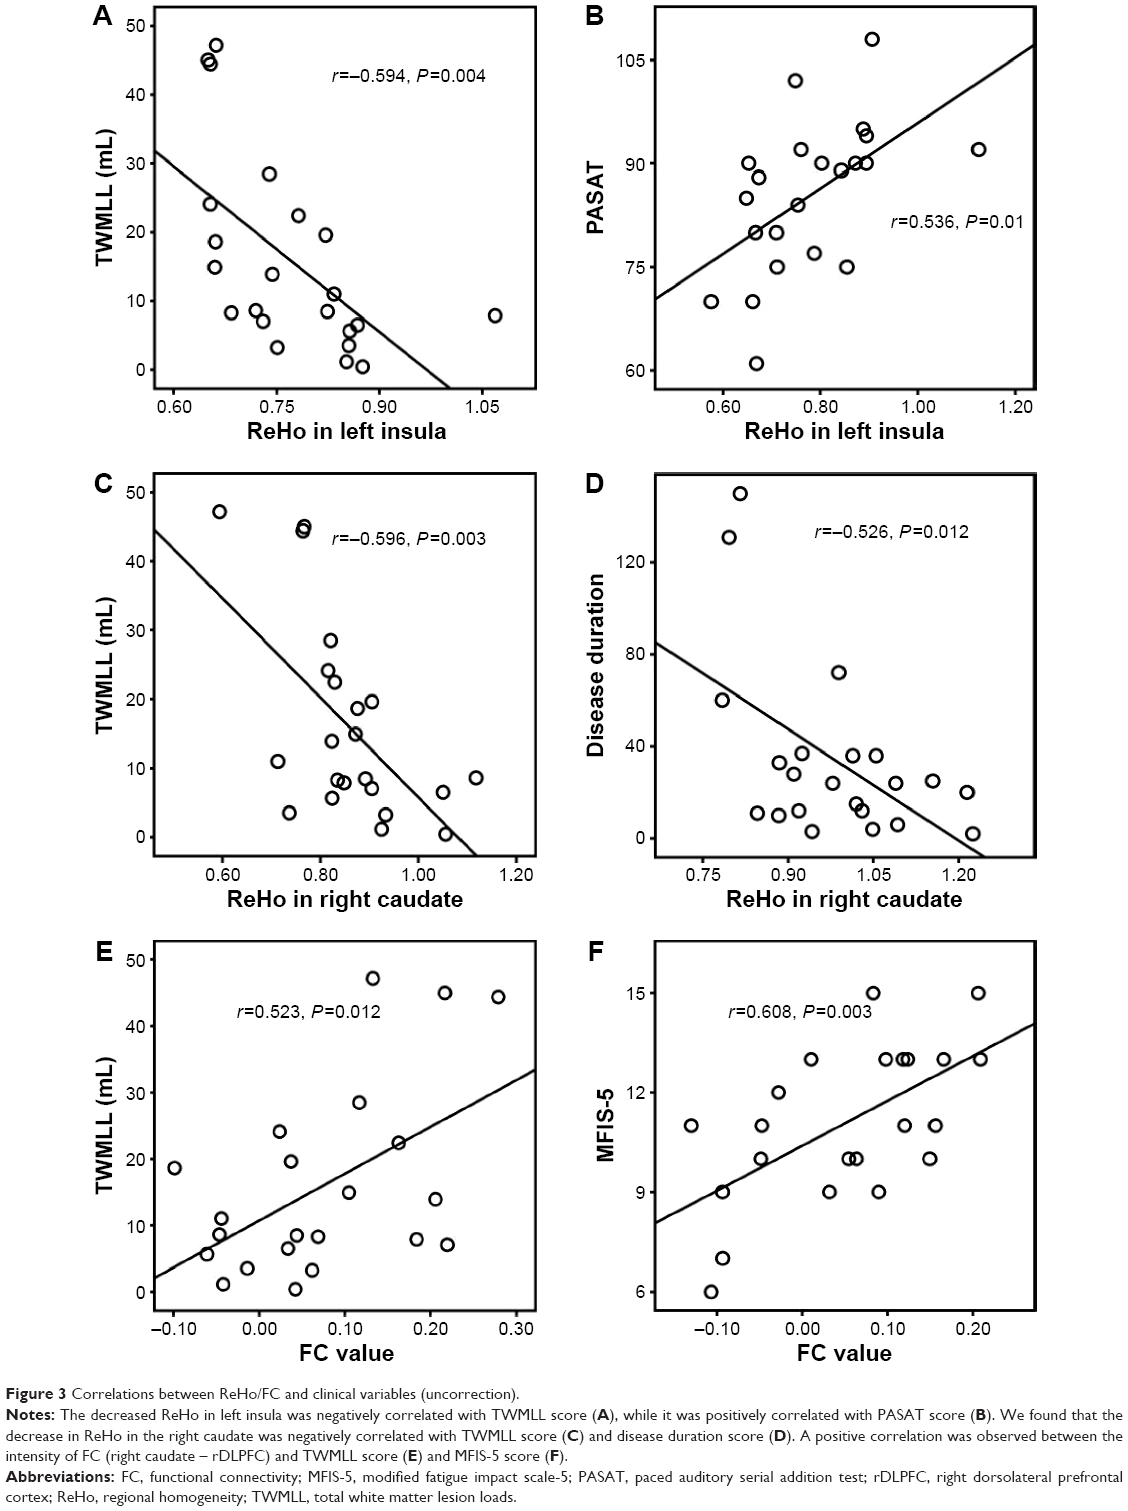 | Figure 3 Correlations between ReHo/FC and clinical variables (uncorrection). |
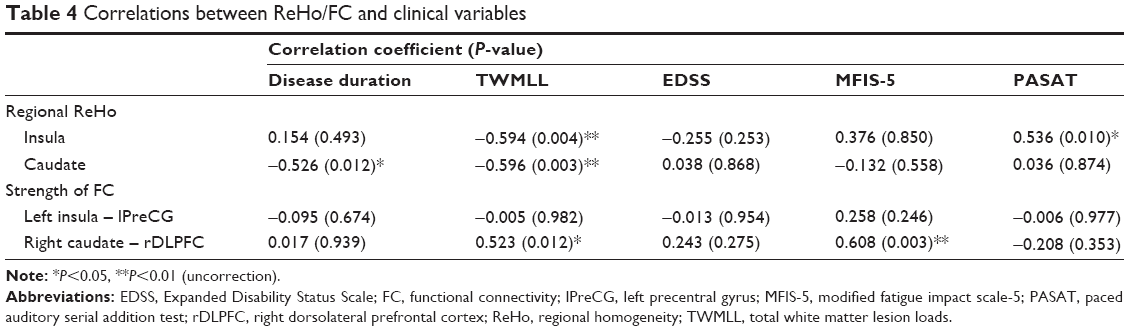 | Table 4 Correlations between ReHo/FC and clinical variables |
Discussion
In this study, the RRMS group presented a specifically decreased ReHo in the left insula and right caudate. Furthermore, the left insula showed decreased FC with the lPreCG, while the right caudate showed increased FC with the dorsolateral prefrontal cortex in patients with RRMS. We also identified an association between ReHo/FC and clinical variables such as lesion load (TWMLL) and PASAT in patients with RRMS. This evidence for local functional homogeneity and interregional FC contributes to our understanding of MS-related changes under neuropsychiatric conditions.
Decreased intraregional synchronized activity (ReHo) in RRMS
Our study found decreased ReHo in the left insula and right caudate in RRMS patients. ReHo is defined by the temporal coherence or synchronization of the BOLD time series between a given voxel and its nearest neighboring voxels,20,37 and can be interpreted as an index of network centrality to characterize the importance of the node in the human brain connectome by its local functional interactions.37 Decreased ReHo may suggest a disease-related dysfunction caused by dysregulation over a short distance.
In this study, we observed a decreased ReHo in the left insula. The insula plays roles in sensorimotor function, emotion, and decision making38 as well as high-level cognitive processing,39,40 and is a hub of the salience network.41 The insula comprises anterior and posterior sections: the anterior insula is specifically sensitive to salient environmental events,41 while the posterior insula is involved in somatosensory–vestibular interactions.42,43 Moreover, decreased ReHo in left insula was positively correlated with PASAT score, which provides further evidence supporting a role for insula in high-level cognitive processing. Charil et al44 have found that a relationship between TWMLL score and cortical loss in the insula was present in MS patients. Brain structure is considered to be the basis of function; our results show that decreased ReHo in the left insula is negatively correlated with TWMLL score, which corroborates this dogma.
The caudate is an important region involved in movement planning and execution45 and is the main input node of the basal ganglia circuitry that receives glutamatergic fibers from the sensorimotor cortex.46 Moreover, the caudate is linked to the neural networks underlying affective and cognitive function.45,47 In the current study, we detected decreased ReHo in the right caudate in patients with RRMS. These findings are consistent with previous reports that found abnormalities in caudate structure48,49 and function50,51 in patients with MS. In this study, abnormal ReHo in the caudate might reflect changes in somatosensory, motor, and cognitive functions in RRMS patients. Moreover, the ReHo of the right caudate was negatively correlated with RRMS duration and TWMLL score, indicating that the state of the right caudate may be a marker for the progression of RRMS. The decreased regional coherence in the left insula and right caudate is consistent with the reduced functional activation and structural abnormality reported in previous literature.38–51
Abnormal interregional synchronized activity (FC) in RRMS
To clarify how regional coherence affects interregional connectivity, we investigated the FC between regions with altered ReHo (left insula and right caudate) and other brain regions.
We observed decreased FC between the left insula and the lPreCG in patients with RRMS, which suggested dysfunction in the insula-related motor network. Structural studies have demonstrated that the insula plays the role of the so-called “rich club” within the connectomes to form the basis of its central communication.52–54 Rs-fMRI studies also found that connections between the insula cortex and both the pre- and post-central cortex were mainly associated with the functional integration of somatosensory, motor, and auditory information.55,56 He et al57 suggest that the decreased network efficiency in MS might reflect the disrupted functional neuronal organization of spatially distributed cortical regions as well as disruptions in the integrity of large-scale interconnected brain systems. In our study, the FC value between the left insula and lPreCG was found to be unassociated with clinical variables. Therefore, our interpretation of the current abnormal FC data in RRMS is cautious.
Connectivity between the rDLPFC and right caudate has been associated with increased restricted and repetitive behaviors that involve frontostriatal circuitry.58 Also, few studies have found that increased FC might represent a neural mechanism to compensate for disease-induced dysfunction.59,60 In the current study, we found that increased FC between the right caudate and rDLPFC positively correlated with TWMLL or MFIS-5 score. MS lesions are predominantly located in the white matter and, therefore, mainly affect axonal conduction. We suggest that FC between the right caudate and rDLPFC may be affected by MS lesions. The fatigue-related MFIS-5 scale is an abbreviated version used to assess the impact of fatigue on physical, cognitive, and psychosocial functioning. Finke et al61 found that fatigue severity was correlated with FC of basal ganglia nuclei (ie, reduction in caudate volume) with medial prefrontal cortex, precuneus, and motor cortex. Fatigue is associated with distinct alterations of basal ganglia FC independent of overall disability. In our view, the association of the caudate with interregional hyperconnectivity acts to compensate for fatigue on cognitive control functions.
Interestingly, we observed a laterality alteration in interregional FC with altered ReHo regions (left insula and right caudate). There are two possible explanations: 1) disruption of anatomic connectivity of the corpus callosum in MS may affect the interhemispheric functional connecting interactions62 and 2) compensatory functional reorganization ensues in both subcortical and cortical synchronization in the absence of corpus callosum.63 In our study, we speculate that increased FC between the right caudate and rDLPFC may present compensatory function. In addition, compensatory functional reorganization as a complex and slow evolutionary fashion remains in need of further study to evaluate a specific functional pathway to explain decreased FC between the left insula and lPreCG.
Limitations
Certain MS lesions disrupted corresponding white matter pathways, which likely resulted in altered FC between gray matter regions and caused clinical impairment. However, cortical reorganization could improve the clinical symptoms caused by structural damage.60 In future studies, the effects of lesion location should be considered when investigating the functional–structural–clinical relationships involved in MS. Second, decreased FC between the insula and PreCG subserving sensorimotor dysfunction in RRMS was found in our study. Future studies should be designed to include a scale to measure motor function in order to obtain more information about the mechanism of motor impairment. Our study involved Pearson’s correlation analysis for correlations between clinical data and neurocognitive metrics rather than multiple comparisons analysis, which should be applied in further studies.
Conclusion
This study suggests that RRMS patients present regional dysfunctions in the insula and caudate and decreased FC of the insula subserving sensorimotor dysfunction, and demyelinating lesion-related intra- and interregional dysfunction in the caudate is associated with the impact of fatigue on cognitive control functions. The alteration of intra- and interregional activity in the insula and caudate may play an important role in the pathology of RRMS.
Acknowledgments
This study was supported by the National Science Foundation of China (Grant Nos 81101041, 81260217, 81460263, 81560284), the Science and Technology Support Program of Jiangxi, People’s Republic of China (No 20151BBG70224), the Science and Technology Project of Jiangxi Provincial Health and Family Planning Commission (Grant No 20143071), and the “Gan Po” engineering excellence 555 project of Jiangxi Province. The authors thank their patients and volunteers for participating in this study. They also thank the anonymous reviewers for their constructive suggestions to improve this work.
Disclosure
The authors report no conflicts of interest in this work.
References
Brück W. The pathology of multiple sclerosis is the result of focal inflammatory demyelination with axonal damage. J Neurol. 2005;252 Suppl 5:v3–v9. | ||
Guimarães J, Sá MJ. Cognitive dysfunction in multiple sclerosis. Front Neurol. 2012;3:74. | ||
Bakshi R. Fatigue associated with multiple sclerosis: diagnosis, impact and management. Mult Scler. 2003;9(3):219–227. | ||
Pantano P, Mainero C, Lenzi D, et al. A longitudinal fMRI study on motor activity in patients with multiple sclerosis. Brain. 2005;128(Pt 9):2146–2153. | ||
Filippi M, Riccitelli G, Mattioli F, et al. Multiple sclerosis effects of cognitive rehabilitation on structural and functional MR imaging measures-an explorative study. Radiology. 2012;262(3):932–940. | ||
Lövblad KO, Anzalone N, Dörfler A, et al. MR imaging in multiple sclerosis: review and recommendations for current practice. AJNR Am J Neuroradiol. 2010;31(6):983–989. | ||
Chard DT, Griffin CM, Parker GJ, Kapoor R, Thompson AJ, Miller DH. Brain atrophy in clinically early relapsing-remitting multiple sclerosis. Brain. 2002;125(Pt 2):327–337. | ||
Prinster A, Quarantelli M, Lanzillo R, et al. A voxel-based morphometry study of disease severity correlates in relapsing-remitting multiple sclerosis. Mult Scler. 2010;16(1):45–54. | ||
Benedict RH, Bruce JM, Dwyer MG, et al. Neocortical atrophy, third ventricular width, and cognitive dysfunction in multiple sclerosis. Arch Neurol. 2006;63(9):1301–1306. | ||
Amato MP, Portaccio E, Goretti B, et al. Association of neocortical volume changes with cognitive deterioration in relapsing-remitting multiple sclerosis. Arch Neurol. 2007;64(8):1157–1167. | ||
Bendfeldt K, Kappos L, Radue EW, Borgwardt SJ. Progression of gray matter atrophy and its association with white matter lesions in relapsing-remitting multiple sclerosis. J Neurol Sci. 2009;285(1–2):268–269. | ||
Li Y, Jewells V, Kim M, et al. Diffusion tensor imaging based network analysis detects alterations of neuroconnectivity in patients with clinically early relapsing-remitting multiple sclerosis. Hum Brain Mapp. 2013;34(12):3376–3391. | ||
Rovaris M, Agosta F, Pagani E, Filippi M. Diffusion tensor MR imaging. Neuroimaging Clin N Am. 2009;19(1):37–43. | ||
Hawellek DJ, Hipp JF, Lewis CM, Corbetta M, Engel AK. Increased functional connectivity indicates the severity of cognitive impairment in multiple sclerosis. Proc Natl Acad Sci U S A. 2011;108(47):19066–19071. | ||
Zhou F, Zhuang Y, Gong H, et al. Altered inter-subregion connectivity of the default mode network in relapsing remitting multiple sclerosis: a functional and structural connectivity study. PLoS One. 2014;9(7):e101198. | ||
Rocca MA, Absinta M, Valsasina P, et al. Abnormal connectivity of the sensorimotor network in patients with MS: a multicenter fMRI study. Hum Brain Mapp. 2009;30(8):2412–2425. | ||
Ceccarelli A, Rocca MA, Valsasina P, et al. Structural and functional magnetic resonance imaging correlates of motor network dysfunction in primary progressive multiple sclerosis. Eur J Neurosci. 2010;31(7):1273–1280. | ||
Roosendaal SD, Schoonheim MM, Hulst HE, et al. Resting state networks change in clinically isolated syndrome. Brain. 2010;133(Pt 6):1612–1621. | ||
Tewarie P, Schoonheim MM, Stam CJ, et al. Cognitive and clinical dysfunction, altered MEG resting-state networks and thalamic atrophy in multiple sclerosis. PLoS One. 2013;8(7):e69318. | ||
Zang Y, Jiang T, Lu Y, He Y, Tian L. Regional homogeneity approach to fMRI data analysis. Neuroimage. 2004;22(1):394–400. | ||
Jiang L, Xu T, He Y, et al. Toward neurobiological characterization of functional homogeneity in the human cortex: regional variation, morphological association and functional covariance network organization. Brain Struct Funct. 2015;220(5):2485–2507. | ||
Zuo XN, Xu T, Jiang L, et al. Toward reliable characterization of functional homogeneity in the human brain: preprocessing, scan duration, imaging resolution and computational space. Neuroimage. 2013;65:374–386. | ||
Liang P, Liu Y, Jia X, et al. Regional homogeneity changes in patients with neuromyelitis optica revealed by resting-state functional MRI. Clin Neurophysiol. 2011;122(1):121–127. | ||
Liu H, Liu Z, Liang M, et al. Decreased regional homogeneity in schizophrenia: a resting state functional magnetic resonance imaging study. Neuroreport. 2006;1(17):19–22. | ||
Yao Z, Wang L, Lu Q, Liu H, Teng G. Regional homogeneity in depression and its relationship with separate depressive symptom clusters: a resting-state fMRI study. J Affect Disord. 2009;115(3):430–438. | ||
Paakki JJ, Rahko J, Long X, et al. Alterations in regional homogeneity of resting-state brain activity in autism spectrum disorders. Brain Res. 2010;1321:169–179. | ||
Dogonowski AM, Andersen KW, Madsen KH, et al. Multiple sclerosis impairs regional functional connectivity in the cerebellum. Neuroimage Clin. 2014;4:130–138. | ||
Polman CH, Reingold SC, Banwell B, et al. Diagnostic criteria for multiple sclerosis: 2010 revisions to the McDonald criteria. Ann Neurol. 2011;69(2):292–302. | ||
Hurwitz BJ. The diagnosis of multiple sclerosis and the clinical subtypes. Ann Indian Acad Neurol. 2009;12(4):226–230. | ||
Kurtzke JF. Historical and clinical perspectives of the expanded disability status scale. Neuroepidemiology. 2008;31(1):1–9. | ||
Van Dijk KR, Sabuncu MR, Buckner RL. The influence of head motion on intrinsic functional connectivity MRI. Neuroimage. 2012;59(1):431–438. | ||
Yan CG, Craddock RC, He Y, Milham MP. Addressing head motion dependencies for small-world topologies in functional connectomics. Front Hum Neurosci. 2013;7:910. | ||
Power JD, Barnes KA, Snyder AZ, Schlaggar BL, Petersen SE. Spurious but systematic correlations in functional connectivity MRI networks arise from subject motion. Neuroimage. 2012;59(3):2142–2154. | ||
Yan CG, Cheung B, Kelly C, et al. A comprehensive assessment of regional variation in the impact of head micromovements on functional connectomics. Neuroimage. 2013;76:183–201. | ||
Chao-Gan Y, Yu-Feng Z. DPARSF: A MATLAB toolbox for “pipeline” data analysis of resting-state fMRI. Front Syst Neurosci. 2010;4:13. | ||
Shu N, Liu Y, Li K, et al. Diffusion tensor tractography reveals disrupted topological efficiency in white matter structural networks in multiple sclerosis. Cereb Cortex. 2011;21(11):2565–2577. | ||
Jiang L, Zuo XN. Regional homogeneity: A multimodal, multiscale neuroimaging marker of the human connectome. Neuroscientist. Epub 2015 Jul 13. | ||
Scott TR. Insular cortex as a mediator of emotion: commentary on emotion and decision-making explained, by Edmund T. Rolls. Cortex. 2014;59:206–207. | ||
Wang X, Fan Y, Zhao F, et al. Altered regional and circuit resting-state activity associated with unilateral hearing loss. PLoS One. 2014;9(5):e96126. | ||
Fang W, Lv F, Luo T, et al. Abnormal regional homogeneity in patients with essential tremor revealed by resting-state functional MRI. PLoS One. 2013;8(7):e69199. | ||
Menon V, Uddin LQ. Saliency, switching, attention and control: a network model of insula function. Brain Struct Funct. 2010;214(5–6):655–667. | ||
Hashimoto T, Taoka M, Obayashi S, Hara Y, Tanaka M, Iriki A. Modulation of cortical vestibular processing by somatosensory inputs in the posterior insula. Brain Inj. 2013;27(13–14):1685–1691. | ||
Cera N, Tartaro A, Sensi SL. Modafinil alters intrinsic functional connectivity of the right posterior insula: a pharmacological resting state fMRI study. PLoS One. 2014;9(9):e107145. | ||
Charil A, Dagher A, Lerch JP, Zijdenbos AP, Worsley KJ, Evans AC. Focal cortical atrophy in multiple sclerosis: relation to lesion load and disability. Neuroimage. 2007;34(2):509–517. | ||
Robinson JL, Laird AR, Glahn DC, et al. The functional connectivity of the human caudate: an application of meta-analytic connectivity modeling with behavioral filtering. Neuroimage. 2012;60(1):117–129. | ||
Loitfelder M, Fazekas F, Koschutnig K, et al. Brain activity changes in cognitive networks in relapsing-remitting multiple sclerosis – insights from a longitudinal FMRI study. PLoS One. 2014;9(4):e93715. | ||
Di Martino A, Scheres A, Margulies DS, et al. Functional connectivity of human striatum: a resting state FMRI study. Cereb Cortex. 2008;18(12):2735–2747. | ||
Cavallari M, Ceccarelli A, Wang GY, et al. Microstructural changes in the striatum and their impact on motor and neuropsychological performance in patients with multiple sclerosis. PLoS One. 2014;9(7): e101199. | ||
Motl RW, Hubbard EA, Sreekumar N, et al. Pallidal and caudate volumes correlate with walking function in multiple sclerosis. J Neurol Sci. 2015;354(1–2):33–36. | ||
DeLuca J, Genova HM, Hillary FG, Wylie G. Neural correlates of cognitive fatigue in multiple sclerosis using functional MRI. J Neurol Sci. 2008;270(1–2):28–39. | ||
Nebel K, Wiese H, Seyfarth J, et al. Activity of attention related structures in multiple sclerosis patients. Brain Res. 2007;1151:150–160. | ||
van den Heuvel MP, Kahn RS, Goñi J, Sporns O. High-cost, high-capacity backbone for global brain communication. Proc Natl Acad Sci U S A. 2012;109(28):11372–11377. | ||
van den Heuvel MP, Sporns O. Rich-club organization of the human connectome. J Neurosci. 2011;31(44):15775–15786. | ||
Collin G, Sporns O, Mandl RC, van den Heuvel MP. Structural and functional aspects relating to cost and benefit of rich club organization in the human cerebral cortex. Cereb Cortex. 2014;24(9):2258–2267. | ||
He Y, Wang J, Wang L, et al. Uncovering intrinsic modular organization of spontaneous brain activity in humans. PLoS One. 2009;4(4):e5226. | ||
Meunier D, Achard S, Morcom A, Bullmore E. Age-related changes in modular organization of human brain functional networks. Neuroimage. 2009;44(3):715–723. | ||
He Y, Dagher A, Chen Z, et al. Impaired small-world efficiency in structural cortical networks in multiple sclerosis associated with white matter lesion load. Brain. 2009;132(Pt 12):3366–3379. | ||
Delmonte S, Gallagher L, O’Hanlon E, McGrath J, Balsters JH. Functional and structural connectivity of frontostriatal circuitry in autism spectrum disorder. Front Hum Neurosci. 2013;7:430. | ||
Zhou F, Gong H, Li F, et al. Altered motor network functional connectivity in amyotrophic lateral sclerosis: a resting-state functional magnetic resonance imaging study. Neuroreport. 2013;24(12):657–662. | ||
Zhou FQ, Tan YM, Wu L, Zhuang Y, He LC, Gong HH. Intrinsic functional plasticity of the sensory-motor network in patients with cervical spondylotic myelopathy. Sci Rep. 2015;5:9975. | ||
Finke C, Schlichting J, Papazoglou S, et al. Altered basal ganglia functional connectivity in multiple sclerosis patients with fatigue. Mult Scler. 2015;21(7):925–934. | ||
Zhou Y, Milham M, Zuo XN, et al. Functional homotopic changes in multiple sclerosis with resting-state functional MR imaging. AJNR Am J Neuroradiol. 2013;34(6):1180–1187. | ||
Cifelli A, Matthews PM. Cerebral plasticity in multiple sclerosis; insights from fMRI. Mult Scler. 2002;8(3):193–199. |
 © 2016 The Author(s). This work is published and licensed by Dove Medical Press Limited. The
full terms of this license are available at https://www.dovepress.com/terms
and incorporate the Creative Commons Attribution
- Non Commercial (unported, 3.0) License.
By accessing the work you hereby accept the Terms. Non-commercial uses of the work are permitted
without any further permission from Dove Medical Press Limited, provided the work is properly
attributed. For permission for commercial use of this work, please see paragraphs 4.2 and 5 of our Terms.
© 2016 The Author(s). This work is published and licensed by Dove Medical Press Limited. The
full terms of this license are available at https://www.dovepress.com/terms
and incorporate the Creative Commons Attribution
- Non Commercial (unported, 3.0) License.
By accessing the work you hereby accept the Terms. Non-commercial uses of the work are permitted
without any further permission from Dove Medical Press Limited, provided the work is properly
attributed. For permission for commercial use of this work, please see paragraphs 4.2 and 5 of our Terms.