Back to Archived Journals » Cell Health and Cytoskeleton » Volume 7
Alterations in cancer cell mechanical properties after fluid shear stress exposure: a micropipette aspiration study
Authors Chivukula V, Krog B, Nauseef J, Henry M, Vigmostad S
Received 28 July 2014
Accepted for publication 12 September 2014
Published 9 January 2015 Volume 2015:7 Pages 25—35
DOI https://doi.org/10.2147/CHC.S71852
Checked for plagiarism Yes
Review by Single anonymous peer review
Peer reviewer comments 4
Editor who approved publication: Professor Denis Wirtz
Venkat Keshav Chivukula,1 Benjamin L Krog,1,2 Jones T Nauseef,2 Michael D Henry,2 Sarah C Vigmostad1
1Department of Biomedical Engineering, 2Department of Molecular Physiology and Biophysics, Holden Comprehensive Cancer Center, University of Iowa, Seamans Center for the Engineering Arts and Sciences, Iowa City, IA, USA
Abstract: Over 90% of cancer deaths result not from primary tumor development, but from metastatic tumors that arise after cancer cells circulate to distal sites via the circulatory system. While it is known that metastasis is an inefficient process, the effect of hemodynamic parameters such as fluid shear stress (FSS) on the viability and efficacy of metastasis is not well understood. Recent work has shown that select cancer cells may be able to survive and possibly even adapt to FSS in vitro. The current research seeks to characterize the effect of FSS on the mechanical properties of suspended cancer cells in vitro. Nontransformed prostate epithelial cells (PrEC LH) and transformed prostate cancer cells (PC-3) were used in this study. The Young's modulus was determined using micropipette aspiration. We examined cells in suspension but not exposed to FSS (unsheared) and immediately after exposure to high (6,400 dyn/cm2) and low (510 dyn/cm2) FSS. The PrEC LH cells were ~140% stiffer than the PC-3 cells not exposed to FSS. Post-FSS exposure, there was an increase of ~77% in Young's modulus after exposure to high FSS and a ~47% increase in Young's modulus after exposure to low FSS for the PC-3 cells. There was no significant change in the Young's modulus of PrEC LH cells post-FSS exposure. Our findings indicate that cancer cells adapt to FSS, with an increased Young's modulus being one of the adaptive responses, and that this adaptation is specific only to PC-3 cells and is not seen in PrEC LH cells. Moreover, this adaptation appears to be graded in response to the magnitude of FSS experienced by the cancer cells. This is the first study investigating the effect of FSS on the mechanical properties of cancer cells in suspension, and may provide significant insights into the mechanism by which some select cancer cells may survive in the circulation, ultimately leading to metastasis at distal sites. Our findings suggest that biomechanical analysis of cancer cells could aid in identifying and diagnosing cancer in the future.
Keywords: cancer, metastasis, fluid shear stress, micropipette aspiration, elastic modulus
Introduction
Cancer is a lethal disease often due to its ability to spread (metastasize) to secondary locations through the process of metastasis. Over 90% of cancer deaths are due to metastasis rather than primary tumor growth.1 Once a cancer is initiated at a primary site, various mechanisms are set into motion that lead to its growth, proliferation, and ultimate spread to secondary locations. The major steps in cancer metastasis are as follows: a tumor grows at a primary site; new blood vessels are created to supply nutrients to the tumor (angiogenesis); detachment of cancer cells from the primary tumor and invasion of the cells into the blood circulation and lymphatic circulation; spread of cancer cells to various parts of the body through the aforementioned circulatory systems; adherence or lodging of the circulating tumor cells in the lumen of the circulatory vessels in preparation for extravasation; extravasation of the tumor cells to secondary sites; and establishment of a viable microenvironment to support tumor growth at the secondary sites.2 While tumors at primary sites are generally treated using chemotherapy and targeted therapies, the onset of metastasis makes the disease very difficult to treat.1–4 Metastasis is known to be an inefficient process where a small percentage of the cancer cells that enter the circulation successfully form new tumors; the harsh hemodynamic environment is thought to mechanically destroy some cancer cells and thereby contribute to metastatic inefficiency. Specifically, fluid shear stress (FSS) is considered to be an important factor that influences circulating tumor cells.1,2,5–7 In their paper, Wirtz et al state that shear flow influences circulating tumor cells; however, very little is known about the effect of shear flow on the viability and proliferation of circulating tumor cells.1 One of the aims of this research was to investigate the effect of FSS on the mechanical properties of cancer cells. As described briefly in a paper on the force journey of a cancer cell, the authors5 mention that the cancer cell is subjected to FSS among other forces when in the circulation. This exposure of a new set of mechanical forces hitherto unknown by the cancer cell could possibly effect a change in the mechanical and biochemical properties of the cell. Basson and Thamilselvan investigated the effect of nonlaminar shear stress on the adhesive ability of cancer cells and found that shear stress and turbulence may stimulate the adhesion of malignant cells shed by colon cancers by a mechanism that requires both actin-cytoskeletal reorganization and independent physical force activation of Src kinase.8 The same research group also investigated the effect of pressure on the adhesion of cancer cells and noticed similar behavior.9 A similar study undertaken by Haier et al also found that FSS can enhance activation of focal adhesion kinase in colon carcinoma cells, thereby leading to increased adhesion of those cells.10 A recent study by our group found a biphasic loss of cell viability in transformed cells, but not immortalized, nontransformed epithelial cells, when exposed to repeated brief pulses of high level FSS.11 In that study, the data indicated that cancer cells may “adapt” to a fluid shear environment, thereby increasing survival upon repeated exposure to FSS. This brings to light an important point that mechanical stimuli leads to mechanical changes in the cell structure which in turn dictate the behavior of the cell.
In recent years, biomechanical properties of cells, especially cell deformability and elasticity, have been linked to disease.12–15 Multiple methods to investigate mechanical properties for cells have been developed, such as atomic force microscopy (AFM), optical tweezers, and micropipette aspiration.14,16
In AFM,17,18 the cell surface is depressed (indented) by a probe that moves with a constant velocity, thereby providing an increasing force. This force is proportional to the deflection of a beam that is very stiff when compared with the apparent stiffness of the cell that is being deformed. This method is usually restricted to measuring forces around 50 pN; however, advancement of technology is enabling the application of larger forces.
Using optical tweezers (also known as optical trap), a small bead is captured in an optical trap (laser beam) which is then made to contact a cell surface. Once contacted, the bead is made to move slowly away from its initial position using the laser, thereby extending the surface of the cell where contact has been made.19,20 The force of extension is measured by the deflection of the bead in the trap based on its location from the optical axis. The optical tweezers method is very complicated to implement and is quite unstable with respect to bead positioning and laser positioning.
Micropipette aspiration was developed by Mitchison and Swan in 1950 to measure the elastic properties of sea urchin eggs and has become popular due to its versatility, range of applicable forces, and relative simplicity.21,22 In micropipette aspiration, a micropipette is manipulated toward a cell, usually in suspension, and a small suction pressure is applied, partially aspirating the cell inside the micropipette. Upon increasing the suction pressure, the cell deforms and either completely flows into the micropipette or increases the length of projection of the aspirated portion. This deformation is then analyzed to determine the elastic property of the cell, ie, Young’s modulus. The micropipette aspiration technique can be used to apply forces over a range of three orders of magnitude from 10 pN to 1 nN.23 Micropipette aspiration has been extensively used by researchers to study the mechanical properties of various cells, including the red cell membrane,22 chondrocytes,24 neutrophils,25 and others. Cancer cell mechanical properties have been studied thus far primarily using AFM. Studies by Cross et al,26,27 Rebelo et al,28 and Faria et al29 found that metastatic cancer cells were softer than benign cells, with a standard deviation of elastic moduli for cancer cells far smaller than that of benign cells. However, the effect of fluid shear on the mechanical properties of cancer cells is still poorly understood.
Previous work by our group determined that cancer cells adapt to FSS.11 The physiological ranges of FSS varies from ~15 dyn/cm2 in the bulk arterial circulation to as much as 3,000 dyn/cm2 during turbulent flow in the heart, near the walls of large vessels and vessel bifurcations, and localized shear from cell–cell interactions.30,31 The current study seeks to characterize the effect of FSS on the mechanical properties of cancer cells. Specifically, we seek to determine if cancer cells can change their mechanical properties when exposed to FSS and if the change (if present) is a cancer cell-only phenomenon. To this end, we designed a micropipette aspiration procedure/experiment to examine the effects on FSS on the elasticity, ie, Young’s modulus of cells.
As mentioned above, micropipette aspiration enables the application of a wide range of forces on a cell. More importantly, micropipette aspiration also possesses the advantage of being able to measure the properties of cells in suspension, which is uniquely suited to the task of investigating the effect of FSS on cancer cells undergoing metastasis. This is unlike most other methods which require the cell to be adhered to a substratum. Due to the simplicity and the ability to measure the properties of cells in suspension, the micropipette aspiration technique was chosen for investigating the effect of fluid shear on the mechanical properties of cancer cells.
Materials and methods
Cells
Transformed prostate cancer cells (PC-3) and immortalized, nontransformed prostate epithelial cells (PrEC LH) were used in this study. The cancer cell line was obtained from American Type Culture Collection (Manassas, VA, USA) and cultured in the recommended prescribed manner. The nontransformed prostate epithelial cells were obtained from Dr William Hahn of the Dana-Farber Cancer Institute (Boston, MA, USA) and cultured as recommended. More details can be found in our previous work.11
Fluid shear stress exposure
The FSS exposure protocol used is described in detail in our previous work.11 Briefly, a dilute suspension of cells of concentration up to 5×10⁵ cells/mL was slowly filled into a syringe and then passed through a 30 G needle (average internal radius 7.94×10⁻³ cm). A syringe pump (Harvard Apparatus PHD-2000 Infuse/withdraw pump) was used to achieve controlled flow rates in the needle of 20 μL/sec (“low shear”) and 250 μL/sec (“high shear”). The cell suspension was passed through the needle up to ten times. The volume fraction of the cell suspension was <0.2%, thereby facilitating the use of Poiseuille flow relationships in order to estimate the FSS. Based on Poiseuille’s equation,
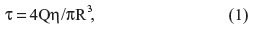
where τ is the wall shear stress in dyn/cm2, Q is the flow rate in cm3/sec, η is the dynamic viscosity of the medium (0.01 dyn-s/cm2), and R is the radius of the needle, the maximum shear stress occurs at the wall of the needle. The maximum FSS was 510 dyn/cm2 for the low shear case and 6,400 dyn/cm2 for the high shear case. According to Poiseuille’s relationship, the minimum FSS occurs at the center of the needle and is proportional to the radius of the cells. The minimum FSS experienced by the cells was ~800 dyn/cm2 for the high shear case. The flow rates and corresponding FSS values and transit times through the needle are shown in Table 1, and a schematic of the FSS exposure experiment is shown in Figure 1A.
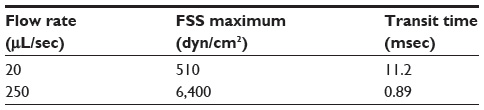 | Table 1 Maximum FSS and transit times through the 30 G needle at the flow rates used in the current study |
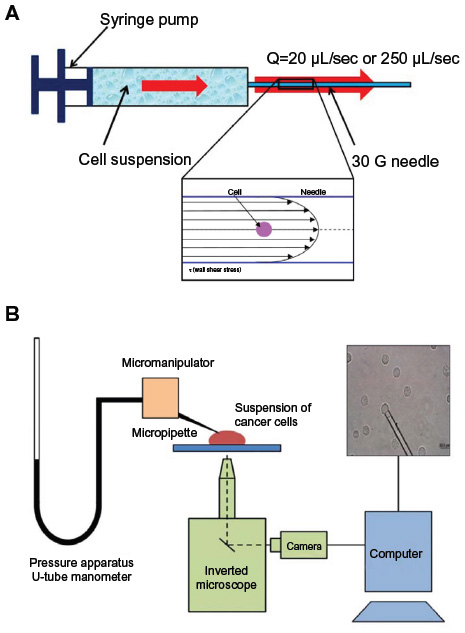 | Figure 1 Schematic of experimental apparatus to perform fluid shear stress exposure and micropipette aspiration experiments. |
Micropipette aspiration
Micropipette aspiration apparatus
The apparatus used for the micropipette aspiration procedure consisted of a micropipette puller (Sutter Instruments P-97, Sutter Instruments, Novato, CA, USA), a microforge (Narishige MF-900, Narishige Group, Tokyo, Japan), a micromanipulator (Scientifica LBM-7, Scientifica, Sussex, UK), thin-walled glass capillaries (TW150-3, World Precision Instruments Incorporated, Sarasota, FL, USA), a microscope (Nikon TE-300, Nikon Corporation, Tokyo, Japan), and a camera (Stingray, Allied Vision Technologies GmbH, Stadtroda, Germany). Preliminary pipettes were pulled on the micropipette puller and cut using the microforge. The average internal diameter of the micropipette was approximately 5–8 μm. The micropipette was filled with the appropriate medium using a microfilling needle (MicroFil, World Precision Instruments Incorporated). Tygon® tubing connected the micropipette to a fluid reservoir mounted on a linear scale. The resolution of the linear scale used to change the height of the reservoir was 0.5 mm (4.9 Pa). The micropipette was maneuvered into position just above the cover glass on the microscope platform using the micromanipulator. A schematic of the experimental setup is shown in Figure 1B.
Micropipette aspiration experiments
Once the micropipette was positioned, a small sample of the cell suspension was deposited on the cover slip. All experiments were performed at room temperature. The pressure applied to the tip of the micropipette was controlled by raising and lowering the reservoir in reference to the height of the microscope stage. The tip of the micropipette was further positioned near a cell using the micromanipulator. A small suction pressure was used (~20 Pa) to attract a cell toward the micropipette (Figure 2A). Care was taken to ensure that the cell was completely suspended in the sample prior to starting the experiment. This methodology is in contrast with AFM where the cells are adherent to a slide during the measurements. Once a cell was attracted to the micropipette tip, the reservoir was lowered to apply increasing amounts of suction pressure at the tip of the micropipette, to aspirate a part of the cell inside the micropipette (Figure 2B). Suction pressures were applied in increments of ~50 Pa with typical maxima of ~300 Pa. Images were taken at regular intervals of ~4 minutes, noting the height of the reservoir (and thereby the applied suction pressure) for every cell. The suction pressures were increased until the aspirated portion of the cell began to lose coherence. The micropipette aspiration experiments were performed on cells in suspension in order to establish a reference (control) value of the Young’s modulus for comparison with the sheared cells.
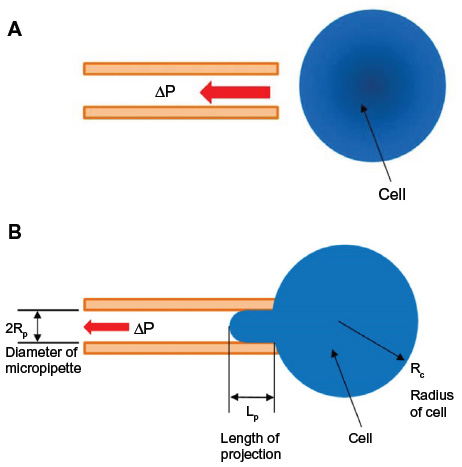 | Figure 2 Schematic of micropipette aspiration experiment. |
Deformation analysis to determine Young’s modulus
For each cell, images captured at several recorded suction pressures (ΔP) and the projection length (Lp) were analyzed using an elastic model first formulated in 1988 by Theret et al.32 The model can be used to determine the Young’s modulus of a cell based on the applied suction pressure and the length of projection of the cell inside the pipette (Figure 2B). Mathematically, the model is expressed as:
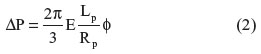
In Equation 2, E is the Young’s modulus for the homogeneous solid and φ is a term that depends on the ratio of the thickness of the pipette wall to the radius of the pipette; a typical value for φ~2.132 Lp is the length of projection of the cell into the pipette and Rp is the radius of the pipette. ΔP is the applied suction pressure. This simplified model has been used to study endothelial cells32 and to investigate chondrocytes.24 The Young’s modulus was obtained from the slope of the linear relationship between the suction pressure ΔP and the normalized projection length Lp/Rp.
Hochmuth classified cells into solid-like or liquid-like based on their behavior when aspirated into a micropipette.23 Based on the aforementioned classification, cells that “flowed” into the micropipette when the suction pressure was increased beyond a particular threshold were classified as liquid, ie, cells containing a liquid interior enclosed by a membrane. One of the parameters determined for liquid-like cells was the cortical tension of the membrane. Cells that did not flow into the micropipette when the suction pressure was increased but rather continued to elongate into the micropipette were classified as a solid, ie, having a homogeneous mechanical property. The key parameter for solid cells was the Young’s modulus calculated using Equation 2. Hochmuth also proposed a formula to calculate the equivalent cortical tension of a solid cell to compare against common liquid-like cells, such as red blood cells and neutrophils.23 Mathematically, the equivalent cortical tension for solid cells is calculated as:
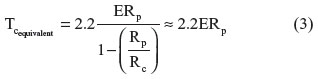
Using Equation 3, a value of cortical tension for a solid cell was calculated to compare the deformability with other cells classified as liquids and are present in the circulatory system, such as neutrophils.
Statistical analysis
The Young’s modulus and the equivalent cortical tension for both PC-3 and PrEC LH cells are presented in the format of mean ± standard deviation for all tests performed. An unpaired, two-tailed Student’s t-test was performed to determine whether the PC-3 and PrEC LH cells (or cells at rest and cells after FSS exposure) were significantly different.
Results
Young’s modulus calculation
The cancer cells exhibited solid-like behavior and hence the elastic model described in the Equation (2) was chosen for analysis.23 The images collected for the PC-3 and PrEC LH cells without FSS exposure were analyzed to determine the projection length Lp and the radius of the pipette Rp. A typical image sequence collected for an experiment is shown in Figure 3. Typical response curves for the projection length versus the applied suction pressure are shown in Figure 4. A linear relationship exists between the suction pressure ΔP and the projection length Lp.
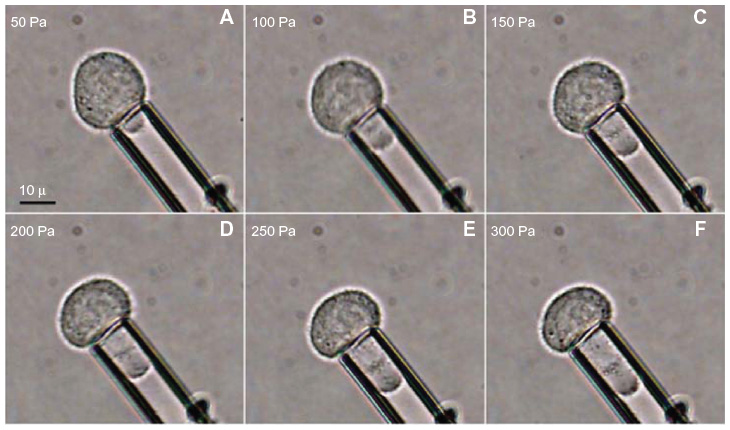 | Figure 3 Image sequence for a typical micropipette aspiration experiment (A–F). |
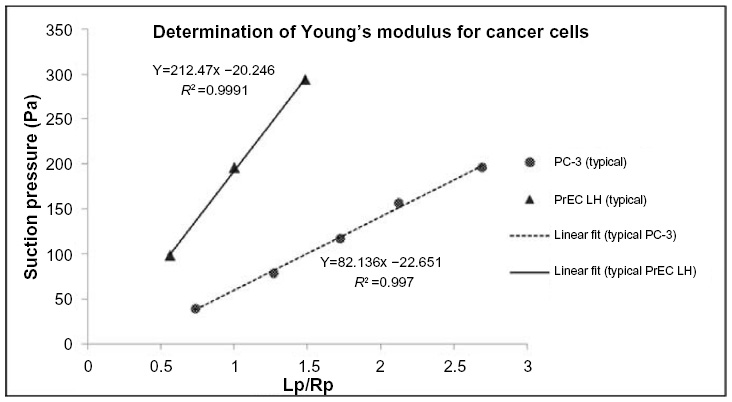 | Figure 4 Typical results for relationship of suction pressure and length of projection of the cell inside the pipette. |
Young’s modulus of cells in suspension (unexposed to FSS)
A suspension of PC-3 cells and PrEC LH cells were each prepared and tested for their respective mechanical properties at rest (ie, without FSS exposure). The Young’s moduli of the PC-3 and the PrEC LH cells were found to be 19.95±6.77 Pa (n=54) and 47.72±25.7 Pa (n=47), respectively.
Young’s modulus of cells after exposure to high shear
The transformed and nontransformed cells were exposed to the high flow rate (250 μL/sec), which was considered to be the high shear protocol. As mentioned above in the micropipette aspiration experiments section, the cell suspension was passed ten times through this syringe. The micropipette aspiration experiments were conducted immediately following the ten passes through the syringe at high FSS. The Young’s moduli for the PC-3 and PrEC LH cells after exposure to high FSS were determined to be 35.37±13.99 Pa (n=58) and 43.56±20.99 Pa (n=47), respectively. Figure 5 shows a comparison of the Young’s modulus measured for both cell types at rest and after high shear exposure.
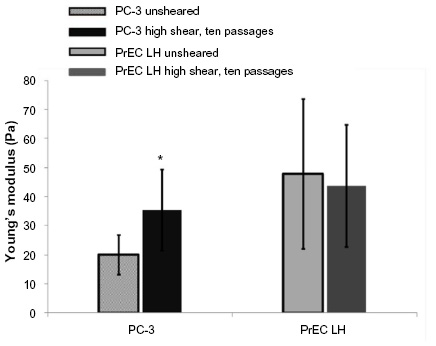 | Figure 5 Comparison of Young’s modulus for transformed prostate cancer cells (PC-3) and nontransformed prostate epithelial cells (PrEC LH) not exposed to FSS (unsheared) and after exposure to high FSS. |
Young’s modulus of cells after exposure to low shear
Transformed PC-3 cells were also subjected to ten passes at the previously described low flow rate (25 μL/sec), which was considered to be exposure to low shear, to determine whether any change in elastic modulus was evident after exposure to low FSS. The Young’s modulus for the PC-3 cells after exposure to low FSS was 29.25±10.49 Pa (n=45).
Young’s modulus of cells after single exposure to high shear
The FSS protocol included passing the suspension of cells through the syringe for ten passes. After observing the above results, an additional experiment was performed to examine how PC-3 cells responded after a single passage at high FSS. The Young’s modulus of PC-3 cells after a single passage at high FSS was found to be 27.49±10.14 Pa (n=45). A plot summarizing the Young’s moduli measured for PC-3 cells in response to various conditions is shown in Figure 6, and all the Young’s modulus measurements are tabulated in Table 2.
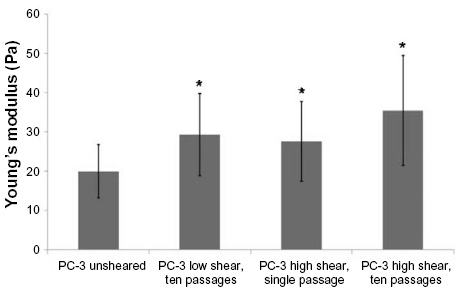 | Figure 6 Comparison of Young’s modulus for transformed prostate cancer cells (PC-3) not exposed to FSS (unsheared), after exposure to ten passages at high FSS, after exposure to ten passages at low FSS, and after exposure to a single pass at high FSS, respectively. There appears to be a graded response to the level of FSS that the cancer cells are exposed to. *P<0.05. |
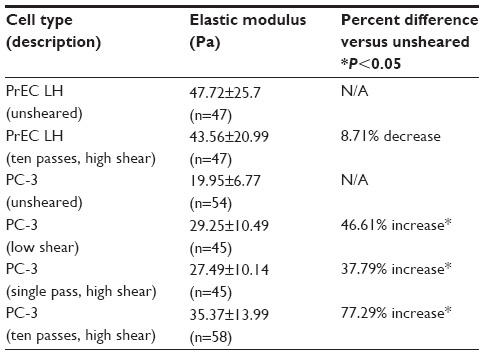 | Table 2 Young’s modulus for all cells considered in the current study exposed to various FSS levels |
Equivalent cortical tension
The equivalent cortical tension of all the cells under investigation was determined using Equation 3. The equivalent cortical tension for the unsheared PC-3 cells was 134.78±51.82 μN/m (n=54) and for the PC-3 cells exposed to ten passes at high shear was 213.71±102.65 μN/m (n=58). The equivalent cortical tension for the unsheared and high FSS-exposed PrEC LH cells was found to be 346.43±210.18 μN/m (n=47) and 300.82±158.34 μN/m (n=47), respectively. A summary of the results of all the aforementioned experiments for both PC-3 and PrEC LH cells are tabulated in Table 3.
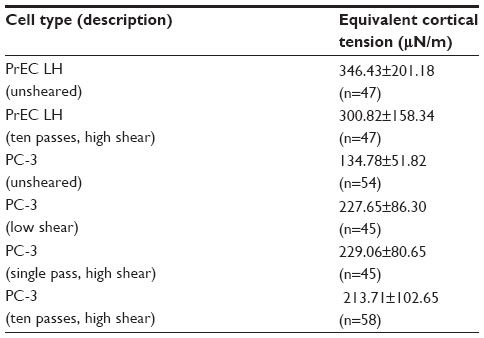 | Table 3 Equivalent cortical tension for all cells considered when exposed to various FSS levels |
Discussion
The micropipette aspiration technique was successfully applied to investigate the behavior of PC-3 cells and PrEC LH cells both at rest and after being exposed to FSS. The use of micropipette aspiration is important in that it is one of the few methods in which the mechanical properties of the cell can be investigated when the cell is in suspension. This is very pertinent to the current research, where the goal was to determine the effect of FSS on PC-3 cells during hematogenic metastasis as cells migrate from a primary tumor to a secondary site via the circulatory system. The range of FSS to which the PC-3 cells were exposed is the physiological range that can be expected in the systemic circulation.11,31 Moreover, the biphasic viability displayed by the PC cells indicates that they have an adaptive response to FSS exposure, while PrEC LH cells do not exhibit any such adaptations.
Our study found that the Young’s modulus of PrEC LH at rest was ~140% stiffer than for PC-3 cells, with the standard deviation of the PrEC LH cells being much wider than that for PC-3 cells. This is comparable with other studies that have used AFM to determine the Young’s modulus and found that nontransformed or benign cells were stiffer than transformed or metastatic cells and that the distribution of the nontransformed cells was larger that of the transformed cells.26–28,33,34 Interestingly, our data indicate that reduced stiffness may be an intrinsic property of transformed cells, and not dependent on their adhesion to a substratum.
Until now, the impact of FSS exposure on the mechanical properties of cancer cells has not been investigated. Using micropipette aspiration, we examined how FSS exposure impacts the cell’s mechanical property, ie, Young’s modulus of cells. We found that the average Young’s modulus of transformed (PC-3) cells exposed to high FSS for ten passages was significantly higher than for PC-3 cells at rest (35.37 Pa versus 19.95 Pa, respectively) corresponding to an increase of ~77% post high FSS exposure. After exposing the PC-3 cells to low FSS for ten passages, we found the average Young’s modulus to be ~47% higher than the resting value, ie, still significantly higher, but only half that of the cells exposed to high FSS. The Young’s modulus of the PC-3 cells after exposure to a single passage at high FSS was found to be very similar to the Young’s modulus after ten passages at low FSS. This indicates that the PC-3 cells seem to display a graded response to the magnitude of FSS. The change in stiffness of the PC-3 cells was dependent on the level of FSS exposure, with increasing exposure resulting in a higher Young’s modulus. In contrast, there was no significant change in the Young’s modulus of PrEC LH cells upon shear exposure, indicating that the stiffening is a phenomenon only present in transformed cells.
Interestingly, previous work showed that the change in viability of PC-3 cells after exposure to FSS was shear-dependent,11 so that at low FSS exposure, most of the PC-3 cells (~90%) survived after ten passages through the syringe, whereas at high FSS exposure only ~55% of cells were still viable after ten passages. In addition, the survival and Young’s modulus of PC-3 cells after one passage at high FSS (corresponding to a flow rate of 250 μL/sec) were similar to the survival and Young’s modulus of PC-3 cells after ten passages at low FSS (corresponding to a flow rate of 20 μL/sec). One implication of our finding in the current work is that the degree of stiffness per se is not an absolute determinant of resistance to FSS; PrEC LH cells are stiffer than PC-3 cells, yet less viable in the face of FSS. This implies that either there is an optimal level of stiffness to survive FSS exposure between the Young’s modulus values for FSS-naïve PC-3 and PrEC LH cells, and/or that other mechanisms influence the survival of cancer cells in response to FSS.
The flow rates used for the low FSS were about one-tenth that of the flow rates used for the high shear runs. Interestingly, the Young’s modulus for the PC-3 cells exposed to ten passes at low shear overlap very closely with the Young’s modulus for the PC-3 cells exposed to one pass at high shear. These results have led us to propose that PC-3 cells exhibit not only an acquired response (in the form of a change in Young’s modulus) to FSS, but that the response is cumulative based on the magnitude and exposure time of FSS. While the results from the studies on the change in Young’s modulus as a function of exposure to FSS presented here support this hypothesis,11 additional investigation is necessary to support this.
The histogram of the Young’s modulus of the PC-3 in Figure 7 indicates a much wider range of Young’s modulus measurements for the PC-3 cells exposed to FSS as opposed to the resting group. Based on the aforementioned hypothesis in which the magnitude of FSS, coupled with exposure time, is responsible for the higher Young’s modulus after FSS exposure, this broad range of measurements may be explained in several ways. One possibility is that not all of the cells are exposed to the same magnitude of FSS upon passage through the needle, a result of the likely parabolic (Poiseuille) flow profile, and thus cells traveling through the needle near the needle wall would experience the maximum FSS, while cells nearer to the center of the needle are exposed to the lowest FSS. While flow is expected to be laminar, cells that are passed ten times are likely to be exposed to a different FSS magnitude during each passage. It could be that there is a minimum level of FSS exposure necessary to elicit changes in Young’s modulus. Another possibility could be that different cells adapt at different rates, based on genetic heterogeneity or a physiological parameter such as cell cycle progression, leading to an uneven response to FSS. However, our prior study indicated that neither pre-existing genetic heterogeneity nor differences in the cell cycle profile made a substantial contribution to FSS resistance.11
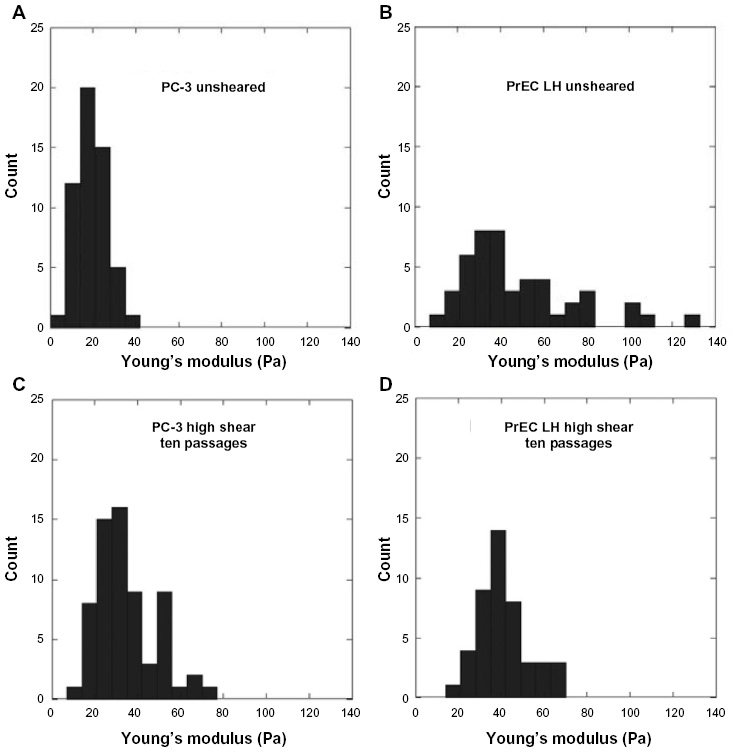 | Figure 7 Comparison of histogram of Young’s modulus for unexposed (unsheared) and sheared PC-3 and PrEC LH cells (A–D). |
Because of their behavior during aspiration, cancer cells, much like chondrocytes and endothelial cells, are classified not as membrane-contained liquids but instead as homogeneous solids. This distinction can most easily be made when the cell is aspirated beyond one radius of the pipette inner diameter, where the aspirated portion of the cell forms a hemispherical shape within the pipette.23 When the suction pressure increases beyond this point, “liquid” cells will flow into the pipette. However, as can be seen in Figure 3, the cancer cells instead continue to resist suction beyond this point, hence the solid classification was adopted. In addition to measuring the cells’ Young’s modulus, the equivalent cortical tension for these cells was calculated, based on Hochmuth’s calculations for cells treated like homogeneous elastic solids.23 This provides a means to compare the deformability against more fluid-like cells. The cortical tension for the PC-3 cells at rest was almost four times that of neutrophils.25 As the PC-3 cells stiffened upon FSS exposure, the cortical tension of PC-3 cells after high FSS exposure was almost six times that of a neutrophil. The cortical tension of the PrEC LH cells was almost ten times that of neutrophils, both before and after FSS exposure. Endothelial cells, on the other hand, have a cortical tension ~100 times greater than neutrophils, indicating that both of the prostatic epithelial cell types currently under investigation exhibit equivalent cortical tension values within the range of physiologic, solid-like cells that have been studied in the past.24,32 Since one goal of this work is to understand how these cells behave during hematogenous metastasis, the values of cortical tension obtained in this study could shed light on how PC-3 cells behave in the circulation in comparison with other circulating cells like neutrophils and red blood cells.
It has been recognized that not all the cancer cells that enter the bloodstream will actually contribute toward metastatic growth.35 This metastatic inefficiency coupled with the death of a majority of the circulating tumor cells within a few hours of entering the circulation has been a well documented phenomenon.2,35–37 It is also known that cancer cells undergo extensive modifications in their cytoskeleton prior to intravasation into the circulatory system.38–40 In their review on the physics of cancer metastasis, Wirtz et al point out that FSS is a possible factor influencing the distal metastasis site.1 However, they acknowledge that information regarding the behavior of cancer cells in response to FSS is still extremely limited. The current study, in combination with past work by our group, seeks to add to the limited body of literature around fluid stresses and their impact on cancer cells in the bloodstream.11 Nevertheless, many questions still remain unanswered, such as the cellular mechanism responsible for changes in cell stiffness, which is the focus of ongoing investigation.
Conclusion
The current study is the first to investigate the effect of FSS on the mechanical properties of cancer cells using the micropipette aspiration technique. The importance of this technique is underscored by the fact that during metastasis, cancer cells enter the circulation and are in a suspended state until they extravasate to a secondary site. Thus, the findings of this study are highly relevant to cancer metastasis. We have determined that PC-3 cells exhibit a change in stiffness after FSS exposure. Moreover, this stiffness appears to be a function of the FSS magnitude and exposure time (ie, single pass versus ten passages). We have also shown that this change in stiffness in response to FSS exposure appears to be limited to cancer cells, as the nontransformed cells did not exhibit any difference in Young’s modulus after FSS exposure. This observation, coupled with our earlier studies on cell viability, indicate that PrEC LH cells, while sensitive to FSS, do not change in response to the shear environment.11 As reported previously, PC-3 cells exhibit a biphasic viability, in which they become increasingly resistant to FSS exposure upon repeated passages through the syringe.11 This indicates that the ability of PC-3 cells to change their mechanical properties in response to FSS is either a protective mechanism or the byproduct of a protective mechanism unique to transformed cells. While further studies need to be performed to determine how, specifically, these cells are increasing in stiffness, in the long-term this observation could have important clinical implications, either as a diagnostic tool or for targeted therapeutics.
The circulatory system is an unusual environment for epithelial cancer cells where they are exposed to FSS in a manner unlike in their tissue of origin.5 Our study sought to investigate the effect of FSS on the mechanical properties of cancer cells by subjecting them to FSS ranging from 500 dyn/cm2 to 6,400 dyn/cm2. While the average or bulk FSS in a typical arterial circulation is ~15 dyn/cm2, the local FSS can be as high as 3,000 dyn/cm2 near the walls of large vessels, turbulent blood flow, near the presence of mechanical prostheses and in the proximity of atherosclerotic plaque build-up.30,31 Our study found that PC-3 cells adapt to FSS by becoming ~77% stiffer after exposure to FSS. While the stiffening of cells could be one of the manifestations of a cellular level response to FSS, this could enable the survival of a select few cancer cells which then go on to metastasize. Thus, our study on elastic property change could represent a new direction in diagnosing cancer metastasis, along with other mechanical properties such as viscoelasticity.28
Acknowledgments
This research was supported by grants from the American Cancer Society (77-004-31 to SCV, and W81XWH-12-1-0163 and R21 CA160470 to MDH).
Disclosure
The authors report no conflicts of interest in this work.
References
Wirtz D, Konstantopoulos K, Searson PC. The physics of cancer: the role of physical interactions and mechanical forces in metastasis. Nat Rev Cancer. 2011;11(7):512–522. | |
Fidler I. The pathogenesis of cancer metastasis: the “seed and soil” hypothesis revisited. Nat Rev Cancer. 2003;3(6):453–458. | |
Mitchell MJ, King MR. Physical biology in cancer. 3. The role of cell glycocalyx in vascular transport of circulating tumor cells. Am J Physiol Cell Physiol. 2014;306(2):C89–C97. | |
Chaffer CL, Weinberg RA. A perspective on cancer cell metastasis. Science. 2011;331(6024):1559–1564. | |
Kumar S, Weaver VM. Mechanics, malignancy, and metastasis: the force journey of a tumor cell. Cancer Metastasis Rev. 2009;28(1–2):113–127. | |
Weiss L. Metastasis of cancer: a conceptual history from antiquity to the 1990s. Cancer Metastasis Rev. 2000;19(3–4):I–XI, 193–383. | |
Steeg P. Tumor metastasis: mechanistic insights and clinical challenges. Nat Med. 2006;12(8):895–904. | |
Thamilselvan V, Basson MD. Pressure activates colon cancer cell adhesion by inside-out focal adhesion complex and actin cytoskeletal signaling. Gastroenterology. 2004;126(1):8–18. | |
Thamilselvan V, Craig DH, Basson MD. FAK association with multiple signal proteins mediates pressure-induced colon cancer cell adhesion via a Src-dependent PI3K/Akt pathway. FASEB J. 2007;21(8):1730–1741. | |
Von Sengbusch A, Gassmann P, Fisch KM, Enns A, Nicolson GL, Haier J. Focal adhesion kinase regulates metastatic adhesion of carcinoma cells within liver sinusoids. Am J Pathol. 2005;166(2):585–596. | |
Barnes JM, Nauseef JT, Henry MD. Resistance to fluid shear stress is a conserved biophysical property of malignant cells. PLoS One. 2012;7(12):e50973. | |
Suresh S. Nanomedicine: elastic clues in cancer detection. Nat Nanotechnol. 2007;2(12):748–749. | |
Lee GYH, Lim CT. Biomechanics approaches to studying human diseases. Trends Biotechnol. 2007;25(3):111–118. | |
Suresh S. Biomechanics and biophysics of cancer cells. Acta Biomater. 2007;3(4):413–438. | |
Guck J, Schinkinger S, Lincoln B, et al. Optical deformability as an inherent cell marker for testing malignant transformation and metastatic competence. Biophys J. 2005;88(5):3689–3698. | |
Lim CT, Zhou EH, Quek ST. Mechanical models for living cells – a review. J Biomech. 2006;39(2):195–216. | |
Radmacher M, Fritz M, Kacher CM, Cleveland JP, Hansma PK. Measuring the viscoelastic properties of human platelets with the atomic force microscope. Biophys J. 1996;70(1):556–567. | |
Weisenhorn AL, Khorsandi M, Kasas S, Gotzos V, Butt HJ. Deformation and height anomaly of soft surfaces studied with an AFM. Nanotechnology. 1993;4(2):106–113. | |
Dai J, Ting-Beall HP, Sheetz M. The secretion-coupled endocytosis correlates with membrane tension changes in RBL 2H3 cells. J Gen Physiol. 1997;110(1):1–10. | |
Dao M, Lim CT, Suresh S. Mechanics of the human red blood cell deformed by optical tweezers. J Mech Phys Solids. 2003;51(11):2259–2280. | |
Mitchison JM, Swann MM. The mechanical properties of the cell surface: I. The cell elastimeter. J Exp Biol. 1954;31(3):443–460. | |
Rand RP, Burton AC. Mechanical properties of the red cell membrane. I. Membrane stiffness and intracellular pressure. Biophys J. 1964;4:115–135. | |
Hochmuth RM. Micropipette aspiration of living cells. J Biomech. 2000;33(1):15–22. | |
Guilak F, Jones WR, Ting-Beall HP, Lee GM. The deformation behavior and mechanical properties of chondrocytes in articular cartilage. Osteoarthritis Cartilage. 1999;7(1):59–70. | |
Evans E, Yeung A. Apparent viscosity and cortical tension of blood granulocytes determined by micropipet aspiration. Biophys J. 1989;56(1):151–160. | |
Cross SE, Jin YS, Tondre J, Wong R, Rao J, Gimzewski JK. AFM-based analysis of human metastatic cancer cells. Nanotechnology. 2008;19(38):384003. | |
Cross SE, Jin YS, Rao J, Gimzewski JK. Nanomechanical analysis of cells from cancer patients. Nat Nanotechnol. 2007;2(12):780–783. | |
Rebelo LM, de Sousa JS, Mendes Filho J, Radmacher M. Comparison of the viscoelastic properties of cells from different kidney cancer phenotypes measured with atomic force microscopy. Nanotechnology. 2013;24(5):055102. | |
Faria EC, Ma N, Gazi E, et al. Measurement of elastic properties of prostate cancer cells using AFM. Analyst. 2008;133(11):1498–1500. | |
Malek AM, Alper S, Izumo S. Hemodynamic shear stress and its role in atherosclerosis. JAMA. 1999;282(21):2035–2042. | |
Chandran K, Rittgers S, Yoganathan A. Biofluid Mechanics: The Human Circulation. Boca Raton, FL: CRC Press; 2012. | |
Theret DP, Levesque MJ, Sato M, Nerem RM, Wheeler LT. The application of a homogeneous half-space model in the analysis of endothelial cell micropipette measurements. J Biomech Eng. 1988;110(3):190–199. | |
Faria EC, Ma N, Gazi E, et al. Measurement of elastic properties of prostate cancer cells using AFM. Analyst. 2008;133(11):1498–1500. | |
Agus DB, Alexander JF, Arap W, et al. A physical sciences network characterization of non-tumorigenic and metastatic cells. Sci Rep. 2013;3:1449. | |
Zeidman I. Fate of circulating tumor cells III. Comparison of metastatic growth produced by tumor cell emboli in veins and lymphatics. Cancer Res. 1965;21(1):38–39. | |
Zeidman I, McCutcheon M, Coman D. Factors affecting the number of tumor metastases experiments with a transplantable mouse tumor. Cancer Res. 1950;10(6):357–359. | |
Zeidman I. Metastasis: a review of recent advances. Cancer Res. 1957;17(3):157–162. | |
Kalluri R, Weinberg RA. The basics of epithelial-mesenchymal transition. J Clin Invest. 2009;119(6):1420–1428. | |
Chaffer CL, Weinberg RA. A perspective on cancer cell metastasis. Science. 2011;331(6024):1559–1564. | |
Thiery JP, Sleeman JP. Complex networks orchestrate epithelial-mesenchymal transitions. Nat Rev Mol Cell Biol. 2006;7(2):131–142. |
 © 2015 The Author(s). This work is published and licensed by Dove Medical Press Limited. The
full terms of this license are available at https://www.dovepress.com/terms
and incorporate the Creative Commons Attribution
- Non Commercial (unported, 3.0) License.
By accessing the work you hereby accept the Terms. Non-commercial uses of the work are permitted
without any further permission from Dove Medical Press Limited, provided the work is properly
attributed. For permission for commercial use of this work, please see paragraphs 4.2 and 5 of our Terms.
© 2015 The Author(s). This work is published and licensed by Dove Medical Press Limited. The
full terms of this license are available at https://www.dovepress.com/terms
and incorporate the Creative Commons Attribution
- Non Commercial (unported, 3.0) License.
By accessing the work you hereby accept the Terms. Non-commercial uses of the work are permitted
without any further permission from Dove Medical Press Limited, provided the work is properly
attributed. For permission for commercial use of this work, please see paragraphs 4.2 and 5 of our Terms.