Back to Journals » Hepatic Medicine: Evidence and Research » Volume 17
Aldose Reductase Mediated Mitophagy Promotes Epithelial-Mesenchymal Transition of Hepatocytes
Authors Yan J, Zhao W, Wang H, Zhou L, Li X, Wang G
Received 11 June 2025
Accepted for publication 12 September 2025
Published 1 October 2025 Volume 2025:17 Pages 141—159
DOI https://doi.org/10.2147/HMER.S546357
Checked for plagiarism Yes
Review by Single anonymous peer review
Peer reviewer comments 3
Editor who approved publication: Dr Gerry Lake-Bakaar
Jingjing Yan,1 Wenke Zhao,1 Haoyu Wang,1 Lutan Zhou,1 Xianwei Li,1 Guannan Wang2
1Department of Pharmacy, Wannan Medical College, Wuhu, Anhui, 241002, People’s Republic of China; 2Department of Hepatobiliary Surgery, The First Affiliated Hospital of Wannan Medical College, Wuhu, Anhui, 241001, People’s Republic of China
Correspondence: Guannan Wang, Department of Hepatobiliary Surgery, The First Affiliated Hospital of Wannan Medical College, No.2 Zheshan West Road, Wuhu, Anhui, 241001, People’s Republic of China, Email [email protected] Xianwei Li, Department of Pharmacy, Wannan Medical College, No. 22 West Wenchang Road, Wuhu, Anhui, 241002, People’s Republic of China, Email [email protected]
Background: Recent studies suggest that impaired mitophagy leading to epithelial-mesenchymal transition (EMT) in hepatocytes plays a major role in the progression of hepatic fibrosis (HF). The authors’ previous study demonstrated that aldose reductase (AR) promotes radiation-induced EMT in alveolar epithelial cells. This study aims to examine whether AR influences EMT in hepatocytes by regulating defective mitophagy.
Methods: Some histological techniques, including HE staining, Masson’s trichrome staining, immunohistochemistry, and transmission electron microscopy, were employed to validate the model and examine mitochondrial injury. Subsequently, EMT was induced in hepatocytes through TGF-β 1 treatment. Then experiments such as siRNA-mediated gene silencing, AR inhibition, and AR overexpression were performed. Finally, the activation status of AKT and mTOR, as well as the expression levels of proteins associated with mitophagy and EMT, were evaluated using RT-qPCR, immunofluorescence staining, and Western blotting.
Results: AR knockout significantly reduced AKT and mTOR phosphorylation In vivo but increased the expression of Pink1 and Parkin in CCl4-exposed liver tissues. This was associated with an increased LC3 II/I expression ratio, decreased p62 expression, reduced mitochondrial damage, enhanced E-cadherin expression, and diminished Snail, α-SMA, and vimentin expression, which collectively alleviated HF. In vitro experiments revealed that AR knockdown significantly attenuated the activation of the TGF-β 1-induced AKT/mTOR pathway, restored mitochondrial autophagy function, decreased ROS levels, increased mitochondrial membrane potential (MMP) and ATP production, and reversed EMT in hepatocytes via siRNA or pharmacological inhibition. Conversely, AR overexpression exacerbated the activation of the TGF-β 1-induced AKT/mTOR pathway, impaired mitophagy efficiency, increased ROS levels, decreased MMP and ATP levels, and facilitated EMT process.
Conclusion: The study findings demonstrated that AR facilitates EMT in hepatocytes and plays a major role in enhancing HF. This process may be linked to AR-induced activation of the AKT/mTOR. Consequently, this activation suppresses the expression of Pink1 and Parkin, ultimately reducing the risk of mitophagy in hepatocytes.
Keywords: aldose reductase, hepatic fibrosis, epithelial-mesenchymal transition, mitophagy
Introduction
Chronic hepatic damage triggers a dynamic tissue repair mechanism known as hepatic fibrosis (HF). This condition is a defining characteristic of chronic liver disease and represents a critical phase in the development of cirrhosis.1 HF is characterized by the considerable accumulation of extracellular matrix (ECM), irregular proliferation of fibrous connective tissue, and formation of abnormal blood vessels, all of which culminate in the alteration of the liver’s typical structural integrity.2 As HF advances, ECM primarily originates from activated myofibroblasts. These cells are absent in a healthy liver but emerge and become active due to diverse processes triggered by liver damage.3 Epithelial-mesenchymal transition (EMT) represents a biological mechanism by which epithelial cells acquire characteristics of mesenchymal cells through a regulated process.4 Studies have shown that hepatocytes, hepatic stellate cells, and cholangiocytes can convert into myofibroblasts through EMT, playing a significant role in the development and progression of HF.5 A wealth of research has indicated that hepatocytes undergoing EMT substantially contribute to the formation of myofibroblasts.6 Studies on rats with liver fibrosis induced by carbon tetrachloride (CCl4) revealed that isolated hepatocytes exhibit characteristics akin to mesenchymal cells. This finding reinforces the idea that hepatocytes play a crucial role in the initiation and progression of liver fibrosis, owing to their ability to differentiate into myofibroblasts.7 Transforming growth factor-β1 (TGF-β1) acts as a strong stimulator of EMT in hepatocytes. During this transition, the expression of epithelial markers, such as E-cadherin, decreases, while the expression of mesenchymal markers, including vimentin and α-SMA, increases.8 TGF-β1 is proposed to initiate EMT in hepatocytes, subsequently affecting the development and progression of HF. However, the precise mechanisms underlying this phenomenon remain inadequately understood. The exploration of the molecular pathways involved in EMT within hepatocytes following liver damage may reveal novel approaches and therapeutic targets for early intervention and management of HF.
AR, encoded by Akr1b1 in humans and Akr1b3 in mice, belongs to the aldo-keto reductase superfamily. Studies have demonstrated that AR significantly influences nuclear receptor signaling, inflammatory processes, hormone production and regulation, cellular metabolism, and cell proliferation.9 AR has been extensively studied for its role as a rate-limiting enzyme in glucose metabolism via the polyol pathway, which is critical in diabetes-related vascular and neurological complications.10 Recent findings indicate that the inhibition of AR expression may prevent and treat conditions such as renal fibrosis.11 It has been also shown that AR facilitates EMT in ocular lens epithelial cells, and the use of AR inhibitors can significantly impede this process, thereby decelerating cataract development.12 The authors’ previous studies have demonstrated that Epalrestat treatment significantly ameliorated the bleomycin-mediated histological fibrosis alterations and blocked collagen deposition concomitantly with reversing bleomycin-induced expression up-regulation of TGF-β1, AR, α -SMA and collagen I In vitro, Epalrestat remarkably attenuated proliferation of pulmonary fibroblasts and expression of α -SMA and collagen I induced by TGF-β 1, and this inhibitory effect of Epalrestat was accompanied by inhibiting AR expression.13 We also found that AR deficiency effectively alleviated radiation-induced pulmonary fibrosis (RIPF) by decreasing Twist1 expression and inhibiting EMT transformation and MMP2 and collagen I expression of lung epithelial cells epithelial cells, which ultimately affects the occurrence and development of RIPF.14 However, more studies are still needed to elucidate the specific mechanisms by which AR induces EMT in hepatocytes.
Mitophagy functions as an adaptive mechanism regulated by the organism to maintain cellular homeostasis. This process adapts to fluctuations in cellular energy demands and preserves mitochondrial integrity by modulating mitochondrial dynamics and eliminating dysfunctional mitochondria.15 Numerous studies have shown that augmenting mitophagy can alleviate HF caused by CCl4.16,17 They have also demonstrated that the induction of mitophagy can suppress EMT in hepatocytes and, thereby, reduce the risk of HF.18,19 Pink1 and Parkin are essential for initiating mitophagy in response to mitochondrial dysfunction. Specifically, Pink1 identifies damaged mitochondria, accumulates on their outer membranes, and activates Parkin along with downstream pathways to facilitate mitophagy.20 Studies indicate that mitophagy regulated by the Pink1/parkin pathway is involved in the development of HF.21,22 Stimulating Pink1/parkin-dependent mitophagy can significantly suppress the activation of hepatic stellate cells and mitigate the development of HF.23 A substantial body of research have demonstrated that the activation of the AKT/mTOR signaling pathway plays a critical role in regulating autophagy.24,25 The suppression of this pathway’s activity can increase mitophagy, which reduces the risk of HF.26 It has been also reported that the increased expression of AR activates the AKT/mTOR signaling cascade, which facilitates angiogenesis in hamster models of oral carcinoma.27
Based on previously established frameworks, this study employs both in vivo and in vitro models of EMT to examine the effect of AR-mediated mitophagy insufficiency on EMT and HF in hepatocytes. To this end, this study also utilizes a range of advanced molecular techniques, including gene knockout, gene overexpression, and siRNA interference. The main objective is to provide novel insights and innovative approaches to the prevention and treatment of HF-associated diseases.
Materials and Methods
Materials
Epalrestat (EPS; No. HY-66009) and TGF-β1 protein (No. HY-P7117) were acquired from Med Chem Express (MCE). CCl4 was obtained from Sigma (No. 488488). The test kits for alanine transaminase (ALT) (No. GP6040), aspartate transaminase (AST) (No. GO6050), gamma-glutamyl transferase (GGT) (No. GG6060), and alkaline phosphatase (ALP) (No. AP6030) were procured from Beijing LEADMAN Biochemical Co., LTD. The immunohistochemical kit (No. MAX-001) for Type I collagen (COL1A1) and matrix metallopeptidase 2(MMP2) was provided from Fuzhou Maixin Biotechnology Development Co., Ltd. ROS assay kit (No. S0033), adenosine triphosphate (ATP) assay kit (No. S0026), and mitochondrial membrane potential assay kit (No. C2004S) were sourced from Beyotime Biotechnology (Shanghai, China). The AR antibody (ab316016) and Snail antibody (ab180714) were obtained from Abcam Inc. The antibody of COL1A1 antibody (No. 30277), TGF-β1 (No. 81746), MMP2 (No. 10373), E-cadherin (No.20874), α-SMA (No. 14395), vimentin (No. 60330), microtubule-associated protein 1 light chain 3 (LC3) (No. 14600), sequestosome-1 (P62) (No. 18420), Pink1 (No. 23274) and Parkin (No. 14060) were acquired from Proteintech Group, Inc. (Wuhan, China). The antibodies of Akt (#9272), Phospho-Akt (#4060), mTOR (#2983), and Phospho-mTOR antibody (#2971) and β-actin (#4967) were procured from Cell Signaling Technology.
Animal Experiments
C57BL/6 WT and Akr1b3 gene knockout (Akr1b3−/−) male mice (No. KOAIB220407LJ9) were obtained from Cyagen Biotechnology Co., Ltd. (Suzhou, China). The study included four groups: WT Vehicle group, Akr1b3−/− Vehicle group, WT CCl4 group, and Akr1b3−/− CCl4 group, with eight mice per group. Mice were anesthetized via intraperitoneal injection of tribromoethanol (400 mg/kg, No. T48402, Sigma, USA). To establish an HF model, CCl4 (1.0 mL/kg, dissolved in olive oil) was administered intratracheally to both the WT CCl4 group and the Akr1b3−/− CCl4 group, twice a week. Eight weeks after modeling, animals were euthanized with tribromoethanol (400 mg/kg) to assess fibrotic changes. All animal experiments were approved by the Animal Welfare and Ethics Committee of Wannan Medical College (Approval number: WNMC-AWE-2023182). Experimental animals follow the Guidelines for Ethical Review of Experimental Animal Welfare. The standard number of this guide is GB/T 35892–2018.
Liver Function Examination
The levels of ALT, AST, ALP, and GGT were determined under the kit instructions.
Liver Histopathology and Collagen Deposition Analysis
Pathological alterations were examined using hematoxylin and eosin staining, as previously described.14 Moreover, collagen deposition was assessed via Masson’s staining after liver tissue fixation, dehydration, embedding, and sectioning. The collagen volume fraction was utilized to assess the severity of HF.
Immunohistochemistry
The expression of COL1A1 and MMP2 in the liver tissue was determined according to the immunohistochemical kit’s experimental procedure. The primary antibody concentrations for COL1A1 and MMP2 were 1:200 and 1:250, respectively, while the corresponding secondary antibody concentrations were 1:500 and 1:750. The positive expression of COL1A1 and MMP2 in liver tissue manifested as brown-yellow granules. The expression of COL1A1 and MMP2 proteins were quantitatively analyzed in Image-Pro Plus 7.0 from Media Cybernetics (USA). Initially, the area of COL1A1 and MMP2 positive staining (integrated optical density, IOD) was measured, followed by the measurement of the selected region’s area. The mean optical density (MOD) of the positive expression of COL1A1 and MMP2 was then calculated using the formula: MOD = IOD/area of the region (Area).
Transmission Electron Microscopy (TEM)
Fresh liver tissue samples, approximately 2 mm3 in size, were fixed with 2.5% glutaraldehyde for 72 hours. Ultrathin sections were prepared according to the protocol outlined in the reference.16 The mitochondrial structure was subsequently examined and imaged under a transmission electron microscope (Thermo Fisher Scientific, USA).
Cell Culture and Treatment
Mouse hepatocytes (AML12; No. SCSP-550) were obtained from the cell bank of the Chinese Academy of Sciences. The first experiment examined whether AR inhibition, through either the AR inhibitor EPS or an AR-specific siRNA, could suppress TGF-β1-induced EMT. The cells were categorized into five groups: Control, TGF-β1, TGF-β1 + Vector, TGF-β1 + EPS, and TGF-β1 + si-AR. Cells were pre-treated with either a siRNA negative control, EPS (20 mmol), or si-AR for 6 hours, followed by TGF-β1 (20 ng/mL) treatment for 48 hours. The second experiment investigated whether AR overexpression could induce EMT or enhance TGF-β1-induced EMT. The cells were divided into five groups: Control, TGF-β1, pcDNA3.1-AR, TGF-β1+ pcDNA3.1-negative control (NC), and TGF-β1+ pcDNA3.1-AR. Cells were pre-treated with either a pcDNA3.1 negative control or pcDNA3.1-AR for 6 hours, followed by TGF-β1 (20 ng/mL) treatment for 48 hours. Each experimental group consisted of two duplicate wells and was replicated three times.
Cell Transfection
The AR-specific siRNA and its corresponding negative control (NC) were designed and synthesized by GenePharma (Suzhou, China). The target sequences for AR were 5′- GUACCUCCCACAAGGAUUATT −3′ and 5′- UAAUCCUUGUGGGAGGUACTT −3′. The NC sequences for AR were 5′- UUCUCCGAACGUGUCACGUTT −3′ and 5′- ACGUGACAUUCGCAGGGAATT −3′. AR overexpression was achieved using a pcDNA3.1 vector (GenePharma, Suzhou, China), with the empty vector serving as the NC. Transfection of AR siRNA, overexpression constructs, and NC into AML12 cells was conducted using Lipofectamine™ 3000 (ThermoFisher Scientific, USA).
Analysis of Cell Migration
In this experiment, 200 μL of a cell suspension devoid of serum was introduced into the upper compartment of the TranswellTM chamber. Concurrently, 800 μL of cell culture medium supplemented with 20% fetal bovine serum was placed in the lower compartment. After subjecting the cells to the treatment protocol described earlier, they were fixed using a 4% paraformaldehyde solution for 30 minutes. This was followed by staining with 200 μL of a 0.1% crystal violet solution for 30 minutes. The movement of cells was tracked via microscopic examination and recorded using photographic techniques.
Evaluation of ROS Levels
The DCFH-DA fluorescent probe and fluorescence microscope were utilized to observe changes in ROS levels, while the fluorescent enzyme was utilized to measure the fluorescence intensity of ROS.
Measurement of Mitochondrial Membrane Potential and ATP Content
Following the protocol outlined in the mitochondrial membrane potential detection kit, the JC-1 fluorescent probe was utilized to assess the mitochondrial membrane potential with a fluorescence microscope. The intracellular ATP concentrations were also measured using an ATP assay kit, according to the manufacturer’s instructions.
Immunofluorescence Assay
Following fixation, membrane disruption, washing, and sealing, the AML12 cells were incubated with rabbit anti-E-cadherin antibody (1:200), mouse anti-vimentin antibody (1:200), and mouse anti-α-SMA antibody (1:500) for 24 hours. After washing, Coralite488-labeled goat anti-mouse IgG (No.SA00013-2, Proteintech, Wuhan, China) (1:1000) and Coralite594-labeled goat anti-rabbit IgG (No.SA00013-3, Proteintech) (1:1000) were applied to the cells, and then the cells were incubated for 2 hours at room temperature away from light. The cells were then washed and stained with DAPI for 5 minutes. Protein expression was observed and photographed using laser confocal microscopy (green fluorescence: excitation wavelength 488 nm; red fluorescence: excitation wavelength 594 nm; blue fluorescence: excitation wavelength 405 nm). The relative fluorescence intensities of green and red were quantified in Image-Pro Plus 7.0.
RT-qPCR
RNA was isolated from liver tissue and AML12 cells utilizing the TRIzol reagent (No. T9424, Sigma) according to the manufacturer’s instructions. The RT-PCR reaction parameters and analytical techniques were the same as those used in the authors’ previous study.14 Primers sequence for both genes and the housekeeping gene β-Actin are presented in Table 1.
 |
Table 1 Sequences of Primers for the Target Genes |
Western Blotting Analysis
The proteins were extracted from liver tissue and AML12 cells using RIPA buffer (No. P0013B, Beyotime, China) under low-temperature conditions. Western blotting analysis was conducted following previously established research methods.14 The antibodies were diluted as follows: COL1A1 (1:1000), MMP2 (1:500), TGF-β1 (1:500), AR (1:500), Snail (1:500), E-cadherin (1:500), vimentin (1:500), α-SMA (1:2000), LC3 (1:500), P62 (1:500), Pink1 (1:500), Parkin (1:500), Akt (1:1000), Phospho-Akt (1:500), mTOR antibody (1:1000), Phospho-mTOR (1:500), and β-Actin (1:2000). The gray value of target protein band was measured and the relative protein expression was analyzed in Image-Pro Plus 7.0.
Data Analysis
Results were expressed as the mean ± standard deviation (SD). The data obtained were analyzed using one-way ANOVA and then the Least Significant Difference (LSD) t-test in SPSS-25.0 (IBM, USA). A P-value less than 0.05 was deemed to indicate statistical significance.
Results
Knockout of Akr1b3 Mitigated CCl4-Induced HF
The HE analysis demonstrated that the structural integrity of the hepatic tissue in the WT CCl4 group was significantly disrupted. This was characterized by degenerative and necrotic changes in hepatocytes, fibrotic encasement that resulted in the formation of pseudo lobules, and a significant infiltration of inflammatory cells surrounding the hepatic sinusoids and central veins. Consequently, liver function underwent a substantial decline. The liver tissue architecture was further disrupted as shown by Masson staining, which revealed a significant increase in collagen volume fraction due to the extensive deposition of blue-stained collagen fibers and fibrotic scar formation surrounding the central vein. CCl4-induced HF was significantly attenuated following the knockout of the Akr1b3 gene, as demonstrated by a substantial increase in liver function and a substantial decrease in collagen volume fraction (Figure 1).
 |
Figure 1 Knockout of Akr1b3 mitigated CCl4-induced HF. (A) Staining of live tissue using H&E technique. (B) Levels of hepatic function markers ALT, AST, ALP, and GGT. (C) The application of Masson’s trichrome staining technique to live tissue. (D) The fraction of collagen volume in the live tissue. Data are mean ± SD. n=8. **P<0.01 vs WT Vehicle; ##P<0.01 vs WT CCl4. |
Knockout of Akr1b3 Reduced the BLM-Induced Expression Levels of COL1A1 and MMP2
The expression of extracellular matrix components, such as COL1A1 and MMP2, as well as the pro-fibrotic mediator TGF-β1, was significantly increased in the WT CCl4 group. This was demonstrated through immunohistochemistry, RT-qPCR, and Western blotting. In contrast, the CCl4-induced expression of COL1A1, MMP2, and TGF-β1 was significantly diminished following the disruption of the Akr1b3 gene (Figure 2).
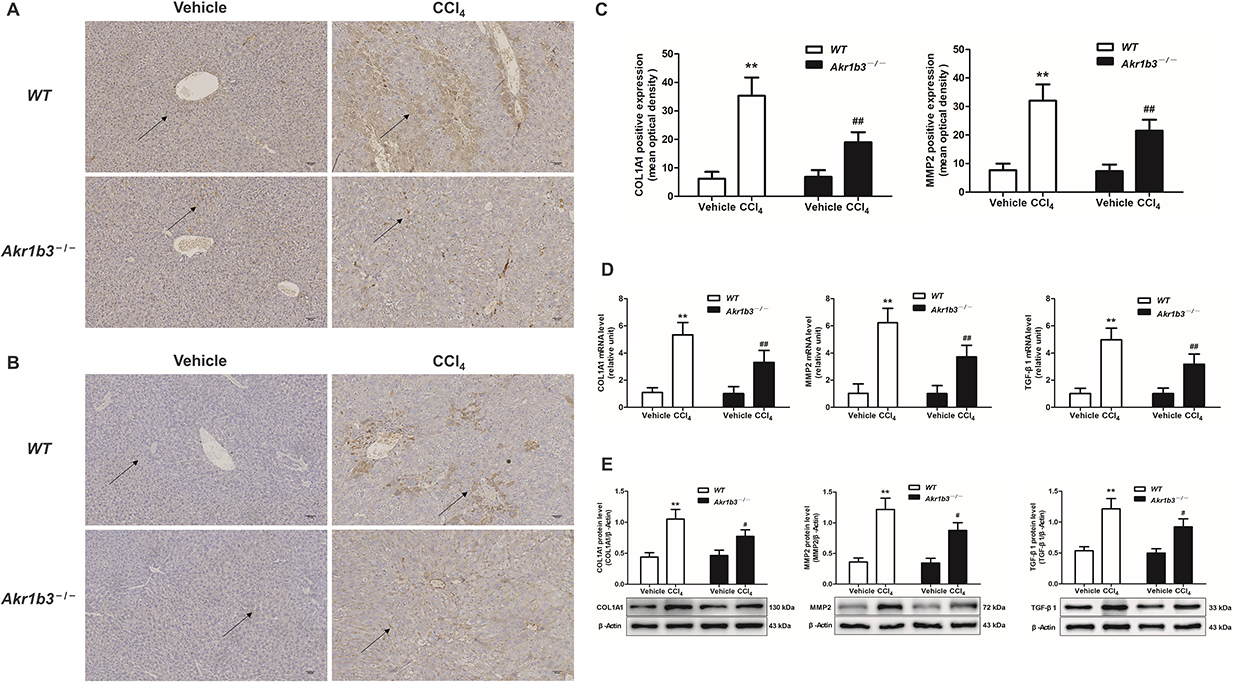 |
Figure 2 Knockout of Akr1b3 reduced the BLM-induced expression levels of COL1A1 and MMP2. The protein expression levels of COL1A1 (A) and MMP2 (B) in live tissue were evaluated through immunohistochemical techniques. (C) Semi-quantitative evaluation of expression levels of COL1A1 and MMP2. (D) The mRNA expression levels of COL1A1, MMP2, and TGF-β1 were evaluated through RT-qPCR. (E) The protein levels of COL1A1, MMP2, and TGF-β1 were evaluated through Western blotting and relative quantification of their expression after normalization with β-Actin. Data are mean ± SD. n=8. **P<0.01 vs WT Vehicle; #P<0.05, ##P<0.01 vs WT CCl4. |
The Impact of AR Inhibitor EPS, AR siRNA, or AR Overexpression on TGF-β1 or AR Overexpression-Induced COL1A1 and MMP2 Expression, and Cell Migration in Hepatocytes
COL1A1 and MMP2 expression significantly increased in both the TGF-β1-treated and pcDNA3.1-AR-transfected groups, as compared to the control group. This was accompanied by an increase in cell migration capability. In contrast to the TGF-β1 group, the EPS and si-AR groups exhibited a significant reduction in cell migration ability and a significant decrease in COL1A1 and MMP2 expression levels. Contrary to the groups that were treated with either TGF-β1 or pcDNA3.1-AR alone, the group that was treated with a combination of TGF-β1 and pcDNA3.1-AR exhibited a substantial increase in COL1A1 and MMP2 expression. In addition, the concurrent application of these treatments resulted in a significant enhancement in cell migration (Figure 3).
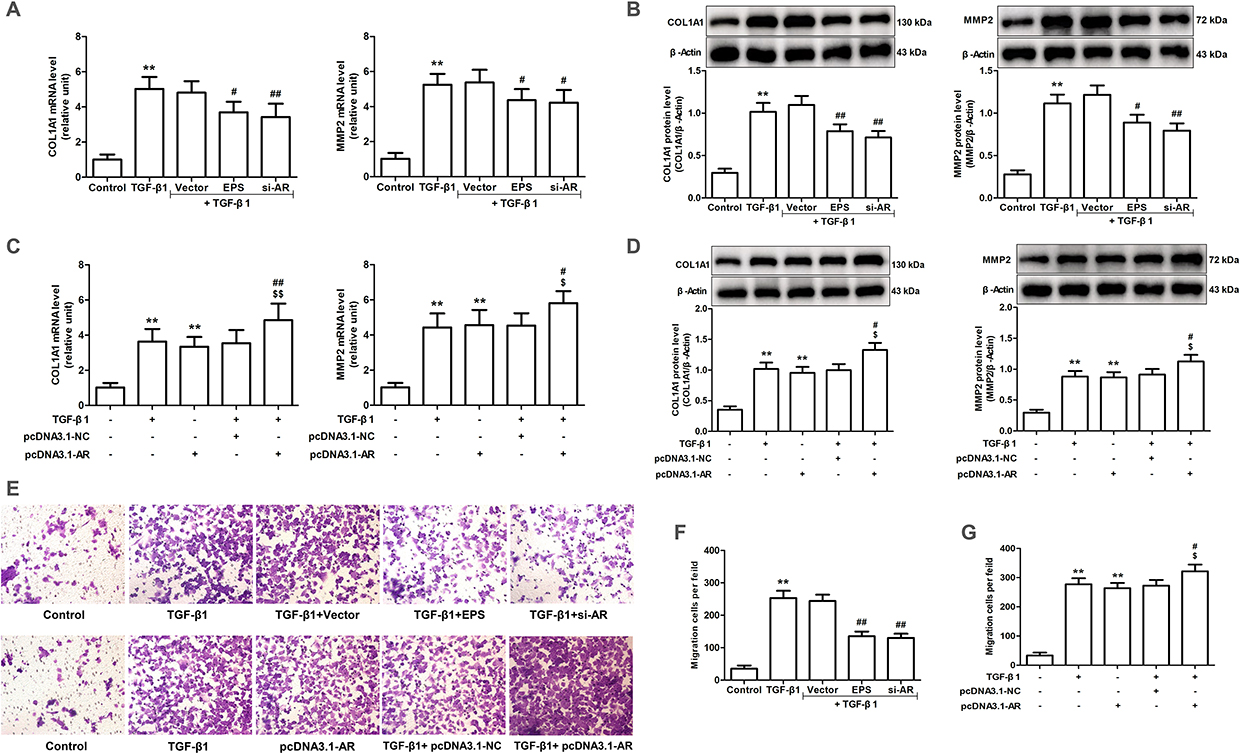 |
Figure 3 Effects of AR inhibitor EPS, AR siRNA or overexpression of AR on TGF-β1-induced COL1A1 and MMP2 expression and cell migration in AML12 cells. (A and C) The mRNA expression levels of COL1A1 and MMP2 were evaluated through RT-qPCR. (B and D) The protein expression levels of COL1A1 and MMP2 were evaluated through Western blotting and relative quantification of their expression after normalization with β-Actin. (E) Transwell assay was employed to evaluate the migratory capacity of cells. (F and G) Quantitative analysis of migratory cell number. Data are mean ± SD. n=6. (A, B and F) **P<0.01 vs Control; #P<0.05, ##P<0.01 vs TGF-β1. (C, D and G) **P<0.01 vs Control; #P<0.05, ##P<0.01 vs TGF-β1; $P<0.05, $$P<0.01 vs pcDNA3.1-AR. |
Knockout of Akr1b3 Reduced the CCl4-Induced EMT
The WT CCl4 group demonstrated a substantial increase in AR and Snail expression levels compared to the WT Vehicle group. This was accompanied by the expression of enhanced EMT markers, which were characterized by reduced E-cadherin expression and elevated α-SMA and vimentin expression. The CCl4-induced increases in Snail expression and EMT were significantly diminished after the Akr1b3 gene was deleted (Figure 4).
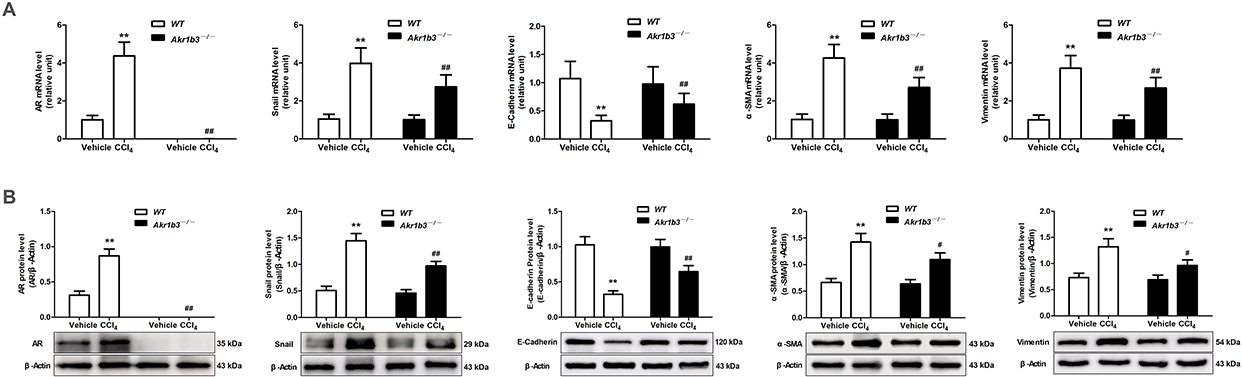 |
Figure 4 Knockout of Akr1b3 reduced the CCl4-induced EMT. (A) The mRNA expression levels of AR, Snail, E-cadherin, α-SMA and vimentin in live tissue were evaluated through RT-qPCR. (B) The protein levels of AR, Snail, E-cadherin, α-SMA and vimentin were evaluated through Western blotting and relative quantification of their expression after normalization with β-Actin. Data are mean ± SD. n=8. **P<0.01 vs WT Vehicle; #P<0.05, ##P<0.01 vs WT CCl4. |
The Effect of AR Inhibitor EPS, AR siRNA, or Overexpression of AR on EMT Induced by TGF-β1 or AR Overexpression in Hepatocytes
Compared to the control group, the TGF-β1-treated and pcDNA3.1-AR-transfected groups exhibited substantial upregulation of AR and Snail expression. In contrast, the EPS or si-AR groups exhibited a substantial decrease in AR and Snail expression when compared to the TGF-β1 group. It is important to note that the combination of TGF-β1 and pcDNA3.1-AR led to a more significant increase in AR and Snail expression than the individual treatments. In both the TGF-β1-treated and pcDNA3.1-AR-transfected groups, the expression levels of E-cadherin were decreased compared to the control group, whereas the levels of α-SMA and vimentin increased. However, the EPS or si-AR group exhibited increased E-cadherin expression and decreased α-SMA and vimentin levels in contrast to the TGF-β1 group. The combined treatment of TGF-β1 and pcDNA3.1-AR led to a more pronounced downregulation of E-cadherin and a further enhancement of α-SMA and vimentin upregulation compared to their individual treatments (Figures 5 and 6).
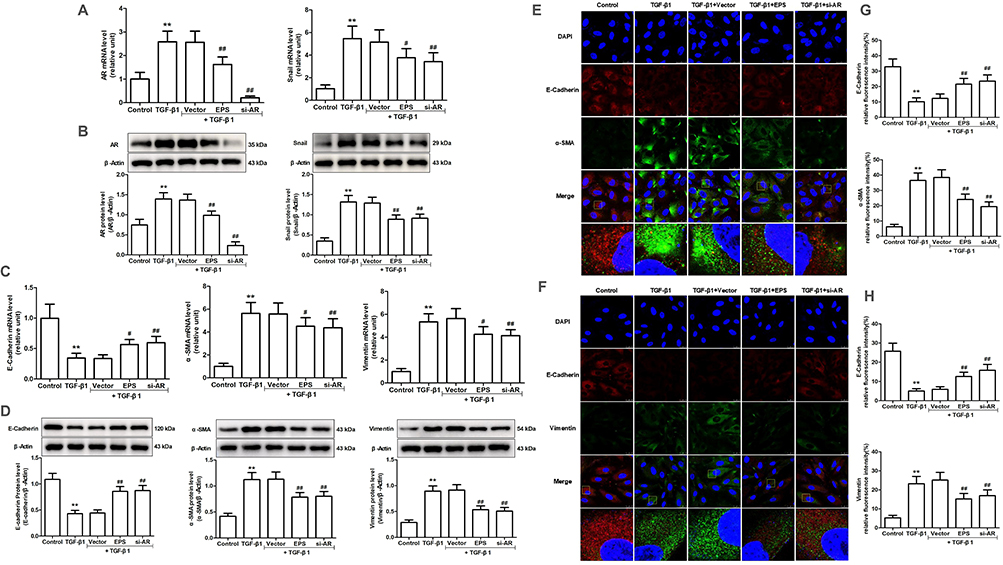 |
Figure 5 The effect of AR inhibitor EPS or AR siRNA on Snail expression and EMT induced by TGF-β1 or AR overexpression in AML12 cells. (A and C) The mRNA expression levels of AR, Snail, E-cadherin, α-SMA and vimentin were evaluated through RT-qPCR. (B and D) The protein levels of AR and Snail were evaluated through Western blotting and relative quantification of their expression after normalization with β-Actin. (E and F) The protein levels of E-cadherin, α-SMA and vimentin were assessed through immunofluorescence staining. (G and H) E-cadherin, α-SMA and vimentin expression relative fluorescence intensity. Data are mean ± SD. n=6. **P<0.01 vs Control; #P<0.05, ##P<0.01 vs TGF-β1. |
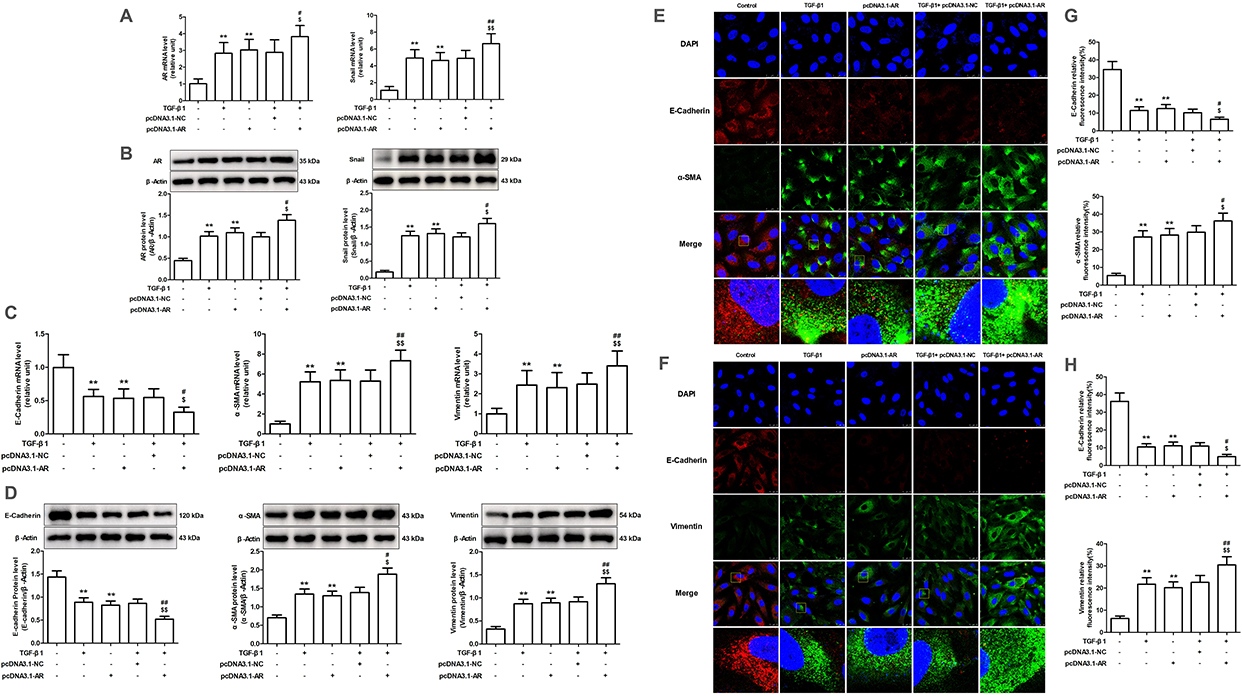 |
Figure 6 The effect of AR overexpression on Snail expression and EMT induced by TGF-β1 in AML12 cells. (A and C) The mRNA expression levels of AR, Snail, E-cadherin, α-SMA and vimentin were evaluated through RT-qPCR. (B and D) The protein levels of AR and Snail were evaluated through Western blotting and relative quantification of their expression after normalization with β-Actin. (E and F) The protein levels of E-cadherin, α-SMA and vimentin were assessed through immunofluorescence staining. (G and H) E-cadherin, α-SMA and vimentin expression relative fluorescence intensity. Data are mean ± SD. n=6. **P<0.01 vs Control; #P<0.05, ##P<0.01 vs TGF-β1; $P<0.05, $$P<0.01 vs pcDNA3.1-AR. |
Influence of Akr1b3 Expression Level on the AKT-mTOR Signal Transduction Pathway
In in vivo experiments, phosphorylation levels of AKT and mTOR were significantly elevated in the WT CCl4 group compared to the WT Vehicle group. The removal of the Akr1b3 gene significantly reduced the CCl4-induced elevations in the phosphorylation of AKT and mTOR (Figure 7A and B). In in vitro tests, the phosphorylation levels of AKT and mTOR were significantly higher in the group treated with TGF-β1 or transfected with pcDNA3.1-AR, compared to the untreated control group. In contrast, phosphorylation levels were markedly decreased in the EPS or si-AR groups compared to the TGF-β1-exposed group. The combination of TGF-β1 with pcDNA3.1-AR significantly increased AKT and mTOR phosphorylation when compared to the effects seen in the individual TGF-β1 and pcDNA3.1-AR groups (Figure 7C–F).
 |
Figure 7 Effects of AR inhibition for overexpression on AKT-mTOR signaling pathway. (A, C and E) The phosphorylation levels of AKT were evaluated through Western blotting and relative quantification of their expression after normalization with AKT. (B, D and F) The phosphorylation levels of mTOR were evaluated through Western blotting and relative quantification of their expression after normalization with mTOR. (A and B) Data are mean ± SD. n=8. **P<0.01 vs WT Vehicle; ##P<0.01 vs WT CCl4. (C and D) Data are mean ± SD. n=6. **P<0.01 vs Control; ##P<0.01 vs TGF-β1. (E and F) Data are mean ± SD. n=6. **P<0.01 vs Control; #P<0.05, ##P<0.01 vs TGF-β1; $P<0.05, $$P<0.01 vs pcDNA3.1-AR. |
Influence of Akr1b3 Expression on Mitophagy Level
The WT group treated with CCl4 exhibited significant mitochondrial enlargement and disruption of cristae structure in comparison to the WT Vehicle group, as evidenced by in vivo experiments. The expression levels of mitophagy-related proteins, such as Pink1, Parkin, and the LC3 II/I ratio, exhibited a decrease, whereas P62 levels showed an increase. The Akr1b3 knockout significantly reduced CCl4-induced mitochondrial damage and markedly increased mitophagy (Figure 8). In vitro studies showed that the levels of Pink1, Parkin, and LC3 II/I ratio were significantly reduced in both TGF-β1 and pcDNA3.1-AR groups, compared to the control group, whereas P62 expression was markedly elevated (Figures 9A and 10A). Furthermore, the mitochondrial membrane potential experienced a substantial decline, cellular ROS levels increased, and cellular ATP levels decreased (Figure 9B–F and Figure 9B–F). However, the the EPS or si-AR group exhibited significant improvement in mitophagy efficiency, mitochondrial membrane potential, and cellular ROS and ATP levels when compared to the TGF-β1 group. Importantly, the combined treatment of TGF-β1 and pcDNA3.1-AR resulted in further deterioration of these parameters compared to their separate treatments (Figures 9 and 10).
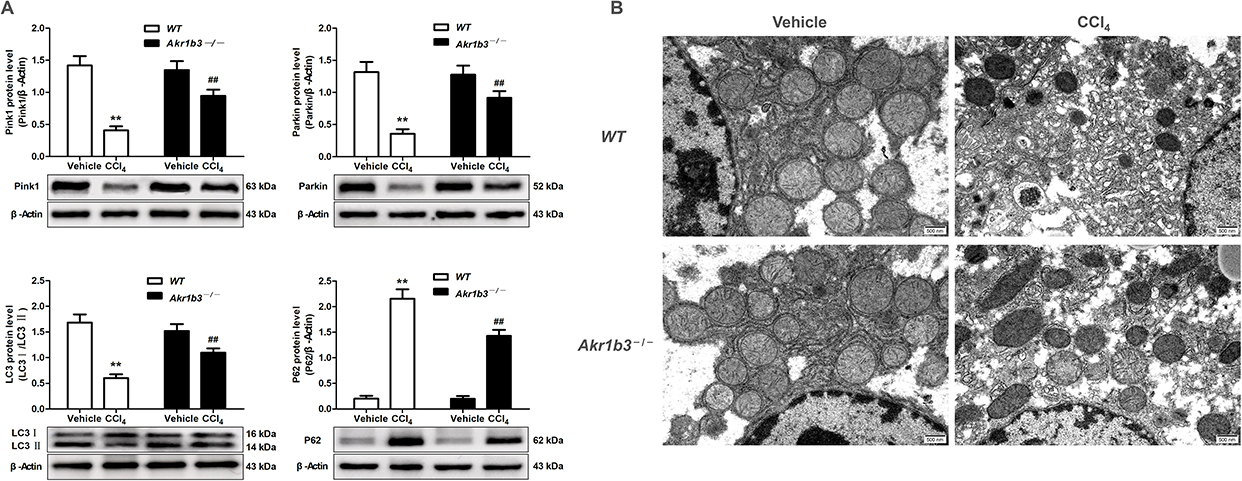 |
Figure 8 Knockout of Akr1b3 reduced CCl4-induced mitophagy. (A) The protein levels of Pink1, Parkin, LC3 and P62 were evaluated through Western blotting and relative quantification of their expression after normalization with β-Actin. (B) The shape and organizational features of mitochondria were analyzed utilizing transmission electron microscopy techniques. Data are mean ± SD. n=8. **P<0.01 vs WT Vehicle; ##P<0.01 vs WT CCl4. |
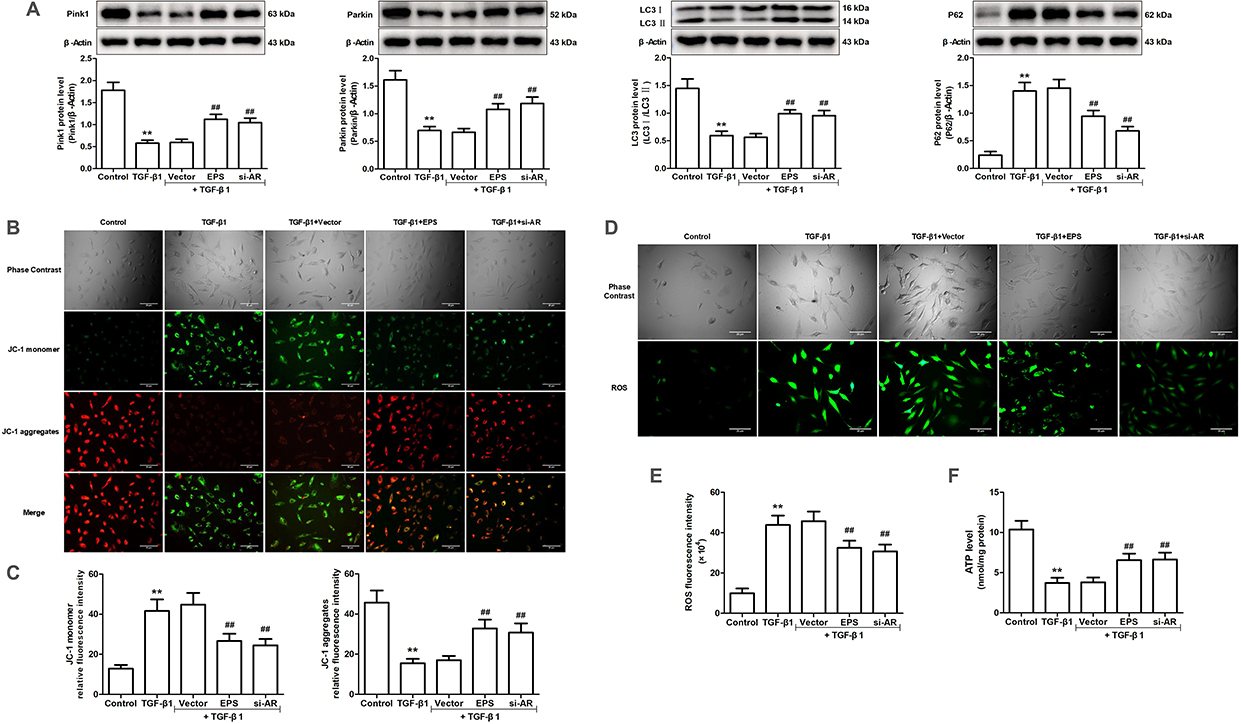 |
Figure 9 Effects of AR inhibitor EPS or AR siRNA on mitophagy induced by TGF-β1 in AML12 cells. (A) The protein levels of Pink1, Parkin, LC3 and P62 were evaluated through Western blotting and relative quantification of their expression after normalization with β-Actin. (B) Detection of mitochondrial membrane potential by JC-1 fluorescent probe. (C) Relative fluorescence intensities of JC-1 monomers and JC-1 aggregates. (D) The DCFH-DA fluorescent probe was employed to detect ROS. (E) ROS relative fluorescence intensity. (F) The level of ATP. Data are mean ± SD. n=6. **P<0.01 vs Control; ##P<0.01 vs TGF-β1. |
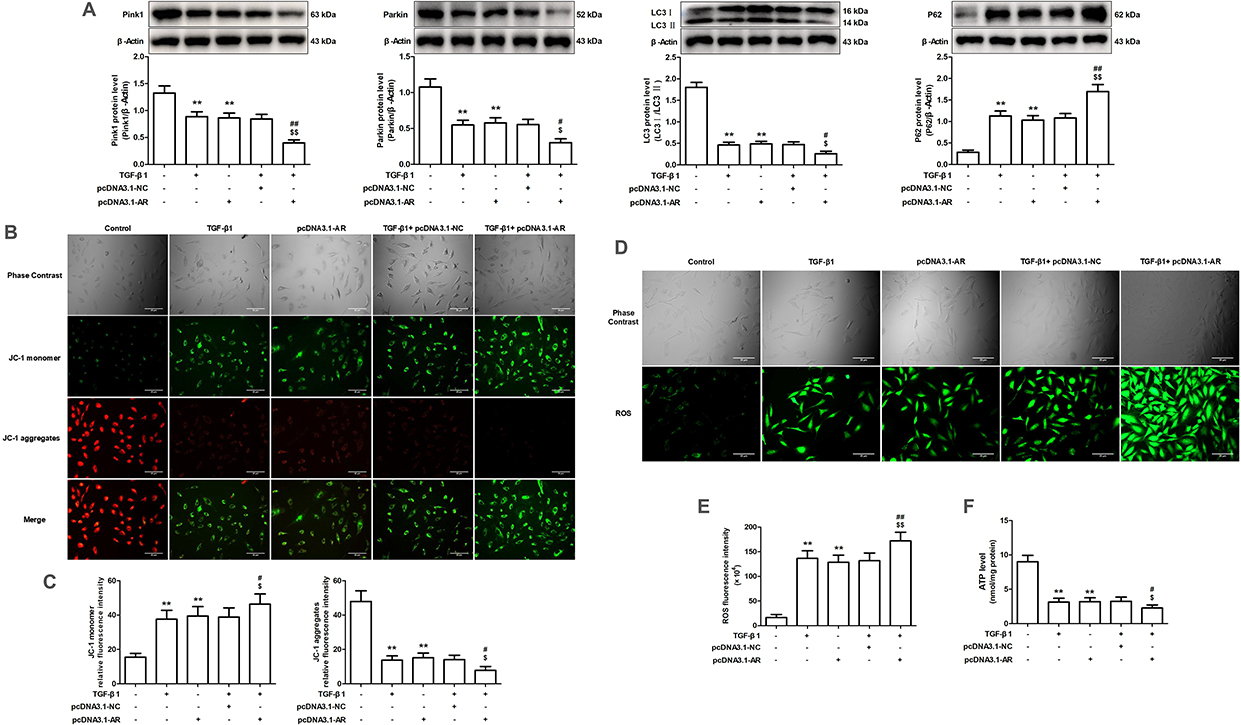 |
Figure 10 The effect of AR overexpression on mitophagy induced by TGF-β1 in AML12 cells. (A) The protein levels of Pink1, Parkin, LC3 and P62 were evaluated through Western blotting and relative quantification of their expression after normalization with β-Actin. (B) Detection of mitochondrial membrane potential by JC-1 fluorescent probe. (C) Relative fluorescence intensities of JC-1 monomers and JC-1 aggregates. (D) The DCFH-DA fluorescent probe was employed to detect ROS. (E) ROS relative fluorescence intensity. (F) The level of ATP. Data are mean ± SD. n=6. **P<0.01 vs Control; #P<0.05, ##P<0.01 vs TGF-β1; $P<0.05, $$P<0.01 vs pcDNA3.1-AR. |
Discussion
HF is a pathological condition characterized by the excessive activation of fibroblasts and the overproduction of collagen-rich ECM, leading to the progressive replacement of normal liver tissue architecture. This process culminates in impaired liver function and serves as a significant precursor to severe conditions such as liver cirrhosis, hepatocellular carcinoma, and ultimately liver failure, all of which pose substantial threats to human health and life.28 CCl4 exhibits selective toxicity toward the liver. Once CCl4 enters the body of an organism, it is metabolically activated within hepatic cells to produce reactive species, including trichloromethyl radicals. This activation triggers a series of lipid peroxidation events, which compromise the structural integrity of hepatocyte membranes. Consequently, this leads to cellular degeneration, necrosis, and eventually the development of HF.29 Furthermore, the authors’ previous studies have highlighted the critical role of AR in PF pathogenesis.13,14 This study demonstrated that AR gene knockout significantly mitigated CCl4-induced HF, which was characterized by reduced liver tissue injury, decreased collagen accumulation, and lowered expression levels of COL1A1 and MMP2. In vitro studies indicated that the suppression or inhibition of AR expression led to a notable reduction in COL1A1 and MMP2 expression in TGF-β1-stimulated hepatocytes. Conversely, increased AR expression resulted in higher expression levels of these genes under the same stimulation conditions. These findings further corroborate the crucial role AR plays in HF development, although the exact mechanisms governing this process are not fully clarified.
Studies have shown that myofibroblasts serve as a major contributor to the production of ECM elements. Hepatocytes can transition into myofibroblasts through EMT, which is a critical pathway in HF development. This EMT phenomenon not only boosts the migration and invasion potential of hepatocytes but also expedites the progression of HF.30 Studies on animal models have reported that EMT in hepatocytes contributes to the formation of myofibroblasts within the context of liver fibrosis induced by carbon tetrachloride.31,32 TGF-β1 is commonly employed in studies on liver fibrosis mechanisms to create cellular models that mimic a typical HF microenvironment. Many studies have shown that exposure of mouse hepatocytes to TGF-β1 reduces the expression of E-cadherin but increases the expression of the mesenchymal marker vimentin.33,34 This evidence indicates that TGF-β1, an inflammatory mediator, can trigger EMT in hepatocytes. Recent findings indicate that the activation of AR efficiently prevents diabetes-induced renal fibrosis.11 Furthermore, studies have demonstrated that since AR mediates EMT in the lens epithelial cells, the suppression of AR expression significantly impedes this process and, thereby, slows down cataract progression.12 Consistent with the findings of previous studies,35 the CCl4-induced murine HF model used in this study confirmed the occurrence of EMT in liver tissue. Notably, the CCl4-triggered EMT significantly reduced following the AR gene knockout. Additionally, in vitro studies demonstrated that TGF-β1 substantially induces EMT in hepatocytes. The suppression or inhibition of AR expression effectively inhibited TGF-β1-induced EMT in these cells and reduced their migratory potential. Conversely, enhanced AR expression exacerbated TGF-β1-induced EMT and promoted cell migration in hepatocytes.
Autophagy dysfunction can influence the initiation and progression of HF.36 Cells utilize autophagy as a self-regulating mechanism to respond to different stimuli. This cellular process, which is observed in a wide range of nucleated cells, plays an essential role in cell survival, differentiation, growth, and homeostatic balance. In the case of HF, autophagy demonstrates a dual functionality; increased levels of autophagic activity can lead to the activation of hepatic stellate cells, which in turn facilitates the progression of fibrosis. Conversely, excessive autophagy can inhibit the progression of fibrosis.37 Studies have shown that excessive autophagy can compromise the integrity of hepatic stellate cells, leading to senescence, reduced functionality, and impaired cellular performance. This progression ultimately leads to decreased secretion of ECM and a reduction in fibrotic processes. They suggest that impaired performance of stellate cells is ok as it prevents from fibrosis. This is not true - healthy stellate cells do have their physiological functions and reducing their functionality is not overall beneficial.38 In addition to its significant effect on the function of hepatic stellate cells during HF, autophagy has exhibited the ability to inhibit the release of interleukin-1 beta and other cytokines from Kupffer cells. This, in turn, restrains the activation of hepatic stellate cells and alleviates HF.17 Additionally, in liver-specific autophagy-deficient mice, the in vivo transition between epithelial and mesenchymal states in hepatocytes is accompanied by elevated levels of mesenchymal markers and decreased expression of epithelial markers.39 Therefore, it seems that autophagy exerts a dual influence on liver fibrosis. Pink1 and Parkin are vital for triggering mitophagy in response to mitochondrial damage. Pink1 recognizes dysfunctional mitochondria, accumulates on their outer membranes, and activates Parkin along with downstream mechanisms to facilitate mitophagy.20 Studies have demonstrated that the regulation of mitophagy via the Pink1/Parkin pathway plays a role in the development of HF.21,22 Activating this pathway can significantly curb the activation of hepatic stellate cells and attenuate the progression of HF.23 The findings suggest a dysfunction in autophagy within the context of HF pathology. The study results also revealed compromised mitophagy in the lung tissue of mice with CCl4-induced HF, characterized by reduced Pink1 and Parkin levels, lower LC3 II/I ratios, elevated P62 expression, and notable mitochondrial injury. The AR knockout substantially mitigated CCl4-induced mitophagy impairment and reduced mitochondrial damage. In vitro studies demonstrated that TGF-β1 significantly triggered inadequate mitophagy in hepatocytes, which increased ROS levels and decreased mitochondrial membrane potential and ATP synthesis. The suppressing or inhibition of the AR expression effectively counteracted TGF-β1-induced mitophagy disruption, decreased ROS levels, restored mitochondrial membrane potential, and boosted ATP production. Conversely, the AR overexpression intensified TGF-β1-induced mitophagy impairment, further increasing ROS levels and reducing mitochondrial membrane potential and ATP levels. These observations indicate that AR-regulated mitochondrial autophagy serves as a critical factor in HF development.
The AKT/mTOR pathway cascade plays an important role across various cell types and significantly influences numerous in vivo physiological and pathological processes. This pathway has been demonstrated to inhibit autophagy once it is activated.40,41 Extensive studies indicate that the activation of the AKT/mTOR signaling pathway significantly influences the regulation of autophagy.24,25 The suppression of this pathway enhances mitophagy, which alleviates the progression of HF.26 Additionally, studies have demonstrated that AR overexpression in cultured hepatocellular carcinoma cells and liver tissues from DEN-induced transgenic mouse models can activate the AKT/mTOR pathway. This activation increases the production of lactic acid and exacerbates liver inflammation, which ultimately underlies the development of hepatocellular carcinoma.42 This study revealed a significant increase in the phosphorylation of AKT and mTOR in the lung tissues of CCl4-induced HF mice. Conversely, the AR gene knockout mice exhibited significantly lower levels of phosphorylation in these proteins. The in vitro experiments indicated that TGF-β1-treated hepatocytes showed elevated AKT and mTOR phosphorylation. The suppression or inhibition of AR expression markedly attenuated the activation of the TGF-β1-induced AKT/mTOR signaling pathway. Conversely, enhanced AR expression intensified the pathway activation triggered by TGF-β1.
Conclusion
In summary, elevated AR expression was observed in both experimental animal models and cell culture systems. AR activates the AKT/mTOR signaling pathway, leading to decreased Pink1/Parkin expression. This cascade ultimately impairs mitophagy, compromises mitochondrial integrity, and prevents the reduction of mitochondrial membrane potential in hepatocytes. Consequently, this sequence of events promotes EMT in these cells and contributes significantly to fibrotic processes. Therefore, investigations into the role of AR in HF provide valuable theoretical foundations for understanding HF pathogenesis and offer new perspectives for developing innovative therapeutic strategies.
Data Sharing Statement
The data supporting the findings of this study are included within the article.
Acknowledgments
This research was supported by grants from the National Natural Science Foundation of China (No. 82304339), Projects of Anhui University Natural Science Foundation (No. KJ2021ZD0106, No. 2022AH051231), Clinical and Translational Research Project of Anhui Province (No. 202427b10020039), and Key project of Wannan Medical College (No. WK2022ZF14).
Author Contributions
All authors made a significant contribution to the work reported, whether that is in the conception, study design, execution, acquisition of data, analysis and interpretation, or in all these areas; took part in drafting, revising or critically reviewing the article; gave final approval of the version to be published; have agreed on the journal to which the article has been submitted; and agree to be accountable for all aspects of the work.
Disclosure
The authors declare no conflicts of interest related to this work.
References
1. Wells RG. Liver fibrosis: our evolving understanding. Clin Liver Dis. 2024;23(1):e0243. doi:10.1097/CLD.0000000000000243
2. Sun Z, Chen G. Impact of heterogeneity in liver matrix and intrahepatic cells on the progression of hepatic fibrosis. Tissue Cell. 2024;91:102559. doi:10.1016/j.tice.2024.102559
3. Caligiuri A, Gentilini A, Pastore M, et al. Cellular and molecular mechanisms underlying liver fibrosis regression. Cells. 2021;10(10(10):2759. doi:10.3390/cells10102759
4. Yu K, Li Q, Shi G, et al. Involvement of epithelial-mesenchymal transition in liver fibrosis. Saudi J Gastroenterol. 2018;24(1):5–11. doi:10.4103/sjg.SJG_297_17
5. Chen Y, Fan Y, Guo DY, et al. Study on the relationship between hepatic fibrosis and epithelial-mesenchymal transition in intrahepatic cells. Biomed Pharmacother. 2020;129:110413. doi:10.1016/j.biopha.2020.110413
6. Zoheiry MK, El-Ahwany EG. Role of epithelial mesenchymal transition in hepatic fibrogenesis. J Egypt Soc Parasitol. 2015;45(2):357–365. doi:10.12816/0017579
7. Shrestha N, Chand L, Han MK, et al. Glutamine inhibits CCl4 induced liver fibrosis in mice and TGF-β1 mediated epithelial-mesenchymal transition in mouse hepatocytes. Food Chem Toxicol. 2016;93:129–137. doi:10.1016/j.fct.2016.04.024
8. Zhang Q, Chang X, Wang H, et al. TGF-β1 mediated Smad signaling pathway and EMT in hepatic fibrosis induced by Nano NiO in vivo and in vitro. Environ Toxicol Int J. 2020;35(4):419–429. doi:10.1002/tox.22878
9. Singh M, Kapoor A, Bhatnagar A. Physiological and Pathological Roles of Aldose Reductase. Metabolites. 2021;11(10):655. doi:10.3390/metabo11100655
10. Ahmad S, Ahmad MFA, Khan S, et al. Exploring aldose reductase inhibitors as promising therapeutic targets for diabetes-linked disabilities. Int J Biol Macromol. 2024;280(Pt 2):135761. doi:10.1016/j.ijbiomac.2024.135761
11. He J, Gao HX, Yang N, et al. The aldose reductase inhibitor epalrestat exerts nephritic protection on diabetic nephropathy in db/db mice through metabolic modulation. Acta Pharmacol Sin. 2019;40(1):86–97. doi:10.1038/s41401-018-0043-5
12. Chang KC, Shieh B, Petrash JM. Influence of aldose reductase on epithelial-to-mesenchymal transition signaling in lens epithelial cells. Chem BiolInteract. 2017;276:149–154.
13. Xianwei L, Shen Y, Yining L, et al. Amelioration of bleomycin-induced pulmonary fibrosis of rats by an aldose reductase inhibitor, epalrestat. Korean J Physiol Pharmacol. 2015;19(5):401–411. doi:10.4196/kjpp.2015.19.5.401
14. Zhang Z, Li Z, Chen X, et al. Effect of AR gene-specific knockout on the process of radiation-induced pulmonary fibrosis and its mechanism. Cell Mol Biol. 2023;69(5):156–162. doi:10.14715/cmb/2023.69.5.24
15. Wang H, Luo W, Chen H, et al. Mitochondrial dynamics and mitochondrial autophagy: molecular structure, orchestrating mechanism and related disorders. Mitochondrion. 2024;75:101847. doi:10.1016/j.mito.2024.101847
16. Li W, Jiang Y, Yu TT, et al. Lycopene improves autophagy and attenuates carbon tetrachloride-induced hepatic fibrosis in rats. Croat Med J. 2023;64(4):243–255. doi:10.3325/cmj.2023.64.243
17. Chen W, Zhang Z, Yao Z, et al. Activation of autophagy is required for Oroxylin A to alleviate carbon tetrachloride-induced liver fibrosis and hepatic stellate cell activation. Int Immunopharmacol. 2018;56:148–155. doi:10.1016/j.intimp.2018.01.029
18. Hao Y, Feng D, Ye H, et al. Nobiletin alleviated epithelial-mesenchymal transition of hepatocytes in liver fibrosis based on autophagy-hippo/YAP Pathway. Mol Nutr Food Res. 2024;68(3):e2300529. doi:10.1002/mnfr.202300529
19. Kong D, Zhang Z, Chen L, et al. Curcumin blunts epithelial-mesenchymal transition of hepatocytes to alleviate hepatic fibrosis through regulating oxidative stress and autophagy. Redox Biol. 2020;36:101600. doi:10.1016/j.redox.2020.101600
20. Narendra DP, Youle RJ. The role of PINK1-Parkin in mitochondrial quality control. Nat Cell Biol. 2024;26(10):1639–1651. doi:10.1038/s41556-024-01513-9
21. Li R, Wang Z, Wang Y, et al. SIRT3 regulates mitophagy in liver fibrosis through deacetylation of PINK1/NIPSNAP1. J Cell Physiol. 2023;238(9):2090–2102. doi:10.1002/jcp.31069
22. Deng J, Long J, Yang Y, et al. Gentiana decoction inhibits liver fibrosis and the activation of hepatic stellate cells via upregulating the expression of Parkin. Fitoterapia. 2024;178:106170. doi:10.1016/j.fitote.2024.106170
23. Dou SD, Zhang JN, Xie XL, et al. MitoQ inhibits hepatic stellate cell activation and liver fibrosis by enhancing PINK1/parkin-mediated mitophagy. Open Med. 2021;16(1):1718–1727. doi:10.1515/med-2021-0394
24. He Z, Chen S, Pan T, et al. Ginsenoside Rg2 ameliorating CDAHFD-induced hepatic fibrosis by regulating AKT/mTOR-mediated autophagy. J Agric Food Chem. 2022;70(6):1911–1922. doi:10.1021/acs.jafc.1c07578
25. Liu Y, Bi YM, Pan T, et al. Ethyl acetate fraction of dicliptera chinensis (L.) Juss. ameliorates liver fibrosis by inducing autophagy via PI3K/AKT/mTOR/p70S6K signaling pathway. Chin J Integr Med. 2022;28(1):60–68. doi:10.1007/s11655-021-3298-5
26. Liu R, Zhang Y, Liu M, et al. Natural molecule isoliquiritigenin mitigates MASH and liver fibrosis in mice by promoting autophagy through the PI3K/Akt signaling pathway. J Nutr Biochem. 2025;136:109808. doi:10.1016/j.jnutbio.2024.109808
27. Kishore TKK, Ganugula R, Gade DR, et al. Gedunin abrogates aldose reductase, PI3K/Akt/mToR, and NF-κB signaling pathways to inhibit angiogenesis in a hamster model of oral carcinogenesis. Tumour Biol. 2016;37(2):2083–2093. doi:10.1007/s13277-015-4003-0
28. Watson A, Petitjean L, Petitjean M, et al. Liver fibrosis phenotyping and severity scoring by quantitative image analysis of biopsy slides. Liver Int. 2024;44(2):399–410. doi:10.1111/liv.15768
29. Sun YF, Pan HH, Xia ZN, et al. Alisma Shugan Decoction attenuates hepatic fibrosis and endoplasmic reticulum stress in mice with carbon tetrachloride-induced fibrosis. Afr Health Sci. 2023;23(2):422–434. doi:10.4314/ahs.v23i2.49
30. Zhang K, Zhang M, Yao Q, et al. The hepatocyte-specifically expressed lnc-HSER alleviates hepatic fibrosis by inhibiting hepatocyte apoptosis and epithelial-mesenchymal transition [J]. Theranostics. 2019;9(25):7566–7582. doi:10.7150/thno.36942
31. Feng S, Tong H, Gao JH, et al. Anti-inflammation treatment for protection of hepatocytes and amelioration of hepatic fibrosis in rats. Exp Ther Med. 2021;22(5):1213. doi:10.3892/etm.2021.10647
32. Zeisberg M, Yang C, Martino M, et al. Fibroblasts derive from hepatocytes in liver fibrosis via epithelial to mesenchymal transition. J Biol Chem. 2007;282(32):23337–23347. doi:10.1074/jbc.M700194200
33. Kaimori A, Potter JJ, Choti M, et al. Histone deacetylase inhibition suppresses the transforming growth factor beta1-induced epithelial-to-mesenchymal transition in hepatocytes. Hepatology. 2010;52(3):1033–1045. doi:10.1002/hep.23765
34. Pan X, Wang X, Lei W, et al. Nitric oxide suppresses transforming growth factor-beta1-induced epithelial-to-mesenchymal transition and apoptosis in mouse hepatocytes. Hepatology. 2009;50(5):1577–1587. doi:10.1002/hep.23156
35. Zhang B, Wu F, Li P, et al. ARRDC3 inhibits liver fibrosis and epithelial-to-mesenchymal transition via the ITGB4/PI3K/Akt signaling pathway. Immunopharmacol Immunotoxicol. 2023;45(2):160–171. doi:10.1080/08923973.2022.2128369
36. Liu XY, Zhang W, Ma BF, et al. Advances in research on the effectiveness and mechanism of active ingredients from traditional chinese medicine in regulating hepatic stellate cells autophagy against hepatic fibrosis. Drug Des Devel Ther. 2024;Volume 18:2715–2727. doi:10.2147/DDDT.S467480
37. Li Q, Lin Y, Liang G, et al. Autophagy and senescence: the molecular mechanisms and implications in liver diseases. Int J Mol Sci. 2023;24(23):16880. doi:10.3390/ijms242316880
38. Lodder J, Denaës T, Chobert MN, et al. Macrophage autophagy protects against liver fibrosis in mice. Autophagy. 2015;11(8):1280–1292. doi:10.1080/15548627.2015.1058473
39. Grassi G, Di Caprio G, Santangelo L, et al. Autophagy regulates hepatocyte identity and epithelial-to-mesenchymal and mesenchymal-to-epithelial transitions promoting snail degradation. Cell Death Dis. 2015;6(9):e1880. doi:10.1038/cddis.2015.249
40. Chen H, Zhu T, Huang X, et al. Xanthatin suppresses proliferation and tumorigenicity of glioma cells through autophagy inhibition via activation of the PI3K-Akt-mTOR pathway. Pharmacol Res Perspect. 2023;11(1):e01041. doi:10.1002/prp2.1041
41. Xu Z, Han X, Ou D, et al. Targeting PI3K/AKT/mTOR-mediated autophagy for tumor therapy. Appl Microbiol Biotechnol. 2020;104(2):575–587. doi:10.1007/s00253-019-10257-8
42. Zhao JX, Yuan YW, Cai C-F, et al. Aldose reductase interacts with AKT1 to augment hepatic AKT/mTOR signaling and promote hepatocarcinogenesis. Oncotarget. 2017;8(40):66987–67000. doi:10.18632/oncotarget.17791
 © 2025 The Author(s). This work is published and licensed by Dove Medical Press Limited. The
full terms of this license are available at https://www.dovepress.com/terms
and incorporate the Creative Commons Attribution
- Non Commercial (unported, 4.0) License.
By accessing the work you hereby accept the Terms. Non-commercial uses of the work are permitted
without any further permission from Dove Medical Press Limited, provided the work is properly
attributed. For permission for commercial use of this work, please see paragraphs 4.2 and 5 of our Terms.
© 2025 The Author(s). This work is published and licensed by Dove Medical Press Limited. The
full terms of this license are available at https://www.dovepress.com/terms
and incorporate the Creative Commons Attribution
- Non Commercial (unported, 4.0) License.
By accessing the work you hereby accept the Terms. Non-commercial uses of the work are permitted
without any further permission from Dove Medical Press Limited, provided the work is properly
attributed. For permission for commercial use of this work, please see paragraphs 4.2 and 5 of our Terms.