Back to Journals » Clinical Ophthalmology » Volume 19
Agreement Between the Smartphone Application Farnsworth D-15 Test and the Standard Farnsworth D-15 Test for Color Vision Assessment
Authors Thammakumpee K, Thammakumpee K, Thammakumpee K, Tiantanyatip S
Received 31 July 2025
Accepted for publication 1 December 2025
Published 5 December 2025 Volume 2025:19 Pages 4447—4454
DOI https://doi.org/10.2147/OPTH.S557391
Checked for plagiarism Yes
Review by Single anonymous peer review
Peer reviewer comments 4
Editor who approved publication: Dr John Miller
Kanyarat Thammakumpee,1 Katkanit Thammakumpee,2 Koranat Thammakumpee,3 Soyci Tiantanyatip4
1Department of Ophthalmology, Faculty of Medicine, Burapha University, Chonburi, Thailand; 2Department of Internal Medicine, Faculty of Medicine, Burapha University, Chonburi, Thailand; 3Division of Electrical Engineering, Electricity Generating Authority of Thailand (EGAT), Nonthaburi, Thailand; 4Department of Ophthalmology, Faculty of Medicine, Chulabhorn International College of Medicine, Thammasat University, Pathum Thani, Thailand
Correspondence: Soyci Tiantanyatip, Department of Ophthalmology, Faculty of Medicine, Chulabhorn International College of Medicine, Thammasat University, Pathum Thani, Thailand, Tel +66 8 3199 2506, Email [email protected]
Purpose: The primary aim of this study was to evaluate the level of agreement in color vision assessment between the smartphone application Farnsworth D-15 (FD-15) test and the standard FD-15 test.
Materials and Methods: A cross-sectional study was conducted involving participants aged ≥ 18 years. Inclusion criteria included the ability to follow test instructions and provide informed consent. Eyes with visual acuity worse than 20/200 were excluded. Standardized score sheets were used for both tests to calculate the color confusion index (CCI). Agreement between the two tests was assessed using the Pearson correlation coefficient, adjusted R-squared (R2), calibration slope, calibration-in-the-large (CITL), and root mean square error (RMSE), and Bland–Altman plots.
Results: A total of 200 eyes from 101 participants were included in the study. The CCI data showed a strong correlation (Pearson correlation coefficient = 0.9924). The adjusted R2 of 0.9839 indicated high explanatory power. A calibration slope of 0.9861 and CITL of 0.0957 indicated minimal proportional and systematic bias, respectively. RMSE was 0.1211, within acceptable limits. The Bland–Altman analysis demonstrated limits of agreement within clinically acceptable range.
Conclusion: The smartphone application FD-15 test demonstrated high agreement with the standard FD-15 test. This study serves as a pilot validation demonstrating the potential of the smartphone-based FD-15 application for color vision screening. However, the current findings should be interpreted considering the use of a single smartphone model and the low prevalence of color vision defects. These findings support its potential utility as a practical and accessible tool for remote care and occupational health assessments.
Keywords: color vision, color vision deficiency, farnsworth D-15 test, smartphone application farnsworth D-15 test
Introduction
Color vision deficiency (CVD) is a global public health concern. It may be congenital or acquired. The prevalence of congenital CVD is approximately 8% in men and 0.4% in women of European Caucasian descent and 4.97% in Chinese men.1–3 CVD can have considerable socioeconomic implications, impacting employment, independence, quality of life, education, and safety.2
Color vision assessment is essential in ophthalmic practice, aiding clinicians in evaluating CVD severity, guiding investigations, determining treatment urgency, and monitoring progression. Although the anomaloscope is considered the gold standard for color vision testing, it is expensive and requires specialized expertise.4
The standard Farnsworth D-15 (FD-15) test is a widely used screening tool for moderate to severe CVD.5 It can also distinguish types of CVD—protan, deutan, and tritan—based on color confusion axes. However, it requires physical color caps and clinical personnel, limiting accessibility for individuals in rural areas, older adults, or those with mobility limitations6 It is less suitable for young children and cannot reliably differentiate mild CVD from normal trichromacy.
Smartphone-based color vision testing offers potential advantages in accessibility, portability, and remote monitoring, particularly for teleophthalmology and occupational vision screening. The smartphone application FD-15 test has rarely been validated against the standard FD-15 test. Accordingly, the primary objective of this study was to evaluate the level of agreement in color vision assessment between the smartphone application FD-15 test and the standard FD-15 test. Several studies validating digital versions on tablets or monitors, limited evidence exists for smartphone-based validation. However, validation of color rendering accuracy across different smartphone models remains necessary, as display characteristics may vary between devices.
Materials and Methods
Ethical Approval
This study protocol adhered to the tenets of the Declaration of Helsinki and was approved by the Ethics Committee of the Burapha University Institutional Review Board, Chonburi (HS073/2567). All participants provided informed consent prior to inclusion, and their privacy was protected. The purpose of the study and the examination process were clearly explained to all participants.
Participants
This cross-sectional study was conducted at the outpatient clinic of Burapha University Hospital, Chonburi. Participants aged 18 years or older were recruited from November 2024 to January 2025. Inclusion criteria included the ability to follow test instructions and provide informed consent. Eyes with visual acuity worse than 20/200 and those with other ocular pathologies that could affect color vision, such as nuclear sclerosis or media opacity, were excluded to minimize confounding effects from ocular diseases were excluded. Demographic data, including age, sex, and family history of CVD, were collected.
Color Vision Assessment
Participants underwent color vision testing using the standard FD-15 test in each eye, beginning with the right eye followed by the left eye. Participants underwent color vision testing using the standard FD-15 test first, followed by the smartphone application FD-15 test. Both tests were performed under the same room and lighting conditions by a single examiner. Presbyopic correction was also provided all participants when necessary to reduce the influence of age-related refractive changes.
The standard FD-15 test (Figure 1) consists of 16 color caps, including one fixed reference cap. Participants were presented with a fixed reference cap and were instructed to arrange the remaining caps in order of closest color similarity to the reference cap. Once the arrangement was complete, the sequence was transcribed onto a standardized score sheet to determine the number of “crossings”, defined as connections between caps separated by four or more positions in the correct sequence. The standardized score sheet is a circular chart in which caps are numbered and lines are drawn between consecutively selected caps, allowing visual identification of error patterns and crossing lines. Connections between caps fewer than four positions apart were considered “small errors” Swapped adjacent caps were not counted as errors. A test was considered passed if (1) all caps were arranged in the correct order, (2) only one crossing was present, or (3) two small errors occurred without any crossings.4,5,7
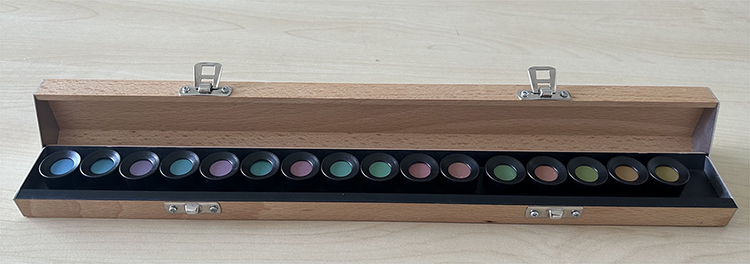 |
Figure 1 The standard FD-15 test. |
The smartphone application FD-15 test (Figure 2) was developed as a mobile-based tool using a multicolor display and installed on an iPhone 14 (iOS 17.1). Screen brightness was set to maximum and both the True Tone and Night Shift functions disabled to ensure consistent color rendering. The smartphone application FD-15 test consists of 16 color caps, including one fixed reference cap. Participants were presented with a fixed reference cap and were instructed to arrange the remaining caps in order of closest color similarity to the reference cap. After the arrangement was completed, the sequence was transcribed onto a standardized score sheet (similar to the standard FD-15 test). The definitions of “crossings” and “small errors” were the same as for the standard FD-15 test. The scoring rule followed the original Farnsworth method: test was considered passed if (1) all caps were arranged in the correct order, (2) only one crossing was present, or (3) two small errors occurred without any crossings. Standardized score sheets from both tests were used to calculate the color confusion index (CCI).
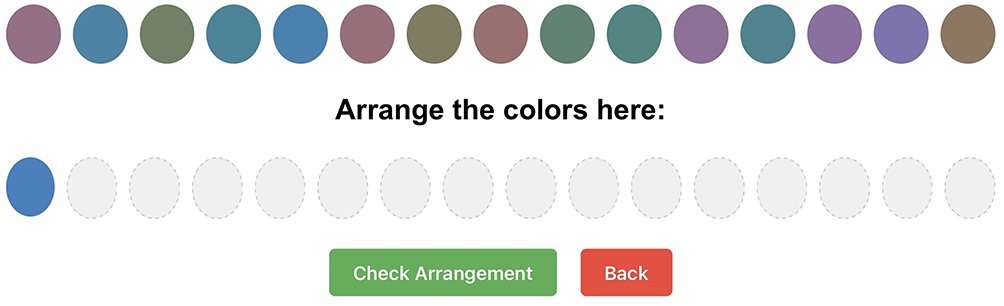 |
Figure 2 The smartphone application FD-15 test. |
The CCI was calculated as the ratio of the subject’s total color difference score to the mean score of normal observers The calculation method followed the quantitative approach, in which the total color difference score was derived from the vector distance between adjacent caps in the Farnsworth D-15 arrangement.8–10
The CCI is an indication of the severity of color-vision defect. Normality of continuous variables was assessed using the Shapiro–Wilk test. The main outcome measure was the level of agreement between the smartphone application FD-15 test and the standard FD-15 test. Color vision error was defined as the inability to correctly arrange all 15 color caps in perfect sequential order.
Statistical Analysis
Normally distributed continuous data are presented as mean ± standard deviation (SD), while non-normally distributed continuous data are shown as median and interquartile range. The paired t-test or the Mann–Whitney U-test, as appropriate, was used to compare continuous variables. Categorical variables are reported as frequency and percentage. Normality of continuous variables was assessed using the Shapiro–Wilk test.
Agreement between the two tests was assessed using multiple complementary approaches. The Pearson correlation coefficient (r) was calculated to evaluate the linear association between the CCI values from the smartphone-based and standard FD-15 tests, while the adjusted R-squared (R2) was used to quantify the proportion of shared variance between the two datasets, accounting for model complexity.11 Correlation plots and Bland–Altman scatterplots were used to show the relationships between CCI data sets.
We also included calibration analyses to assess predictive agreement: the calibration slope reflects proportional bias, and the calibration-in-the-large (CITL) indicates systematic offset. Values close to 1 for slope and 0 for CITL suggest good calibration and minimal systematic error.11 The root mean square error (RMSE) was calculated to measure the absolute average deviation between paired CCI values; lower RMSE values indicate closer correspondence between methods.
Diagnostic accuracy indices—including sensitivity, specificity, positive predictive value (PPV), and negative predictive value (NPV)—were calculated using the standard FD-15 test as the reference, with 95% confidence intervals (CIs). In this study, PPV and NPV values referred to classification discrepancies between the Smartphone Application FD-15 Test and the Standard FD-15 Test. Statistical analyses were performed using STATA version 16.1 (StataCorp LLC, College Station, TX, USA). A p-value of < 0.05 was considered statistically significant.
Results
Demographic Data
A total of 101 participants were enrolled, including 35 males (34.7%) and 66 females (65.3%). Although 202 eyes were initially assessed, one eye from each of two participants was excluded due to visual acuity of no light perception. Thus, 200 eyes were included in the final analysis. The mean age was 47.81 ± 17.02 years. A family history of CVD was reported in two participants (2.0%). Detailed demographic data is summarized in Table 1.
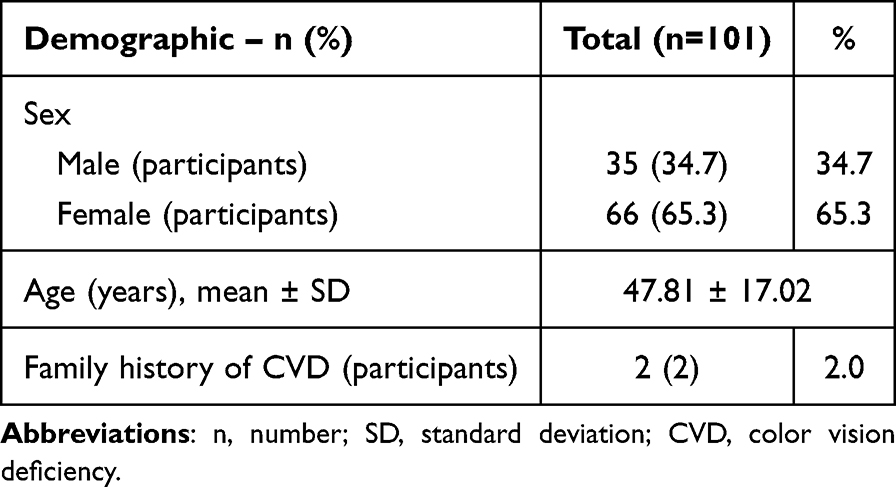 |
Table 1 Demographic Data |
Comparison of Color Vision Test Performance
CCI results showed no statistically significant difference between the two tests (mean ± SD: 1.07 ± 0.36 vs 1.08 ± 0.38 for the smartphone application FD-15 test and the standard FD-15 test, respectively; p = 0.053).
Diagnostic Accuracy
Among the 200 eyes, seven eyes did not pass both tests (true positives), one eye was a false positive, and no false negatives were observed. Thus, 192 eyes passed both tests. The smartphone application FD-15 test demonstrated high diagnostic accuracy. Sensitivity was 100.00% (95% CI: 59.00–100.00), and specificity was 99.50% (95% CI: 97.10–100.00). PPV was 95.50% (95% CI: 73.00–99.30), and NPV was 100.00%. A summary of the diagnostic accuracy of the smartphone application FD-15 test compared with the standard FD-15 test is provided in Table 2.
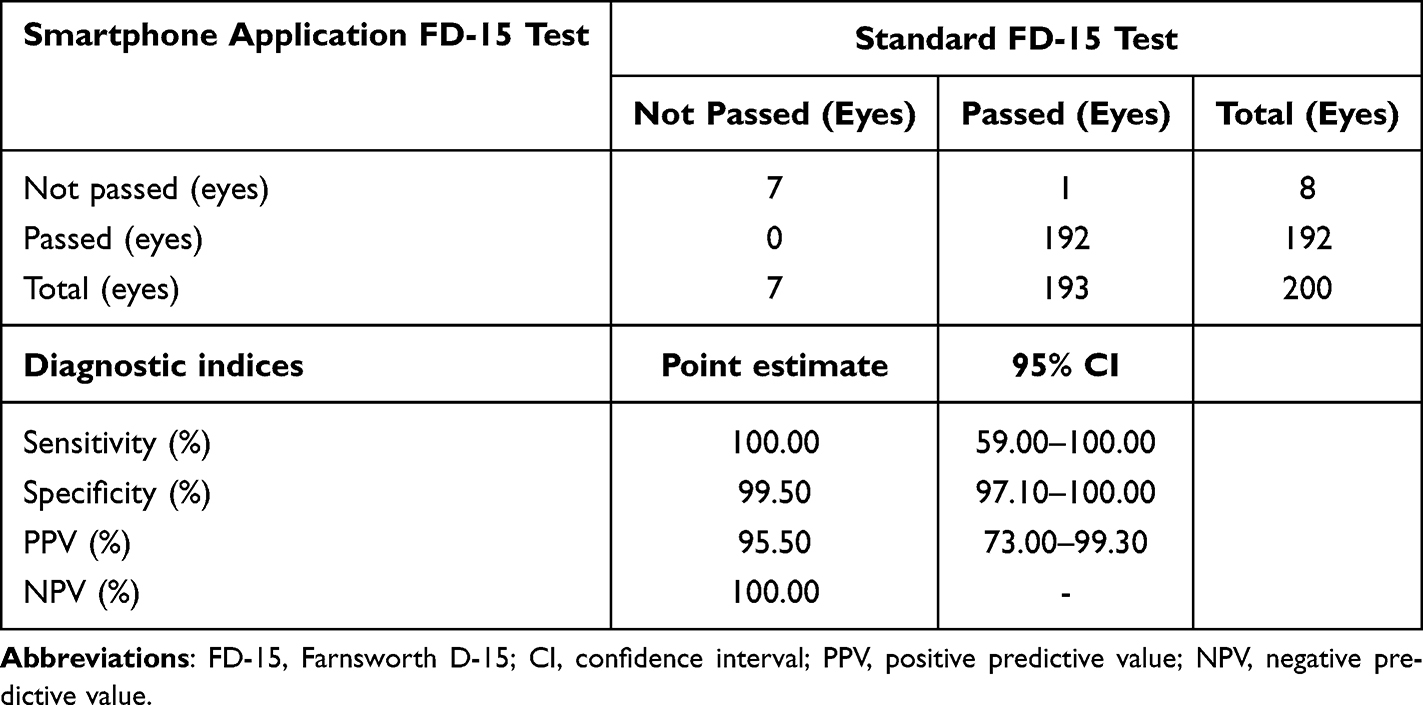 |
Table 2 Diagnostic Accuracy of the Smartphone Application FD-15 Test Compared with the Standard FD-15 Test |
Agreement Metrics
The CCI values obtained from both the smartphone-based and standard FD-15 tests showed a positive correlation. The CCI data points demonstrated strong correlation (Pearson correlation coefficient = 0.9924). The adjusted R2 value of 0.9839 indicates high explanatory power. A calibration slope of 0.9861 and CITL of 0.0957 indicated minimal proportional and systematic bias, respectively. RMSE was 0.1211, which was within acceptable limits. Agreement metrics between the smartphone application FD-15 test and the standard FD-15 test are summarized in Table 3. Scatter plot showing the relationship between the CCI results from the smartphone FD-15 test and the standard FD-15 test (Figure 3). Figure 3 is presented alongside Table 3 to visually complement the numerical agreement metrics, allowing readers to better appreciate the consistency between the two tests. The correlation plots and Bland–Altman difference plots for these comparisons are shown in Figure 4.
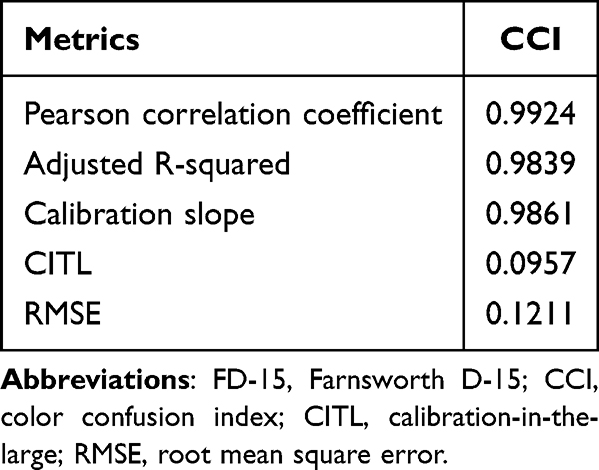 |
Table 3 Agreement Metrics Between the Smartphone Application FD-15 Test and the Standard FD-15 Test |
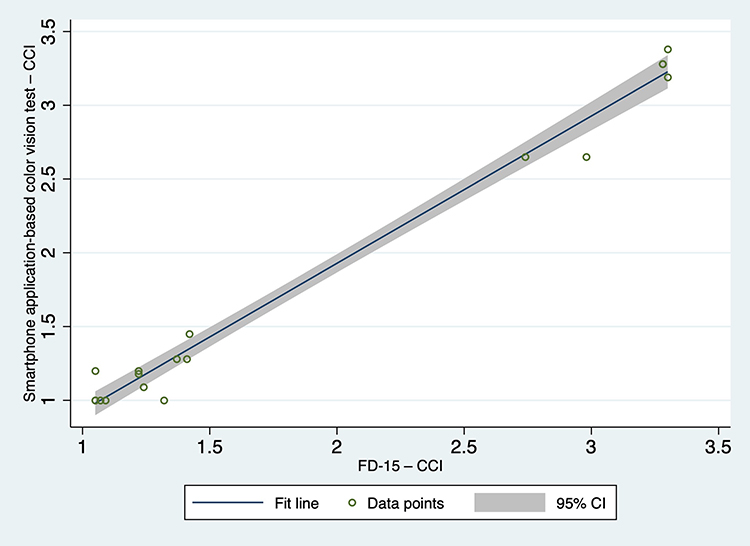 |
Figure 3 Correlation of CCI between the smartphone application FD-15 test and the standard FD-15 test in 18 eyes with color vision errors identified by the standard FD-15 test (Pearson r = 0.9924). |
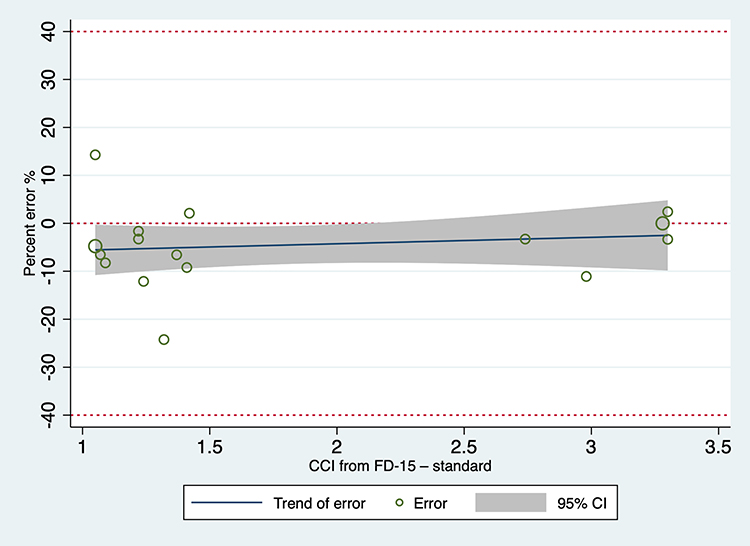 |
Figure 4 A Bland–Altman plot demonstrating the differences in CCI between the smartphone application FD-15 test and the standard. |
Correlation of CCI Between the Two Tests in 18 Eyes with Color Vision Errors Tested by the Standard FD-15 Test
Among 18 eyes identified with color vision errors using the standard FD-15 test, scatter plots (Figure 3) illustrated the correlation between the smartphone application FD-15 test and the standard FD-15 test. The data showed tight clustering around the identity line, reinforcing the high agreement between both tests.
Type of CVD Identification Between the Two Tests
Among these, 18 eyes showed imperfect color arrangement on the standard FD-15 test. Of these, 11 eyes achieved scores within the pass criteria and were considered normal, while 7 eyes demonstrated arrangement errors that did not meet the pass criteria and were therefore classified as having CVD.
Of the seven eyes that did not pass the standard FD-15 test, five eyes were consistent with deuteranopia, one eye with protanopia, and one eye showed non-specific color confusion axes. The smartphone application FD-15 test correctly identified all these eyes, except for one eye, which was incorrectly classified as deuteranopia (which was classified as protanopia by the standard FD-15 test).
Safety
No adverse events related to color vision assessment were reported.
Discussion
This study demonstrates the reliability of the smartphone application FD-15 test compared with the standard FD-15 test. Our results show high agreement between the two tests.
The smartphone application FD-15 test showed high diagnostic accuracy with a sensitivity of 100.00% and a specificity of 99.50%, with both PPV and NPV exceeding 95.00%. The agreement between the CCI obtained from the smartphone application FD-15 test and the standard FD-15 test was high. All agreement metrics in our study confirmed that the CCI values obtained from the smartphone application FD-15 test were highly comparable to those from the standard FD-15 test. In a subgroup analysis of 18 eyes with color vision errors, tested by the standard FD-15 test, high agreement between the two tests was also observed.
The Bland–Altman analysis further confirmed this finding, showing that the mean difference between the two tests was small and that the limits of agreement were within the clinically acceptable range. However, as previously noted, caution is warranted when interpreting results near the lower CCI values (approximately <1.5), since the standard FD-15 test has recognized limitations in detecting mild color vision deficiencies. These findings suggest that while the smartphone application FD-15 test provides highly comparable results to the standard FD-15 test, its use in individuals with subtle or borderline color discrimination deficits should be interpreted with care.
Our findings are consistent with previous studies showing high agreement between digital versions of the FD-15 test. (eg, iPad and computer) and the standard FD-15 test, which reported comparable accuracy and repeatability.12,13 However, unlike those studies, we specifically validated a smartphone-based FD-15 test. However, our study extends this evidence to a smartphone-based platform, offering greater portability and potential for remote screening.
This study has several strengths. First, it directly compared the smartphone application FD-15 test with the standard FD-15 test. The use of comprehensive agreement metrics (Pearson correlation coefficient, adjusted R2, calibration slope, CITL, and RMSE) provides a robust statistical validation. Additionally, the study was conducted under controlled conditions, with consistent lighting, a single trained examiner, and appropriate refractive correction, which strengthens internal validity. Finally, the smartphone application FD-15 test offers a scalable and practical solution for diverse applications, including remote care and occupational health assessments. It may also be beneficial for occupational vision screening in industrial settings and for periodic monitoring of patients with optic neuritis or those receiving color vision–affecting medications such as ethambutol.
Despite these promising findings, some limitations should be acknowledged. First, only one type of smartphone device was used (iPhone 14, iOS 17.1), which may limit generalizability to other devices or platforms. Second, our study had a relatively low proportion of eyes that did not pass the standard FD-15 test. Lastly, the study was conducted under controlled indoor lighting by a single trained examiner, which may not reflect real-world variability. The future studies should include multiple smartphone models, variable lighting conditions.
Conclusions
The smartphone application FD-15 test demonstrated high agreement with the standard FD-15 test. This study serves as a pilot validation demonstrating the potential of the smartphone-based FD-15 application for color vision screening. However, the current findings should be interpreted considering the use of a single smartphone model and the low prevalence of color vision defects. These findings support its potential utility as a practical and accessible tool for remote care and occupational health assessments.
Acknowledgments
The authors would like to thank Dr. Chayantorn Patumanon for his advice regarding statistical analysis.
Funding
This study was supported by the Faculty of Medicine, Burapha University, Chonburi, Thailand.
Disclosure
The authors declare that they have no competing interests.
References
1. Birch J. Worldwide prevalence of red-green color deficiency. J Opt Soc Am A. 2012;29(3):313. doi:10.1364/JOSAA.29.000313
2. Spalding JA. Colour vision deficiency in the medical profession. Br J Gen Pract J R Coll Gen Pract. 1999;49(443):469–475.
3. Chan E, Mao WS. Colour-Blindness among the Chinese. Br J Ophthalmol. 1950;34(12):744–745. doi:10.1136/bjo.34.12.744
4. Swanson W, Cohen J. Color vision. Ophthalmol Clin N Am. 2003;16(2):179–203. doi:10.1016/S0896-1549(03)00004-X
5. Linksz A. The Farnsworth Panel D-15 Test. Am J Ophthalmol. 1966;62(1):27–37. doi:10.1016/0002-9394(66)91673-4
6. Dain SJ, Atchison DA, Hovis JK. Limitations and precautions in the use of the Farnsworth-Munsell dichotomous D-15 test. Optom Vis Sci. 2019;96(9):695–705. doi:10.1097/OPX.0000000000001420
7. Evans BEW, Rodriguez‐Carmona M, Barbur JL. Color vision assessment‐1: visual signals that affect the results of the Farnsworth D‐15 test. Color Res Appl. 2021;46(1):7–20. doi:10.1002/col.22596
8. Vingrys AJ, King-Smith PE. A quantitative scoring technique for panel tests of color vision. Invest Ophthalmol Vis Sci. 1988;29(1):50–63.
9. Shoji T, Sakurai Y, Chihara E, Nishikawa S, Omae K. Reference intervals and discrimination values of the Lanthony desaturated D-15 panel test in young to middle-aged Japanese army officials: the Okubo Color Study Report 1. Eye. 2009;23(6):1329–1335. doi:10.1038/eye.2008.292
10. Bowman KJ, Collins MJ, Henry CJ. The effect of age on performance on the Panel D-15 and Desaturated D-15: a quantitative evaluation. In: Verriest G, editor. Colour Vision Deficiencies VII. Documenta Ophthalmologica Proceedings Series. Vol. 39. Dordrecht: Springer; 1984:423–431.
11. Tan LJ. Confidence Intervals for Comparison of the Squared Multiple Correlation Coefficients of Non-Nested Models. The University of Western Ontario; 2012.
12. Almustanyir A, Alduhayan R, Alhassan M, Hovis JK. Clinical analysis of the Konan–Waggoner D15 color vision test using the Surface-Pro display. J Opt Soc Am A. 2023;40(3):A91. doi:10.1364/JOSAA.477206
13. Dain SJ, Motlagh MRK, Chatterjee G. Colour vision testing on modern digital displays: validation and recommendations. Journal of the Optical Society of America A. 2021;38(6):A1–A11.
 © 2025 The Author(s). This work is published and licensed by Dove Medical Press Limited. The
full terms of this license are available at https://www.dovepress.com/terms
and incorporate the Creative Commons Attribution
- Non Commercial (unported, 4.0) License.
By accessing the work you hereby accept the Terms. Non-commercial uses of the work are permitted
without any further permission from Dove Medical Press Limited, provided the work is properly
attributed. For permission for commercial use of this work, please see paragraphs 4.2 and 5 of our Terms.
© 2025 The Author(s). This work is published and licensed by Dove Medical Press Limited. The
full terms of this license are available at https://www.dovepress.com/terms
and incorporate the Creative Commons Attribution
- Non Commercial (unported, 4.0) License.
By accessing the work you hereby accept the Terms. Non-commercial uses of the work are permitted
without any further permission from Dove Medical Press Limited, provided the work is properly
attributed. For permission for commercial use of this work, please see paragraphs 4.2 and 5 of our Terms.