Back to Journals » Clinical Ophthalmology » Volume 12
Agreement between retinal images obtained via smartphones and images obtained with retinal cameras or fundoscopic exams – systematic review and meta-analysis
Authors Vilela MAP ![]() , Valença FM
, Valença FM ![]() , Barreto PKM, Amaral CEV, Pellanda LC
, Barreto PKM, Amaral CEV, Pellanda LC
Received 31 July 2018
Accepted for publication 10 October 2018
Published 11 December 2018 Volume 2018:12 Pages 2581—2589
DOI https://doi.org/10.2147/OPTH.S182022
Checked for plagiarism Yes
Review by Single anonymous peer review
Peer reviewer comments 2
Editor who approved publication: Dr Scott Fraser
Manuel AP Vilela,1,2 Felipe M Valença,1 Pedro KM Barreto,1 Carlos EV Amaral,1 Lúcia C Pellanda1,2
1Federal University of Health Sciences of Porto Alegre, Porto Alegre, Rio Grande do Sul, Brazil; 2Institute of Cardiology, Cardiology University Foundation, Porto Alegre, Rio Grande do Sul, Brazil
Background: Smartphone fundoscopy is a new option for visualizing the ocular fundus but must be validated before being included in population-based examinations. Our aim was to evaluate the quality of fundoscopic images obtained via smartphone and to compare their agreement with retinal camera images or clinical examination.
Methods: The database for this study included all observational studies with smartphone fundoscopy that have comparative analyses with the gold standard methods.
Results: Out of 121 potentially relevant studies, nine were included in this analysis, compris- ing a total of 4,219 eyes. Mean age was 56.6 years (SD±8.5). Combined kappa (κ) agreement statistics were equal to 77.77% (95% CI: 70.34%, 83.70%). No heterogeneity was measured by random effects (I2=zero).
Conclusion: Fundoscopic images obtained by using smartphones have substantial agreement with gold standards for clinical or photographic exams.
Keywords: smartphones, fundoscopy, ophthalmoscopy
Introduction
Smartphones will be used by 2.87 billion people by 2020.1 Searching PubMed for articles containing the terms smartphones and medicine led to the detection of 2,588 texts, 194 of which relate to clinical trials.2 PROSPERO (“International Prospective Register of Systematic Reviews”) has 162 systematic reviews registered.3 Hundreds of applications for use in ophthalmology are available, many intended for examining patients. Their cost, portability, and available or added functions are transforming smartphones into a medical, diagnostic, and management tool. Their use in obtaining retinal images has drawn increasing interest, both as a reading instrument and also for capturing images.4–8 In particular, the use of this resource in underprivileged populations or populations without regular access to ophthalmic exams, or as a means of expanding screening of diseases involving higher prevalence of blindness (such as diabetic retinopathy or glaucoma) has been predominant in published articles.9,10
Despite its recognition, fundoscopy is rarely used by physicians who are not ophthalmologists. This is due to technical difficulties and lack of training.11,12 On the other hand, early examination has been recognized as a proven practice for avoiding harm arising in prevalent situations, as well as for its potential to identify prognostic markers. This has been the case with diabetes,13 arterial hypertension,14 prematurity,15 glaucoma,16 among many other conditions.10,17 The simplicity of smartphone fundoscopy greatly scales up the use and availability of this resource.
However, this method lacks validation defining the extent of its applicability. The objective of this systematic review was therefore to evaluate the performance of fundoscopic images obtained via smartphones and to compare their agreement when captured simultaneously by retinal cameras or direct fundoscopy and/or posterior segment biomicroscopy.
Methods
Protocol and registration
This review was developed in accordance with standards established by the “Cochrane” diagnostic test accuracy reviews (COCHRANE),18 “Preferred reporting items for systematic reviews and meta-analysis” (PRISMA),19 and the “Meta-analysis of Observational Studies in Epidemiology” (MOOSE) statements20 and has been registered on the PROSPERO database with the number: CRD42018095545.21
Elegibility criteria
The database for this study included observational studies – cohort, cross-sectional, or case–control studies – baseline results of randomized or non-randomized clinical trials, or observational follow-up after clinical trials assessing the quality of the retina images obtained with smartphones when compared to those captured by methods considered as gold standards, such as digital retinography and/or posterior segment biomicroscopy, with statistical meta-analysis for pooled results. If a study contained multiple publications (or sub-studies), only the most recent publication was included, while the remaining publications were used for supplemental information.
Information sources
All articles published up until May 2018 held on MEDLINE (accessed via PubMed), Google Scholar, Scopus, Web of Science, LILACS (“Latin American and Caribbean Health Sciences Literature”), SCIELO (“Scientific Electronic Library Online), COCHRANE Central Library, Open Gray, as well as the bibliography cited in review and original papers were searched. There was no language or filter restriction.
Search
The search strategy developed for PubMed is detailed in Table S1.
Study selection
Two investigators (MAPV and FMV) independently evaluated titles and abstracts of all articles retrieved by the search strategy. All abstracts providing sufficient information regarding inclusion and exclusion criteria were selected for full-text evaluation. When abstracts did not provide adequate information, the entire text was assessed. In the second phase, the same reviewers independently evaluated these full-text articles and made their selection in accordance with the eligibility criteria. Disagreements between reviewers were resolved by consensus, and, if a disagreement persisted, it was resolved by a third reviewer (LCP). Patient recruitment periods and areas were evaluated in order to avoid possible double counting of patients included in more than one report by the same authors/working groups. The same two reviewers independently conducted data extraction, including methodological characteristics of the studies, kappa (κ) agreement, and related factors using standardized forms.
Risk of bias
Risk of bias and applicability were assessed in each study according to the Quality Assessment of Diagnostic Accuracy Studies (QUADAS)-2 scales.22 This instrument was developed to assess the quality of studies involving diagnostic tests. Capable of distinguishing between bias and applicability (the extent to which primary studies are applicable to the review’s research question), the instrument comprises domains (four for risks of bias and three for applicability), which analyze 1) patient selection (“could the selection of patients have introduced bias” and “are there concerns that the included patients and setting do not match the review question?”), 2) index test (“could the conduct or interpretation of the index test have introduced bias?” and “are there concerns that the index test, its conduct, or its interpretation differ from the review question?”), 3) reference standard (“could the reference standard, its conduct, or its interpretation have introduced bias?” and “are there concerns that the target condition as defined by reference standard does not match the question?”), and 4) patient flow and timing (“could the patient flow have introduced bias?”). Studies are assessed as being of high, low, or intermediate risk. Tabulation of the results enables the context to be assessed, or studies with lower risks to be selected, or heterogeneity ratios to be analyzed, including the production of meta-regression.
Data analysis
The outcome of meta-analysis is the summary effect or single group’s summary. In this case, the outcome was combined weighted kappa (κ) agreement. Standard errors, variance, and weighted effect size were calculated, and forest plots were produced using the method described by Neyeloff et al.23 Using this model, it is possible to obtain the result of the meta-analysis of descriptive data through both fixed and random effects. It also calculates heterogeneity and inconsistency (Cochran’s Q test and I2 inconsistency test) and enables the production of forest plots. Depending on the heterogeneity and inconsistency results, Neyeloff et al23 proposed the use of the random effects model when heterogeneity is above 50% or when it is believed that there are significant differences between populations. Thus, random effects measures were adopted in our study, considering the differences among the studied populations. Since variability was assumed to be due not only to sampling errors but also to variability of effects in the population, in this model the weight of each study was adjusted with a constant (v) representing variability. Comparative analysis of the performance of the alternatives was also assessed by means of a receiver operating characteristic (ROC) curve, from the studies in which sensitivity and specificity were published. Studies in which these data were calculated at different stages/levels of a same disease (glaucoma or diabetic retinopathy), we used the average of them.
Results
Description of studies
We identified 121 studies, nine of which are included in this analysis, providing a total of 4,219 eyes analyzed comparatively.24–32 Figure 1 shows the flowchart for the studies included, all of which are cross-sectional. Mean age was 56.6 years (SD±8.5) and 1,924 (45.6%) were female. The images were obtained on the same occasion in all cases, using smartphones with different adapters and reference cameras or retinal examination described by a retina specialist (Table 1). Combined kappa (κ) agreement statistics were equal to 77.77% (95% CI: 70.34%, 83.70%), with negative heterogeneity measured by random effects (I2=−5.647 or equals zero) (Figure 2). Sensitivity and specificity were reported in five studies,25,27,31 and some but not all of them were calculated by the average of the different levels of severity (Russo et al).26,30 The area under the ROC curve for these five studies was 0.86 and it has an 80% sensitivity and specificity cutoff point (Figure 3).
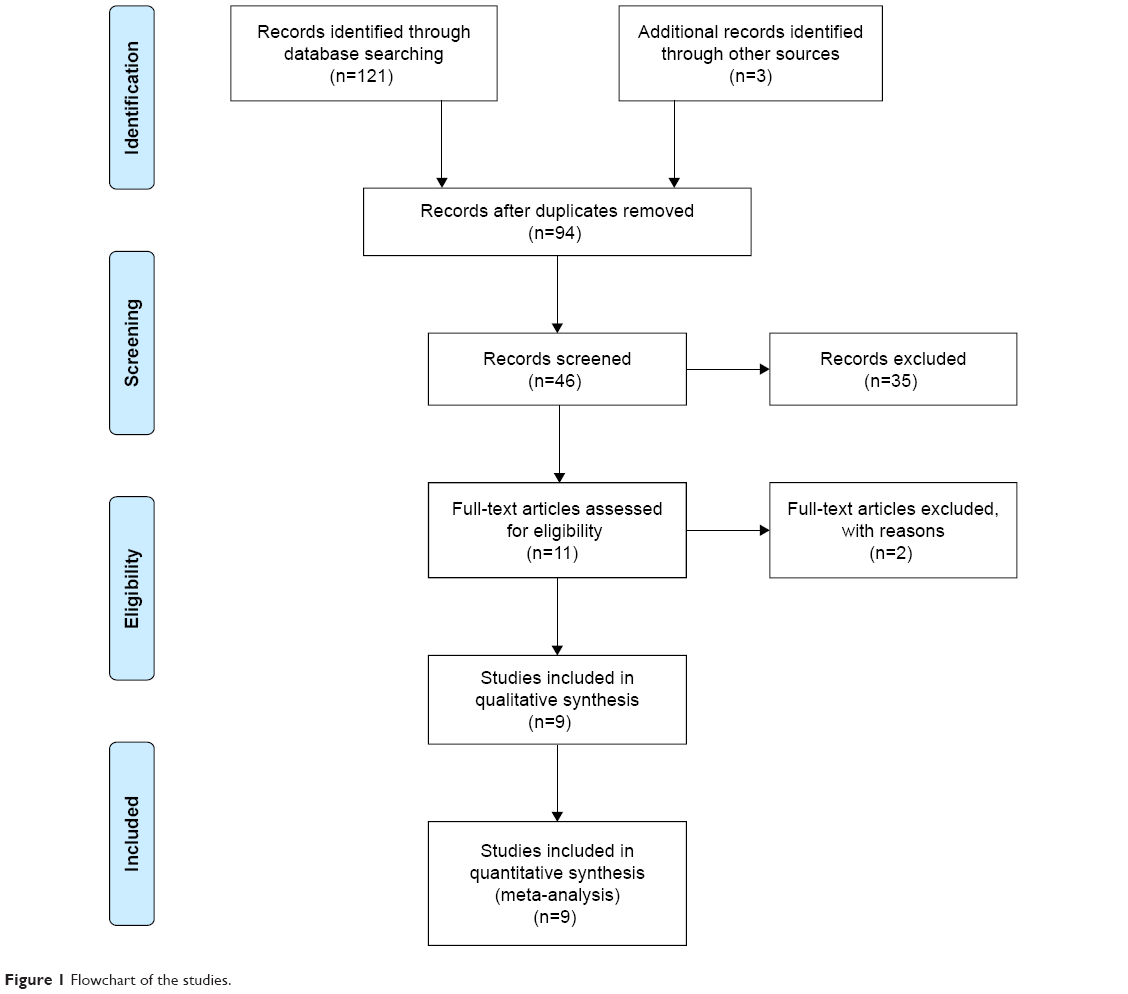 | Figure 1 Flowchart of the studies. |
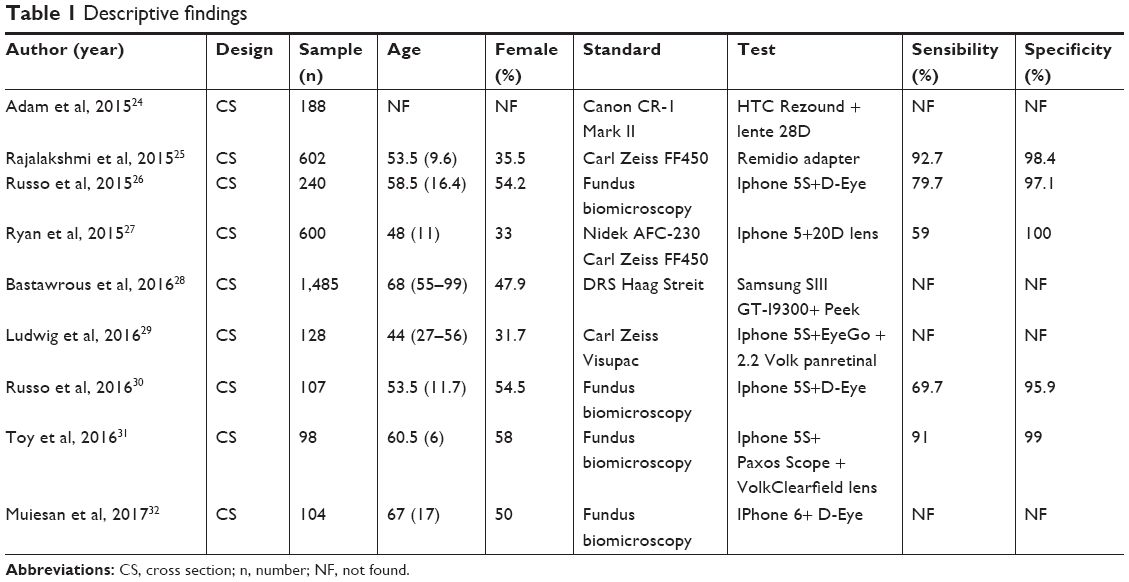 | Table 1 Descriptive findings |
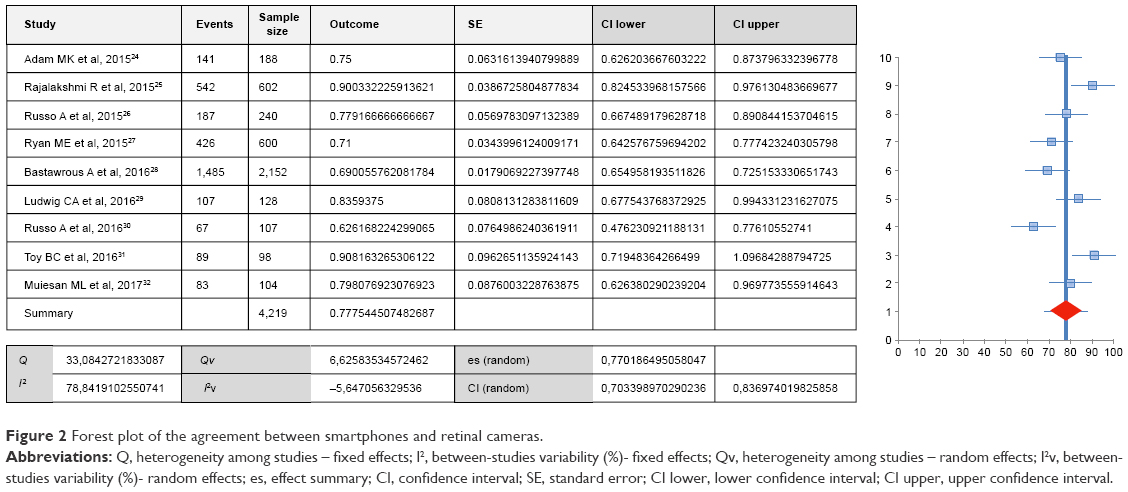 | Figure 2 Forest plot of the agreement between smartphones and retinal cameras. |
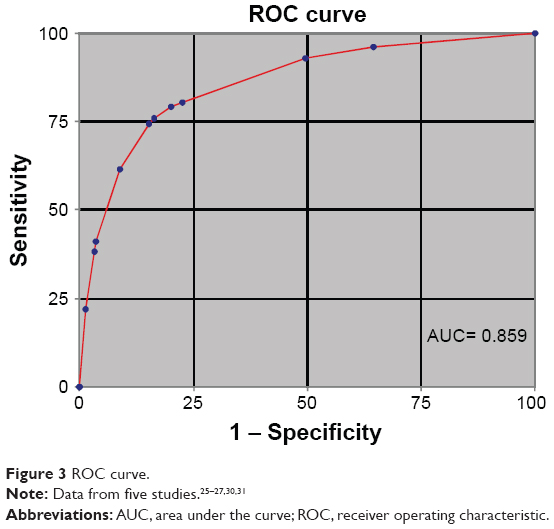 | Figure 3 ROC curve. |
Adam et al24 (2015) analyzed 188 eyes in Philadelphia, comparing images obtained by students and resident physicians using smartphones and 20D lenses with photographic fundus exams performed by professional photographers. Black and pseudophakic patients had the lowest quality images.
Rajalakshmi et al25 analyzed 602 eyes of diabetic patients in India. There were no differences between either systems in their capacity to diagnose the different stages of diabetic retinopathy.
Russo et al26 assessed 240 eyes of diabetic patients in Italy. Results obtained via smartphone were very similar to the results of fundus biomicroscopy exams. Stratified analysis of sensitivity (S) and specificity (SP) revealed: 1) cases with macular edema (S) 81%, (SP) 98%; 2) no apparent retinopathy (S) 96%, (SP) 90%; 3) moderate retinopathy (S) 82%, (SP) 98%; 4) proliferative retinopathy (S) 89%, (SP) 100%; and 5) severe cases (S) 55% and (SP) 98%.
Ryan et al27 assessed the diagnostic capacity of smartphones with regard to diabetic retinopathy in 600 eyes in the CAMRA Study (India). Diagnostic capacity was compared using two techniques: non-mydriatic photography (Nidek Model AFC-230) and fundus photography using a camera (Zeiss FF450 Plus). About 84.7% of all smartphone images were considered to be of excellent quality (vs 89% of the non-mydriatic images and 99.2% of the mydriatic images), although agreement was greater in the more advanced forms of the disease. Mydriatic camera image agreement was greater with smartphone images.
Bastawrous et al28 conducted the largest comparative evaluation with a total of 2,152 optic discs examined in Kenya. About 73.7% of the images were of high quality regardless of the system used. In the comparative analysis of the image quality, they found that in some cases only one of the systems was considered to produce good quality images (170 smartphone images and 371 reference camera images).
Ludwig et al29 assessed the posterior segment of 128 eyes of cases of different diseases in India. They obtained 84.4% high quality images when the examiner was an ophthalmologist, greatly exceeding students or optometrists.
In Italy, Russo et al30 assessed 107 optic discs of patients with ocular hypertension and chronic open-angle glaucoma. The agreement of the findings with the fundus biomicroscopy exams (without mydriasis) was relevant. Sensitivity and specificity were calculated for each tenth of the difference in the ratio between excavation and disc. Differences were found for the ratios: 0.1: (S) 38%, (SP) 100%; 0.2: (S) 100%, (SP) 94%; 0.5: (S) 47%, (SP) 96%; 0.9: (S) 67%, (SP) 99%.
Toy et al31 assessed 98 eyes of patients with diabetes mellitus in the US. Sensitivity (91%) and specificity (99%) using a smartphone were very similar to those achieved by fundoscopic and photographic exams.
Muiesan et al32 assessed 104 eyes of patients with systemic arterial hypertension examined by students and ophthalmologists in Italy. When compared to direct fundoscopy, the smartphone was more capable of locating retinal alterations.
Assessment of risk of bias
The majority of studies included in the review have low risk of bias and good applicability (Figure 4). Ryan et al27 defined sample size according to study time and resources and excluded type 1 diabetics, cases aged under 18 years, cases with no cardiovascular risks, gestational diabetes, and opacity. Based on medical records, Ludwig et al29 selected patients attending a quaternary health service and excluded 12% of cases with dilation of <6 mm, with opacities, or limited time for capturing images. Russo et al30 selected their sample at a tertiary referral center and excluded cases with higher refractive error and substantial media opacity.
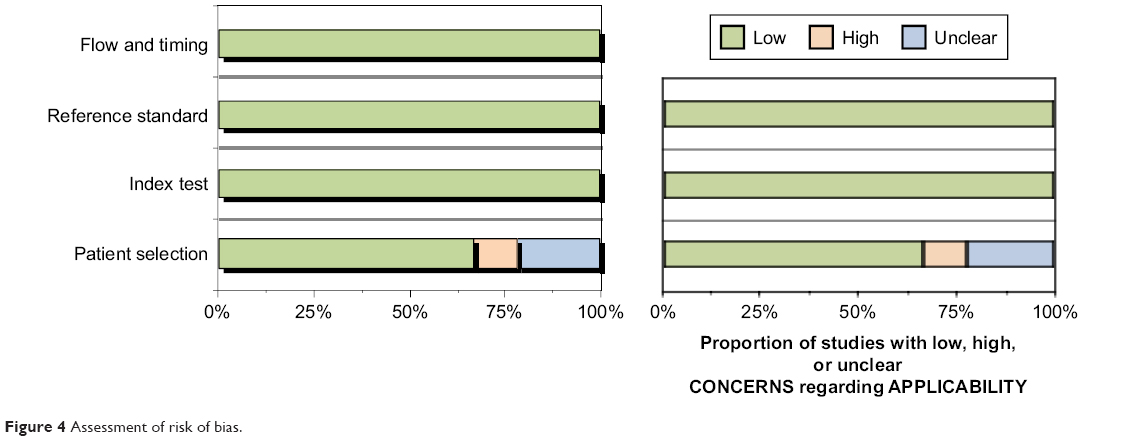 | Figure 4 Assessment of risk of bias. |
Discussion
Agreement between images captured using smartphones and images obtained by retinal cameras or by clinical fundoscopic exams among adults was substantial in this meta-analysis, regardless of the smartphone brand, lens used (20D, 28D), or adapter. The same was true of the specificity and sensitivity results reported in some of the studies. Russo presented stratification of these results according to glaucoma or diabetic retinopathy stages and found oscillations, although in more severe cases the rates were high.26,30
The importance of this lies not only in the diagnostic potential of a new examination tool but also in its use in telemedicine with a much more accessible cost–benefit for public policies, especially for populations with difficulties in accessing specialized care. The smartphone is effectively a reliable semiologic instrument for medical students and health professionals, with short and simple learning and execution of the stages of ophthalmological examinations, such as fundoscopy, measurement of visual acuity, assessment of color blindness, among others. Posterior ophthalmoscopy–biomicroscopy performed by specialists, or images acquired using retinal cameras, are the diagnostic gold standard. The clinical method requires longer and more specialized training and equipment is expensive to purchase and maintain, and these facts limit the supply of care to the population.24,33
Agreement was chosen as the comparative indicator to be assessed in the different studies, quantifying proximity between the standard references and the technique being studied. Heterogeneity (random effects) was minimal among the studies. Some images might have been sharper using different resources, or when captured by professionals with a greater or lesser degree of training, but even so the standard system does not always provide the best results.28 The posterior pole and the optic disc region had equivalent images. This opens the perspective of a low-cost method, portability, simple learning integrated with telemedicine being adopted in any clinical, emergency, or population-based medical and hospital care service.
Systematic reviews of diagnostic tests/resources have particularities relating to their identification (non-uniform indexing terms), evaluation of risk of bias, and the way results are combined. Strictly speaking, what is intended is to assess the performance of the resource, the quality of the studies, and the reasons for the differences between them. In the absence of clinical trials in the studies included in this review, measurements for evaluating accuracy, such as sensitivity, specificity, and odds ratios, were replaced by comparing weighted kappa coefficient agreement. This is a conservative statistical method that evaluates reproducibility between data sets from the same sample assessed using different methods, correcting associated agreement at random, and is important during the stages of new resource validation. The ROC curve showed very good overall accuracy of smartphone ophthalmology, coming close to the top right hand corner of the graph and having a good area under the curve.18,34,35
We decided to group together in this review studies using different smartphones (models, brands, series), adapters (in miosis, with lenses with different diopters fixed in different layouts or held in the examiners’ hands), and populations with and without previously known ophthalmological or clinical diagnoses, with the aim of increasing the sensitivity of the results with this technique. Pseudophakic cases, people of black race, or very elderly were related to poorer quality images.24 Comparative analysis does not exist for individuals aged under 27 years, although there are reports of satisfactory use in prematurity screening.15 All the studies included were common in that they were submitted simultaneously to a comparative gold standard by different examiners. Readings were always taken with the inclusion of a third member or a third person called to assist in cases of disagreement. The meta-analysis produced a very consistent result as to the technical validation of this resource.
The fundoscopic photography method using a cell phone with a camera loses quality in the presence of media opacity or low patient cooperation. The majority of the studies analyzed used cell phone models that have already undergone substantial changes in their photo and video systems, enabling countless focusing adjustments and enlargement. Some resources are designed for use in miosis, but are lacking with regard to the extent of the field examined. Mydriasis enlarges the field, but has risks inherent to pupil dilation. Luminosity can be adjusted and become more tolerable using photographic applications or using linked systems. It should be highlighted that there are no increased photobiological risks when using cell phones and condensing lenses.36–38 Images obtained with binocular ophthalmology lenses (20D) capture a field of <45 degrees. The combination of 60D lenses with a 90 mm focal length lens and with the cell phone lens and specific illumination can enable a larger field (92°) to be captured.39
The strength of this study lies in its broad and sensitive search, with no language or filter restrictions and inclusion of publications with faithful comparisons and very similar technical conditions. The measurement of effect and high methodological quality are optimal prognosticators of the validity of the method. Limitations include different populations, resource standardization, and lack of prospective studies preventing evaluation of the technique’s value in controlling evolution.
Conclusion
Fundoscopic images obtained using smartphones have very strong agreement with clinical or photographical examination gold standards. This resource may facilitate learning about fundoscopy and also scale up patients’ access to medical care, given that the interpretation of the findings can orient the priority of appointment booking and swiftness in diagnosis and management. The tendency is to present this resource in critical emergency care and also in the assessment of underprivileged or remote populations, bringing a considerable gain for public health policies through its ability to ally with telemedicine.
Disclosure
The authors report no conflicts of interest in this work.
References
Number of smartphone users worldwide from 2014 to 2020 (in billions). Available from https://www.statista.com/statistics/330695/number-of-smartphone-users-worldwide/. Accessed June 1, 2018. | ||
MEDLINE [database on the Internet]. Available from: https://www.ncbi.nlm.nih.gov/pubmed. Accessed June 1, 2018. | ||
International prospective register of systematic reviews (PROSPERO) [database on the Internet]. Available from: https://www.crd.york.ac.uk/prospero/#searchadvanced. Accessed June 1, 2018. | ||
Lamirel C, Bruce BB, Wright DW, Newman NJ, Biousse V. Nonmydriatic digital ocular fundus photography on the iPhone 3G: the FOTO-ED study. Arch Ophthalmol. 2012;130(7):939–940. | ||
Kumar S, Wang EH, Pokabla MJ, Noecker RJ. Teleophthalmology assessment of diabetic retinopathy fundus images: smartphone versus standard office computer workstation. Telemed J E Health. 2012;18(2):158–162. | ||
Yoo I, Sheets L, Mosa AS. A systematic review of healthcare applications for smartphones. BMC Med Inform Decis Mak. 2012;12:67. | ||
Lord RK, Shah VA, San Filippo AN, Krishna R. Novel uses of smartphones in ophthalmology. Ophthalmology. 2010;117(6):1274–1274.e3. | ||
Bastawrous A. Smartphone fundoscopy. Ophthalmology. 2012;119(2):432–433.e2; author reply 433. | ||
Darma S, Zantvoord F, Verbraak FD. The quality and usability of smartphone and hand-held fundus photography, compared to standard fundus photography. Acta Ophthalmol. 2015;93(4):e310–e311. | ||
Ademola-Popoola DS, Olatunji VA. Retinal imaging with smartphone. Niger J Clin Pract. 2017;20(3):341–345. | ||
Kelly LP, Garza PS, Bruce BB, Graubart EB, Newman NJ, Biousse V. Teaching ophthalmoscopy to medical students (the TOTeMS study). Am J Ophthalmol. 2013;156(5):1056–1061.e10. | ||
Biousse V, Bruce BB, Newman NJ. Ophthalmoscopy in the 21st century: The 2017 H. Houston Merritt Lecture. Neurology. 2018;90(4):167–175. | ||
Bolster NM, Giardini ME, Bastawrous A. The diabetic retinopathy screening workflow: potential for smartphone imaging. J Diabetes Sci Technol. 2016;10(2):318–324. | ||
Oluleye T, Olusanya B, Adeoye M. Retinal vascular chenges in hypertensive patients in Ibadan, Sub-Saharan Africa. Intern J Gen Med. 2016;9:285–290. | ||
Oluleye TS, Rotimi-Samuel A, Adenekan A. Mobile phones for retinopathy of prematurity screening in Lagos, Nigeria, sub-Saharan Africa. Eur J Ophthalmol. 2016;26(1):92–94. | ||
Giardini ME, Livingstone IA, Jordan S. A smartphone based ophthalmoscope. Conf Proc IEEE Eng Med Biol Soc. 2014;2014:2177–2180. | ||
Furdová A, Kromery V, Horkovicová K, Furdová A, Sláviková T. Technické moznosti vysetrenia a dokumentácie nálezov predného a zadného segmentu oka v rámci humanitárnych projektov. [Technical Options of Documentation of the Anterior Segment and the eye Fundus Findings within Mission]. Cesk Slov Oftalmol. 2016;72(3):86–90. | ||
Leeflang MM, Deeks JJ, Takwoingi Y, Macaskill P. Cochrane diagnostic test accuracy reviews. Syst Rev. 2013;2:82. | ||
PRISMA. Preferred reporting items for systematic reviews and meta-analyses. Available from: http://www.prisma-statement.org. Accessed June 1, 2018. | ||
Stroup DF, Berlin JA, Morton SC, et al. Meta-analysis of observational studies in epidemiology: a proposal for reporting. Meta-analysis Of Observational Studies in Epidemiology (MOOSE) group. JAMA. 2000;283(15):2008–2012. | ||
PROSPERO. International prospective register of systematic reviews. Available from: http://www.crd.york.ac.uk/PROSPERO/. Accessed June 1, 2018. | ||
Whiting PF, Rutjes AW, Westwood ME, et al; QUADAS-2 Group. QUADAS-2: a revised tool for the quality assessment of diagnostic accuracy studies. Ann Intern Med. 2011;155(8):529–536. | ||
Neyeloff JL, Fuchs SC, Moreira LB. Meta-analyses and Forest plots using a microsoft excel spreadsheet: step-by-step guide focusing on descriptive data analysis. BMC Res Notes. 2012;5:52. | ||
Adam MK, Brady CJ, Flowers AM, et al. Quality and diagnostic utility of mydriatic smartphone photography: the smartphone ophthalmoscopy reliability trial. Ophthalmic Surg Lasers Imaging Retina. 2015;46(6):631–637. | ||
Rajalakshmi R, Arulmalar S, Usha M, et al. Validation of smartphone based retinal photography for diabetic retinopathy screening. PLoS One. 2015;10(9):e0138285. | ||
Russo A, Morescalchi F, Costagliola C, Delcassi L, Semeraro F. Comparison of smartphone ophthalmoscopy with slit-lamp biomicroscopy for grading diabetic retinopathy. Am J Ophthalmol. 2015;159(2):360–364.e1. | ||
Ryan ME, Rajalakshmi R, Prathiba V, et al. Comparison Among Methods of Retinopathy Assessment (CAMRA) study: smartphone, nonmydriatic, and mydriatic photography. Ophthalmology. 2015;122(10):2038–2043. | ||
Bastawrous A, Giardini ME, Bolster NM, et al. Clinical Validation of a smartphone-based adapter for optic disc imaging in Kenya. JAMA Ophthalmol. 2016;134(2):151–158. | ||
Ludwig CA, Murthy SI, Pappuru RR, Jais A, Myung DJ, Chang RT. A novel smartphone ophthalmic imaging adapter: User feasibility studies in Hyderabad, India. Indian J Ophthalmol. 2016;64(3):191–200. | ||
Russo A, Mapham W, Turano R, et al. Comparison of smartphone ophthalmoscopy with slit-lamp biomicroscopy for grading vertical Cup-to-Disc ratio. J Glaucoma. 2016;25(9):e777–e781. | ||
Toy BC, Myung DJ, He L, et al. Smartphone-based dilated fundus photography and near visual acuity testing as inexpensive screening tools to detect referral warranted diabetic eye disease. Retina. 2016;36(5):1000–1008. | ||
Muiesan ML, Salvetti M, Paini A, et al. Ocular fundus photography with a smartphone device in acute hypertension. J Hypertens. 2017;35(8):1660–1665. | ||
Nazari Khanamiri H, Nakatsuka A, El-Annan J. Smartphone fundus photography. J Vis Exp. 2017;125:e55958. | ||
Egger M, Smith GD, Altman DG. Systematic Reviews in Health Care. Meta-Analyses in Context. London: BMJ Publishing Group; 2001. | ||
Kirkwood BR, Sterne AC. Medical Statistics. 2nd ed. Malden: Blackwell Science; 2010. | ||
Kim DY, Delori F, Mukai S. Smartphone photography safety. Ophthalmology. 2012;119(10):2200–2201; author reply 2201. | ||
Suto S, Hiraoka T, Okamoto Y, Okamoto F, Oshika T. [Photography of anterior eye segment and fundus with smartphone]. Nippon Ganka Gakkai Zasshi. 2014;118(1):7–14. Japanese. | ||
Hong SC, Wynn-Williams G, Wilson G. Safety of iPhone retinal photography. J Med Eng Technol. 2017;41(3):165–169. | ||
Toslak D, Ayata A, Liu C, Erol MK, Yao X. Wide-field smartphone fundus video camera based on miniaturized indirect ophthalmoscopy. Retina. 2018;38(2):438–441. |
Supplementary material
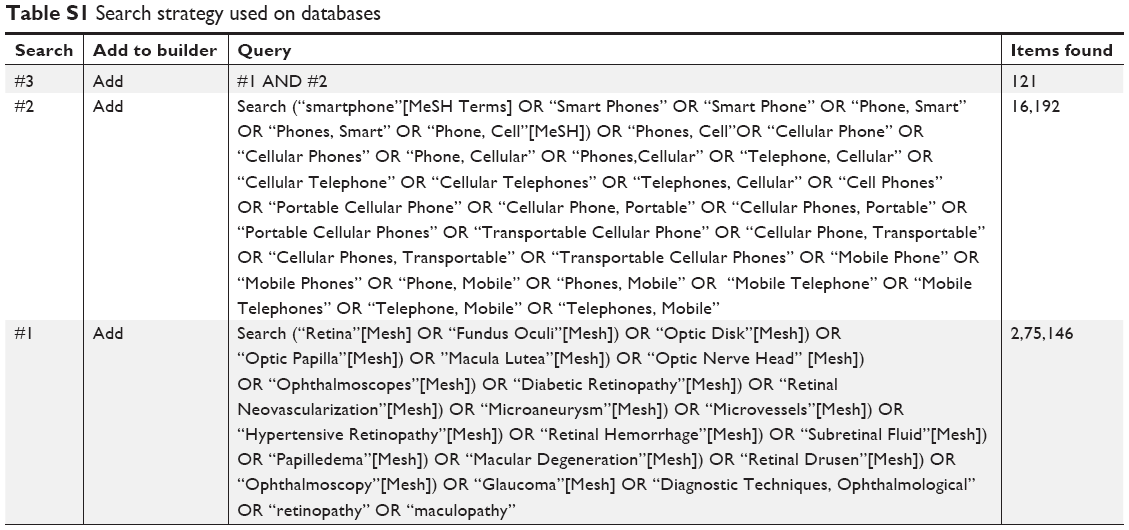 | Table S1 Search strategy used on databases |
 © 2018 The Author(s). This work is published and licensed by Dove Medical Press Limited. The
full terms of this license are available at https://www.dovepress.com/terms
and incorporate the Creative Commons Attribution
- Non Commercial (unported, 3.0) License.
By accessing the work you hereby accept the Terms. Non-commercial uses of the work are permitted
without any further permission from Dove Medical Press Limited, provided the work is properly
attributed. For permission for commercial use of this work, please see paragraphs 4.2 and 5 of our Terms.
© 2018 The Author(s). This work is published and licensed by Dove Medical Press Limited. The
full terms of this license are available at https://www.dovepress.com/terms
and incorporate the Creative Commons Attribution
- Non Commercial (unported, 3.0) License.
By accessing the work you hereby accept the Terms. Non-commercial uses of the work are permitted
without any further permission from Dove Medical Press Limited, provided the work is properly
attributed. For permission for commercial use of this work, please see paragraphs 4.2 and 5 of our Terms.