Back to Journals » Therapeutics and Clinical Risk Management » Volume 13
Agreement between calcaneal quantitative ultrasound and osteoporosis self-assessment tool for Asians in identifying individuals at risk of osteoporosis
Authors Chin KY ![]() , Low NY, Kamaruddin AAA, Dewiputri WI, Soelaiman IN
, Low NY, Kamaruddin AAA, Dewiputri WI, Soelaiman IN ![]()
Received 4 July 2017
Accepted for publication 31 August 2017
Published 6 October 2017 Volume 2017:13 Pages 1333—1341
DOI https://doi.org/10.2147/TCRM.S145519
Checked for plagiarism Yes
Review by Single anonymous peer review
Peer reviewer comments 2
Editor who approved publication: Professor Garry Walsh
Kok-Yong Chin,1 Nie Yen Low,2 Alia Annessa Ain Kamaruddin,2 Wan Ilma Dewiputri,2 Ima-Nirwana Soelaiman1
1Department of Pharmacology, Universiti Kebangsaan Malaysia Medical Centre, Cheras, Malaysia; 2ASASIpintar Foundation Program, PERMATApintar National Gifted Centre, Universiti Kebangsaan Malaysia, Bangi, Malaysia
Background: Calcaneal quantitative ultrasound (QUS) is a useful tool in osteoporosis screening. However, QUS device may not be available at all primary health care settings. Osteoporosis self-assessment tool for Asians (OSTA) is a simple algorithm for osteoporosis screening that does not require any sophisticated instruments. This study explored the possibility of replacing QUS with OSTA by determining their agreement in identifying individuals at risk of osteoporosis.
Methods: A cross-sectional study was conducted to recruit Malaysian men and women aged ≥50 years. Their bone health status was measured using a calcaneal QUS device and OSTA. The association between OSTA and QUS was determined using Spearman’s correlation and their agreement was assessed using Cohen Kappa and receiver-operating curve.
Results: All QUS indices correlated significantly with OSTA (p<0.05). The agreement between QUS and OSTA was minimal but statistically significant (p<0.05). The performance of OSTA in identifying subjects at risk of osteoporosis according to QUS was poor-to-fair in women (p<0.05), but not statistically significant for men (p>0.05). Changing the cut-off values improved the performance of OSTA in women but not in men.
Conclusion: The agreement between QUS and OSTA is minimal in categorizing individuals at risk of osteoporosis. Therefore, they cannot be used interchangeably in osteoporosis screening.
Keywords: bone, correlation, osteopenia, ROC, sensitivity, specificity
Introduction
Early detection and treatment is the key to encumber the progression of osteoporosis, which is a disease characterized by deterioration of bone mass and microarchitecture.1,2 Osteoporosis predisposes patients to fragility fractures, thereby incurring significant health care and economic burden to society.3,4 Diagnosis of osteoporosis is based on bone mineral density (BMD) obtained using dual-energy X-ray absorptiometer (DEXA). The disease is confirmed when BMD value of the patient is 2.5 SD below the reference value of young adults (T-score ≤2.5). Osteopenia (low bone mass) is present when T-score of the patient is >−2.5 but <−1 (2.5< T-score ≤−1).5 Despite the usefulness of this simple classification system, accessibility to DEXA device is low owing to its limited number and high scanning cost.6 Competition for the use of DEXA will accelerate with the concurrent growth in elderly population and prevalence of osteoporosis.
Screening of patients at high risk of osteoporosis can reduce the burden on DEXA service. Quantitative ultrasound (QUS) measurement at appendicular skeletal sites, such as calcaneus, phalanx, and wrist, is a popular bone health screening method. Previous studies demonstrated that QUS indices reflect skeletal microarchitectures and strength apart from BMD.7 They can also predict fracture risk.8 Although cheaper than DEXA, QUS devices still incur substantial costs and may not be available at all primary health care premises.
Besides QUS, several algorithms based on risk factors are currently used to predict osteoporosis and fragility fracture, such as the osteoporosis self-assessment tool (OST), osteoporosis risk assessment tool (ORAI), simple calculated risk estimation (SCORE), and fracture risk assessment tool (FRAX).9,10 Most of these algorithms are developed in the Caucasian population. Koh et al introduced the osteoporosis self-assessment tool for Asians (OSTA), which was established using data of women from eight countries.11 This simple algorithm requires only information on age and body weight of the patient: 0.2× (body weight − age). The results will be truncated to produce an integer. Patients with an OSTA score of ≤−4 are considered as high risk, between −1 and −4 as medium risk, and >−1 as low risk of osteoporosis.11 Subsequently, Kung et al validated OSTA among Hong Kong population and found that the same algorithms and cut-offs could predict osteoporosis in men.12
There are limited studies on the concordance between QUS and OSTA in identifying patients at risk of osteoporosis.13,14 If agreement between the two screening methods is high, OSTA could replace QUS as a more cost-effective osteoporosis screening tool because it does not require any sophisticated instrument. Therefore, this study was aimed to determine the association between QUS indices and OSTA, and to assess their agreement in identifying patients at risk of osteoporosis. We hypothesized that the agreement is high because both indices are strongly influenced by variation in age and body weight.
Materials and methods
A cross-sectional study was conducted from December 1, 2014 to November 30, 2015 at a tertiary university hospital in Cheras, Malaysia. The study protocol was previously described.15,16 Briefly, subjects were male and female visitors to the hospital aged ≥50 years. They were recruited using a purposive sampling method onsite without prior solicitation. Subjects with the following conditions were excluded from the study: 1) previously diagnosed with metabolic bone diseases, such as osteoporosis, osteomalacia, osteogenesis imperfecta, rickets, or Paget’s disease; 2) currently diagnosed with conditions that affect bone metabolism, such as hypogonadism (excluding menopause), hyper/hypoparathyroidism, and hyper/hypocalcemia hyper/hypothyroidism; 3) being treated with agents that affect bone metabolism, such as hormone replacement therapy, anti-osteoporosis therapy, thyroid supplement, glucocorticoids, antidepressants, and anticonvulsants; 4) having mobility problems, requiring a walking aid, being implanted with metal at the lower limbs, or suffering from a fracture 6 months prior to the screening. Subjects were briefed on the details of the project and written informed consent was obtained prior to their enrolment. The protocol of this study was reviewed and approved by Universiti Kebangsaan Malaysia Research Ethics Committee (Code: FF-2015-396 and FF-2015-412).
During the screening session, the subjects answered a self-administered questionnaire on their demographic details, lifestyle, and medical history. Their chronological age was determined from records on their identification cards. Their biological sex, ethnicity, and presence of a medical condition were self-declared. Their standing height without shoes was measured using a stadiometer (Seca, Hamburg, Germany) and was recorded to the nearest 1 cm. Their body weight with light clothing but without shoes was measured using a weight scale (Tanita, Tokyo, Japan) and was recorded to the nearest 0.1 kg. Body mass index was calculated as per the convention: body weight in kg divided by square of height in m. Bone health of the subjects was determined using a water-based calcaneal quantitative ultrasonometer (Achilles EXPII, GE Healthcare UK Ltd, Little Chalfont, UK). Ultrasound waves were transmitted from an inflatable transducer through the subject’s right calcaneus placed on the adjustable footpad and received by another transducer while the subject remained in a sitting position. The signals were interpreted to generate three QUS indices: speed of sound (SOS), broadband ultrasound attenuation (BUA), and a composite parameter, stiffness index (SI = [0.67× BUA] + [0.28× SOS] −420). The SI would be compared against an internal reference derived from the Mainland Chinese population to produce a T-score. The subjects were classified based on T-score into three groups: low risk (T-score >−1), medium risk (−2.5< T-score <−1), or high risk (T-score <−2.5) of osteoporosis. OSTA was calculated based on the formula 0.2× (body weight − age), whereby the decimals of the product were truncated to produce an integer. The subjects were assigned to the respective risk groups based on their OSTA scores: low risk (OSTA >−1), medium risk (−4< OSTA <−1), or high risk (OSTA <−4).
Statistical analysis
Normality of the data will be analyzed using Kolmogorov–Smirnov test. Correlation between QUS indices and OSTA score was determined using Spearman’s correlation. Agreement in bone health classification between QUS and OSTA was determined using kappa statistics. A kappa value (κ) of ≥0.6 was considered moderate, while ≥0.8 was strong. Using QUS as the reference, receiver-operating curve (ROC) was generated for OSTA. Sensitivity, specificity, and area under the curve (AUC) were calculated. An AUC value of 0.5 indicates inability to identify individual at risk of osteoporosis. Sub-analysis according to age group, sex, and ethnic groups was also performed. Alternative cut-off values of OSTA were obtained by coordinate tracing of ROC curve (Figure 1). The optimal cut-off should have a sensitivity value close to 80% and a reasonable specificity value. Statistical analysis was performed using SPSS version 23.0 (IBM, Armonk, NY, USA). Statistical significance was set at p<0.05 (two-tailed).
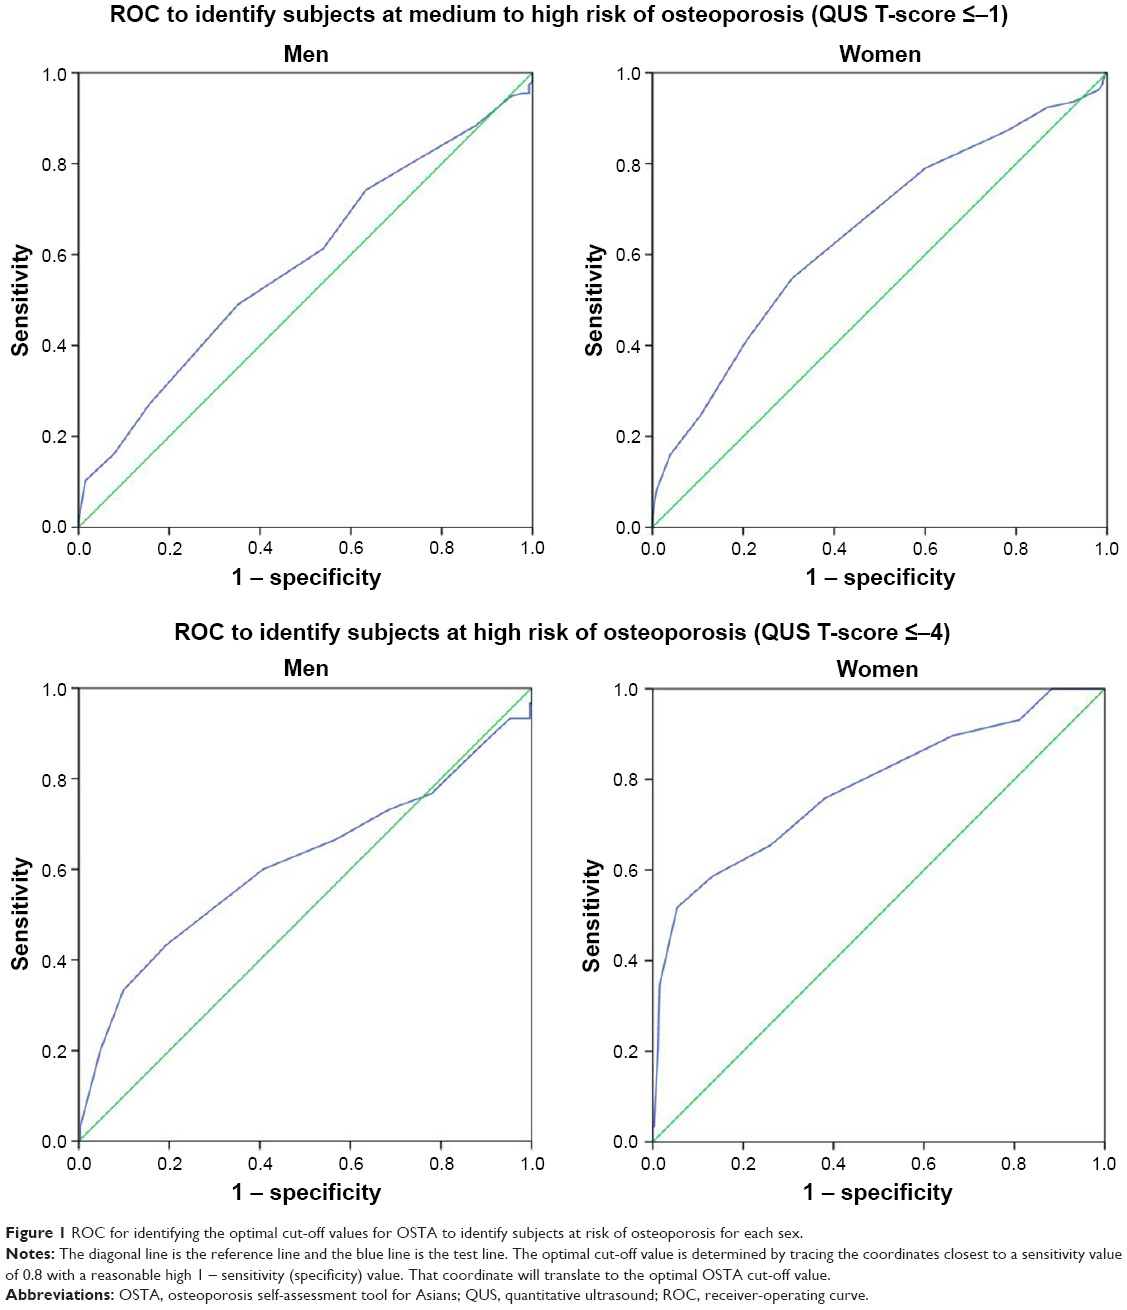 | Figure 1 ROC for identifying the optimal cut-off values for OSTA to identify subjects at risk of osteoporosis for each sex. |
Results
Of the 772 subjects recruited, 127 were excluded because they were under thyroid supplement (n=44), hormone replacement therapy (n=40), antiosteoporosis agent (n=30), or glucocorticoids (n=11). Another two were excluded because they did not complete the screening process. Data from the remaining 645 subjects were included in the final analysis. The study population consisted of 283 men with a mean age of 63.4 years (SD: 7.4 years) and 362 women with a mean age of 61.7 years (SD: 7.5 years). Majority of the subjects were Chinese (54.0%), followed by Malays (36.3%) and Indians (9.8%) (Table 1).
 | Table 1 Characteristics of the subjects |
Overall, calcaneal SOS (rs=0.176, p<0.001), BUA (rs=0.359, p<0.001), SI (rs=0.289, p<0.001), and T-score (rs=0.194, p<0.001) correlated significantly with OSTA score of the subjects. Sub-analysis based on sex revealed that the strength of these associations was higher in women compared to men. For instance, SOS was significantly associated with OSTA scores in women (rs=0.217, p<0.001) but not in men (rs=0.062, p=0.295). Further analysis based on ethnicity showed that the associations between OSTA score and QUS indices were stronger among the Chinese and Malay subjects (p<0.05). These associations were not significant among the Indian subjects (p<0.05) (Table 2).
 | Table 2 Correlation between QUS indices and OSTA scores |
Agreement between QUS and OSTA in classifying bone health status of the subjects was minimal but statistically significant (κ=0.148, p<0.001). The agreement was higher in women (κ=0.236, p<0.001), but not statistically significant at all in men (κ=0.066, p<0.114). Sub-analysis based on ethnicity indicated that agreement was the highest among the Malay women (κ=0.338, p<0.001) followed by the Chinese women (κ=0.186, p=0.001). It was not significant for the Indian women (κ=0.235, p=0.068) (Table 3).
 | Table 3 Agreement between QUS and OSTA scores in identifying subjects at risk of osteoporosis |
Based on ROC, the ability of OSTA (cut-off ≤−1) to predict subjects at moderate or high risk of osteoporosis defined by QUS was statistically significant but the performance was poor (AUC =0.581; 95% CI: 0.536–0.625; p<0.001). The predictability was higher in women (AUC =0.620; 95% CI: 0.562–0.679; p<0.001) compared to men (AUC =0.557; 95% CI: 0.491–0.624; p=0.097). At the cut-off ≤−4, OSTA performed slightly better in identifying subjects with high risk of osteoporosis defined by QUS (AUC =0.619; 95% CI: 0.534–0.705; p=0.002). Similarly, the predictability was higher in women (AUC =0.732; 95% CI: 0.616–0.848; p<0.001) than in men (AUC =0.515; 95% CI: 0.403–0.626; p=0.792). In women, the sensitivity and AUC of OSTA increased with age, but the specificity decreased with age. This was not observed in men (Table 4).
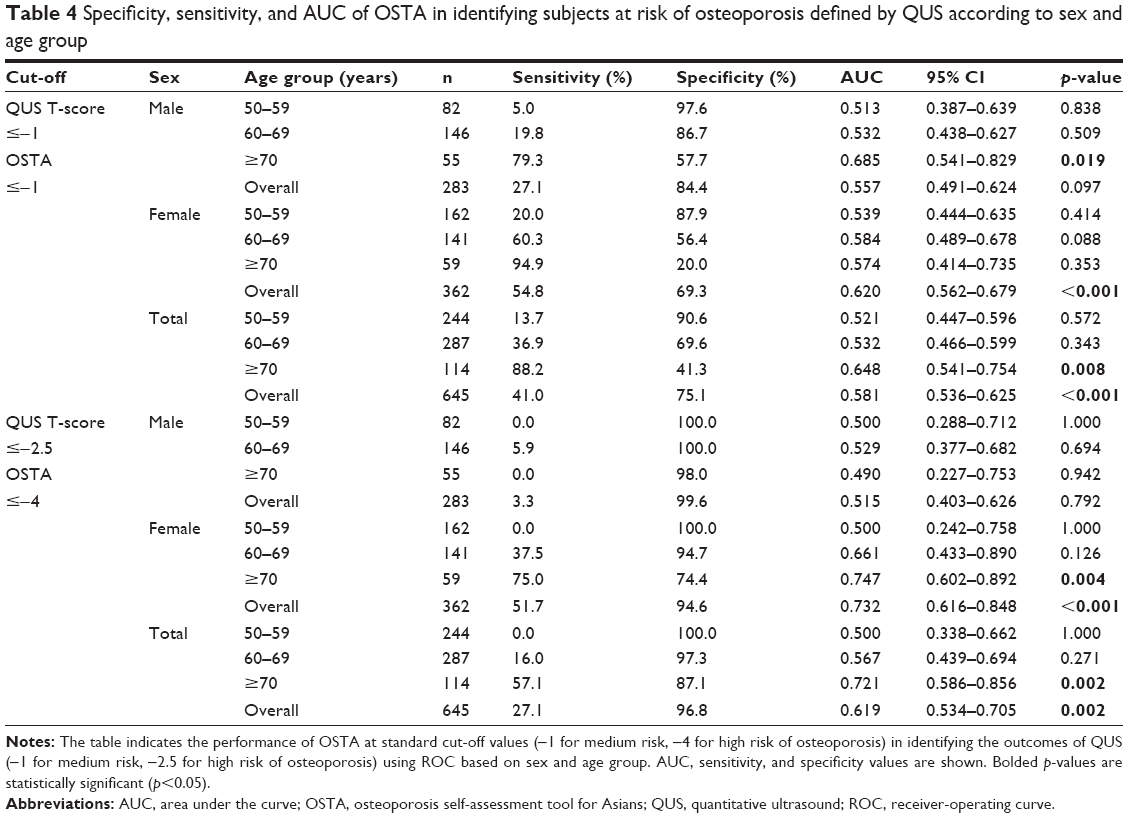 | Table 4 Specificity, sensitivity, and AUC of OSTA in identifying subjects at risk of osteoporosis defined by QUS according to sex and age group |
Further analysis based on ethnicity showed that OSTA demonstrated poor performance in predicting subjects at high risk alone or medium to high risk of osteoporosis among all three ethnic groups in men, consistent with the overall results (p>0.05). OSTA performed better in predicting Malay women at medium to high risk of osteoporosis (AUC =0.668; 95% CI: 0.568–0.767; p=0.001), but not women at high risk of osteoporosis alone (AUC =0.654; 95% CI: 0.387–0.921; p=0.204). In Chinese women, performance of OSTA was better in predicting subjects at high risk of osteoporosis (AUC =0.758; 95% CI: 0.619–0.897; p<0.001) compared to subjects at medium to high risk of osteoporosis (AUC =0.587; 95% CI: 0.508–0.666; p=0.033). The performance of OSTA was poorer among Indian women (p>0.05) (Table 5).
 | Table 5 Specificity, sensitivity, and AUC of OSTA in identifying subjects at risk of osteoporosis defined by QUS according to sex and ethnic group |
Due to the poor performance of OSTA at existing cut-off values, alternative cut-off values were searched. At cut-off ≤0.5, sensitivity of OSTA in predicting women at medium to high risk increased to 79.0% (54.8% at cut-off ≤−1). At cut-off ≤−0.5 sensitivity of OSTA in predicting women at high risk of osteoporosis alone increased to 75.9% (51.7% at cut-off ≤−4). Ethnic differences in the optimal cut-off values for OSTA was observed in women. For instance, the cut-off value for predicting women at medium to high risk was 0.5 for Chinese and 1.5 for Malays and Indians. Performance of OSTA deteriorated for men when the cut-off values were changed (Table 6).
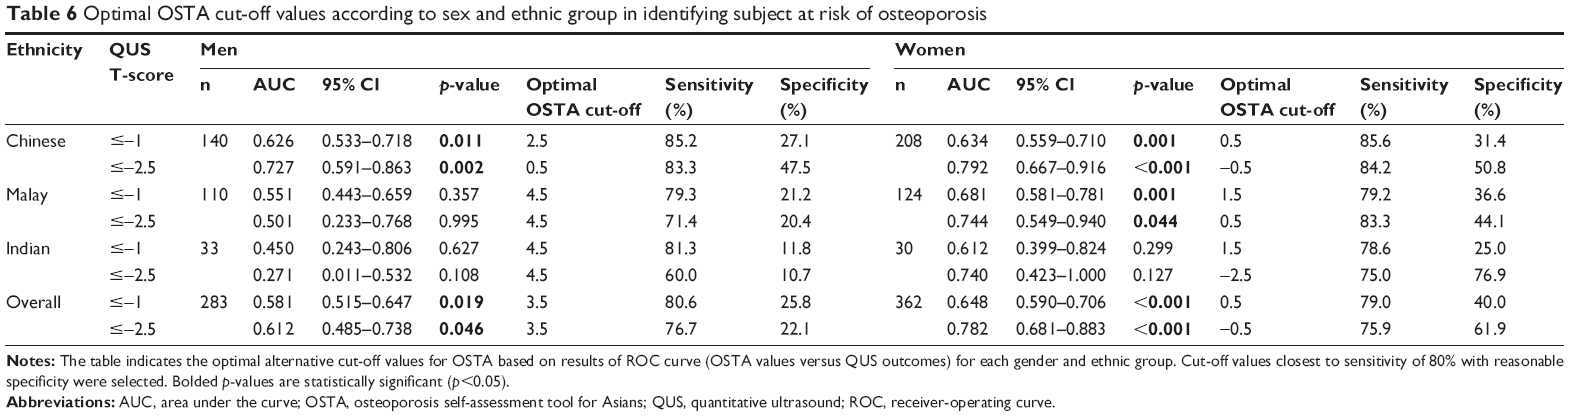 | Table 6 Optimal OSTA cut-off values according to sex and ethnic group in identifying subject at risk of osteoporosis |
Discussion
The results of this study showed that OSTA and QUS indices were significantly correlated. Since QUS indices have been shown to associate significantly with chronological age and body weight,17,18 this observation is not unexpected. However, the agreement between OSTA and QUS was minimal despite statistically significant. Further examination showed that performance of OSTA in identifying subjects at risk of osteoporosis defined by QUS at the existing cut-off points (−1 or −4) was poor-to-fair for women, and not significant at all for men. Agreement between OSTA and QUS and the performance of OSTA were higher among the Chinese and Malay women compared to the Indian women. This is due to inequality in sample size among the ethnic groups, whereby the number of Indian subjects was small.
A study conducted in Nepali women (n=100, mean age =58.14 years) showed that OSTA score demonstrated sensitivity and specificity values of 85.2% and 89.1% at the cut-off ≤−1 in identifying individuals with QUS T-score of ≤−1.13 These values were higher compared to women of the current study, with sensitivity and specificity values of 54.8% and 69.3%. In another study on 722 Chinese postmenopausal women with a mean age of 62 years, OSTA (cut-off ≤−1; AUC =0.75; sensitivity =79%; specificity =60%) was found to perform better than QUS (cut-off ≤−2.35 AUC =0.74; sensitivity =69%; specificity =70%) in identifying subjects with osteoporosis (T-score ≤−2.5 based on femoral neck or lumbar spine BMD).19 We did not measure BMD of the subjects; hence similar comparison could not be made. The low agreement between OSTA and QUS classification could be due to several reasons. OSTA and its cut-off values were established to identify osteoporotic subjects diagnosed based on BMD values.11,12 Although QUS indices were associated with BMD significantly,20,21 it is not a perfect surrogate for BMD. Soft tissues and edema at the feet can artificially attenuate the transmission of ultrasound across the calcaneus.7 Moreover, indices of QUS are influenced by the skeletal microstructures, which are not reflected in BMD.7 This could weaken the agreement between QUS and OSTA.
It is observed that the agreement between OSTA and QUS was better in women and in older population. This is supported by previous studies examining the performance of OSTA in identifying osteoporotic subjects defined by BMD. In a large epidemiological study involving 15,752 healthy Chinese women aged 40–96 years, Huang et al showed that the performance of OSTA based on AUC and its sensitivity increased with age, but its specificity decreased with age.22 Similar findings were observed in another study by Huang et al among 11,039 Chinese men with similar age range.23 This suggests that OSTA is suitable to be used in older subjects with higher risk of osteoporosis compared to younger subjects. It is noteworthy that sensitivity of OSTA was significantly lower in men compared to women. This sex difference in the performance of OSTA was apparent since its inception in the study of Kung et al whereby the AUC was lower compared to the original study by Koh et al among women.11,12 This may be because bone health status of men is less influenced by chronological age and body weight.
Ethnic difference in the performance of OSTA was observed in this study, whereby it was better among the Chinese and Malay women compared to the Indian women. We suggest that this was because Chinese and Malay women were involved in the establishment of OSTA by Koh et al. The low performance of OSTA among the Indian subjects was probably due to the low sample size (n=30/362). We also searched for alternative optimal cut-off values for each sex and ethnic group, and the new cut-off values improved sensitivity of OSTA in women but not in men. This observation in women subjects was in agreement with other studies, which suggested that alternative cut-off values could improve the performance of OSTA due to differences (site of BMD measurement and population).24,25 In our study, the obvious difference was that the reference outcome was measured by QUS, instead of BMD. However, OSTA did not predict QUS outcomes in Malaysian men even at altered cut-off values, probably because age and body weight were not the significant risk factors of osteoporosis in men. Our previous study on bone health assessed using QUS technique showed that body height was a more important predictor of QUS values among Malaysian middle-aged and elderly men.26
This study is not without limitations. The researchers did not have access to DEXA at the time of the study; hence BMD of the subjects was not determined. Therefore, the ability of OSTA and QUS to identify osteoporosis defined by BMD could not be compared. The agreement between QUS and DEXA in this population could not be established. However, the alternative approach presented in this paper was taken to determine the agreement between the two instruments. Generalization of the results in this study should be performed with cautions because the subjects were recruited via a non-probability sampling method. To validate the results of this study, both OSTA and QUS should be validated against BMD of the subjects.
Conclusion
QUS and OSTA cannot be used interchangeably in osteoporosis screening because the agreement between them in identifying individual at risk is minimal, thereby not clinically useful. They should be validated against DEXA in the Malaysian population before being used in osteoporosis screening.
Acknowledgments
We thank University Kebangsaan Malaysia for funding this study via Fundamental Research Grants FF-2015–396 and FF-2015–412. We also thank the following individuals in helping us during the screening process: Fadlullah Zuhair Japar Sidik, Juliana Abdul Hamid, Nurul Hafizah Abas, Sabariah Adnan, Azlan Mohd Arslamsyah, Mustazil Mohd Noor, Nur Farhana Mohd Fozi, Siti Zulfarina Mohamed, and Sharkawi Ahmad from the Department of Pharmacology, and Sharifah Nurul Aqilah Sayed Mohd Zaris from the Department of Orthopaedic and Traumatology, Universiti Kebangsaan Medical Centre.
Disclosure
The authors report no conflicts of interest in this work.
References
Pollycove R, Simon JA. Osteoporosis: screening and treatment in women. Clin Obstet Gynecol. 2012;55(3):681–691. | ||
Kling JM, Clarke BL, Sandhu NP. Osteoporosis prevention, screening, and treatment: a review. J Womens Health (Larchmt). 2014;23(7):563–572. | ||
Hernlund E, Svedbom A, Ivergard M, et al. Osteoporosis in the European Union: medical management, epidemiology and economic burden. A report prepared in collaboration with the International Osteoporosis Foundation (IOF) and the European Federation of Pharmaceutical Industry Associations (EFPIA). Arch Osteoporos. 2013;8:136. | ||
Singer A, Exuzides A, Spangler L, et al. Burden of illness for osteoporotic fractures compared with other serious diseases among postmenopausal women in the United States. Mayo Clin Proc. 2015;90(1):53–62. | ||
Siris ES, Adler R, Bilezikian J, et al. The clinical diagnosis of osteoporosis: a position statement from the National Bone Health Alliance Working Group. Osteoporos Int. 2014;25(5):1439–1443. | ||
Mithal A, Ebeling P. The Asia-Pacific Regional Audit: Epidemiology, Costs & Burden of Osteoporosis in 2013. Nyon: International Osteoporosis Foundation; 2013. | ||
Chin KY, Ima-Nirwana S. Calcaneal quantitative ultrasound as a determinant of bone health status: what properties of bone does it reflect? Int J Med Sci. 2013;10(12):1778–1783. | ||
Moayyeri A, Adams J, Adler R, et al. Quantitative ultrasound of the heel and fracture risk assessment: an updated meta-analysis. Osteoporos Int. 2012;23(1):143–153. | ||
Crandall CJ. Risk assessment tools for osteoporosis screening in postmenopausal women: a systematic review. Curr Osteoporos Rep. 2015;13(5):287–301. | ||
Rubin KH, Abrahamsen B, Friis-Holmberg T, et al. Comparison of different screening tools (FRAX(R), OST, ORAI, OSIRIS, SCORE and age alone) to identify women with increased risk of fracture. A population-based prospective study. Bone. 2013;56(1):16–22. | ||
Koh LK, Sedrine WB, Torralba TP, et al; Osteoporosis Self-Assessment Tool for Asians (OSTA) Research Group. A simple tool to identify Asian women at increased risk of osteoporosis. Osteoporos Int. 2001;12(8):699–705. | ||
Kung AW, Ho AY, Ross PD, Reginster JY. Development of a clinical assessment tool in identifying Asian men with low bone mineral density and comparison of its usefulness to quantitative bone ultrasound. Osteoporos Int. 2005;16(7):849–855. | ||
Sherchan B, Lamichhane A, Mahara DP. Osteoporosis self assessment tool for Asian (OSTA) index in comparison to quantitative ultrasound of the calcaneal in predicting low bone density. NOAJ. 2013;3(2):20–25. | ||
Yang NP, Lin T, Wang CS, Chou P. Correlation of osteoporosis screening by quantitative ultrasound of calcaneus and osteoporosis self-assessment tool for Asians in Taiwanese. J Formos Med Assoc. 2004;103(2):130–136. | ||
Chin KY, Kamaruddin AA, Low NY, Ima-Nirwana S. Effects of age, sex, and ethnicity on bone health status of the elderly in Kuala Lumpur, Malaysia. Clin Interv Aging. 2016;11:767–773. | ||
Chin KY, Low NY, Dewiputri WI, Ima-Nirwanaa S. Factors Associated with Bone Health in Malaysian Middle-Aged and Elderly Women Assessed via Quantitative Ultrasound. Int J Environ Res Public Health. 2017;14(7):E736. | ||
Chin KY, Soelaiman IN, Naina Mohamed I, et al. Testosterone is associated with age-related changes in bone health status, muscle strength and body composition in men. Aging Male. 2012;15(4):240–245. | ||
Chin KY, Soelaiman IN, Mohamed IN, et al. Discrepancy between the quantitative ultrasound value of Malaysian men and the manufacturer’s reference and the impact on classification of bone health status. J Clin Densitom. 2013;16(2):189–195. | ||
Kung AW, Ho AY, Sedrine WB, Reginster JY, Ross PD. Comparison of a simple clinical risk index and quantitative bone ultrasound for identifying women at increased risk of osteoporosis. Osteoporos Int. 2003;14(9):716–721. | ||
Cortet B, Boutry N, Dubois P, Legroux-Gérot I, Cotten A, Marchandise X. Does quantitative ultrasound of bone reflect more bone mineral density than bone microarchitecture? Calcif Tissue Int. 2004;74(1):60–67. | ||
Padilla F, Jenson F, Bousson V, Peyrin F, Laugier P. Relationships of trabecular bone structure with quantitative ultrasound parameters: in vitro study on human proximal femur using transmission and backscatter measurements. Bone. 2008;42(6):1193–1202. | ||
Huang JY, Song WZ, Zeng HR, Huang M, Wen QF. Performance of the osteoporosis self-assessment tool for Asians (OSTA) in screening osteoporosis among middle-aged and old women in the Chengdu Region of China. J Clin Densitom. 2015;18(4):539–545. | ||
Huang JY, Song WZ, Huang M. Effectiveness of osteoporosis self-assessment tool for Asians in screening for osteoporosis in healthy males over 40 years old in China. J Clin Densitom. 2017;20(2):153–159. | ||
Geater S, Leelawattana R, Geater A. Validation of the OSTA index for discriminating between high and low probability of femoral neck and lumbar spine osteoporosis among Thai postmenopausal women. J Med Assoc Thai. 2004;87(11):1286–1292. | ||
Lu C, Chen D, Cai Y, Wei S. Concordane of OSTA and lumbar spine BMD by DXA in identifying risk of osteoporosis. J Orthop Surg Res. 2006;1:14. | ||
Chin KY, Soelaiman IN, Mohamed IN, Ibrahim S, Wan Ngah WZ. The effects of age, physical activity level, and body anthropometry on calcaneal speed of sound value in men. Arch Osteoporos. 2012;7(1–2):135–145. |
 © 2017 The Author(s). This work is published and licensed by Dove Medical Press Limited. The
full terms of this license are available at https://www.dovepress.com/terms
and incorporate the Creative Commons Attribution
- Non Commercial (unported, 3.0) License.
By accessing the work you hereby accept the Terms. Non-commercial uses of the work are permitted
without any further permission from Dove Medical Press Limited, provided the work is properly
attributed. For permission for commercial use of this work, please see paragraphs 4.2 and 5 of our Terms.
© 2017 The Author(s). This work is published and licensed by Dove Medical Press Limited. The
full terms of this license are available at https://www.dovepress.com/terms
and incorporate the Creative Commons Attribution
- Non Commercial (unported, 3.0) License.
By accessing the work you hereby accept the Terms. Non-commercial uses of the work are permitted
without any further permission from Dove Medical Press Limited, provided the work is properly
attributed. For permission for commercial use of this work, please see paragraphs 4.2 and 5 of our Terms.