Back to Journals » Risk Management and Healthcare Policy » Volume 13
Adjusting Quality Control Chart Limits for WBC, RBC, Hb, and PLT Counts to Reduce Daily Control Risks in Hospital Laboratory
Authors Liao CM, Lin CM, Kuo CC, Chen MS ![]() , Huang CY, Lin CY
, Huang CY, Lin CY
Received 3 October 2020
Accepted for publication 11 November 2020
Published 17 December 2020 Volume 2020:13 Pages 3039—3049
DOI https://doi.org/10.2147/RMHP.S285180
Checked for plagiarism Yes
Review by Single anonymous peer review
Peer reviewer comments 2
Editor who approved publication: Professor Marco Carotenuto
Chen-Mao Liao,1,* Chih-Ming Lin,2,* Chin-Chia Kuo,1 Ming-Shu Chen,3 Chun-Yang Huang,4 Ching-Yuan Lin4
1Department of Applied Statistics and Information Science, Ming Chuan University, Taoyuan City 33352, Taiwan; R.O.C.; 2Department of Healthcare Information and Management, Ming Chuan University, Taoyuan City 33352, Taiwan; R.O.C.; 3Department of Healthcare Administration, College of Management and Healthcare, Oriental Institute of Technology, New Taipei City 22061, Taiwan; R.O.C.; 4Department of Laboratory Medicine, Ten Chan General Hospital, Chung-Li, Taoyuan City 32043, Taiwan; R.O.C.
*These authors contributed equally to this work
Correspondence: Ming-Shu Chen
Department of Healthcare Administration, College of Management and Healthcare, Oriental Institute of Technology, No58, Sec. 2, Sichuan Road, Pan-Chiao Dist., New Taipei City 22061, Taiwan; R.O.C.
Tel +886-2-77388000 ext. 6223
Email [email protected]
Background: To continuously improve medical quality and provide clinicians with more accurate blood test reports, this study collected blood quality control data in 2017 from a medical examination laboratory in a teaching level hospital located in Taoyuan City, Taiwan.
Material and Methods: The quality control data were arranged and analyzed from daily complete blood count (CBC), including white blood cells (WBC), red blood cells (RBC), hemoglobin (Hb), and platelets (PLT) recorded by a laboratory blood analyzer. Using the empirical Bayesian method, we estimated the variation of concentrations of the last and current batches to establish a novel control chart with adjusted upper and lower limits for the current batch, and then compared results with the traditional Shewhart method. The average run length (ARL) and sensitivity of the empirical Bayesian method were explored.
Results: The study found that ARL showed a qualified capability for the four blood routine tests when using the empirical Bayesian method. Compared to the Levey–Jennings control chart, the novel control chart presents an alert earlier when a deviation occurs and shows a fake alert later when there is no deviation.
Conclusion: The parallel tests showed that the longer the time is, the better the test’s proficiency. We concluded that the empirical Bayesian method could be applied effectively to improve the capability of daily control in CBC laboratory tests.
Keywords: empirical Bayesian, EB, average run length, ARL, complete blood count, CBC, Levey–Jennings control chart
Introduction
In an era of increasing global attention to evidence-based medicine, Taiwan’s health-care system is growing stronger, and the hospital system is changing rapidly. Coupled with a comprehensive national health insurance payment system, the number of people visiting hospitals is increasing. To accommodate the huge tide of patients, automated medical equipment and artificial intelligence systems have been introduced to ensure medical quality. Hospitals also gradually updated automatic medical laboratory equipment to enhance clinical blood testing and routine inspection of the work. Medical laboratory equipment can process clinical specimens, and the resulting test results can be used by clinical specialists as a reference for diagnosis, screening, treatment, and prognosis. The test results become an important basis for medical diagnosis, so the importance of the quality of inspection reports is self-evident.
Monitoring and quality control of laboratory instruments help reduce medical misjudgments and avoids the additional cost of medical errors, thereby reducing the waste of medical resources, which is an important element of clinical examination. A routine blood test (complete blood count, CBC) is the most common test in medical institutions: general outpatient or medical examination patients require essential routine blood tests such as a CBC blood test with white blood cells (WBC), red blood cells (RBC), hemoglobin (Hb) and platelets (PLT) being four of the most common. At present, the major hospital medical inspection units use the existing various quality control techniques to monitor and analyze.
The concept of control charts was proposed by Shewhart in 1924 and published in 1931.1 Shewhart argued that in a stable process, there would be some differences in each product after manufacturing, which would present a normal distribution of those variances, which was statistically assigned arithmetic mean (average) of the data, with a three-fold standard deviation (SD) as a control line, and a control chart to monitor the production process. A sample of the pipeline in the clinical laboratory is similar to a factory-produced item. The process is to obtain raw materials (patient specimens), add other formulations (different lots of control material), send them to the production line (laboratory instruments), and finally, produce the product (medical laboratory results).
Levey and Jennings (1950) used the Shewhart control chart to monitor samples from the quality control of daily clinical trials. Known as the Levey–Jennings control chart, the method opened a new direction for medical quality management in the hope of increasing the stability of the instrument.2 Later, Westgard et al (1981) applied multi-rule quality control from industrial engineering to the field of medical laboratory examination, which allowed a quality-control (QC) medical technologist to explore the random and systemic errors of the sample.3 Currently, many domestic and international scholars use the Levey–Jennings control chart and the Westgard rules in practical research to explore random and systemic errors in laboratory specimen testing.4
Using various lots of QC materials or reagents in hospital laboratory QC, mostly in accordance with the Westgard rules, the instrument is QC-measured twice daily and executed with each QC concentration reagent (level 1 and level 2). Due to the high cost of QC solutions, the Clinical Laboratory Improvement Amendments (CLIA) Final Rule in 2003 proposed that a minimum of once a day to do two concentrations of the QC reagent be allowed. Currently, domestic hospitals mostly follow the once-per-day QC rules for clinical laboratories, whereas large hospitals employ QC at least twice a day.
The clinical laboratory CBC QC reagent is normally made of sheep’s blood, with a short half-life and expiration period. QC reagents are replaced after about 48 days to ensure the batch is stable. Ezzelle et al (2008) recommended that a new batch number containing different lots of QC reagent should be implemented between the old and new batch number of the reagent between the parallel test.5 In the medical laboratory or when conducting quantitative tests, parallel testing should be performed by assaying the same samples or reference materials with both the old and new lot numbers to assess comparability. For most QC materials that are handled in a medical laboratory, the general rule for computing the center line and limits is 20 daily runs with two replicates per run. However, complete blood count analyses are an exception due to their short validity period, and the new and old lots of QC reagents are usually used concurrently in detection for 5 to 10 working days. When the new lot of QC reagent’s test value reaches the standard of admission, the QC technologist is to replace the QC reagent, and a parallel test is conducted with the new lot of QC reagent detection average as the new batch number of the control mean. The SD of an old batch of QC reagent detection values is used to construct a control chart of the new batch number for detection quality. However, there may be differences in the SDs of the new and old batch numbers of the QC reagent, as well as the risk of lack of representatives of centerline and limits. These issues can contribute to the overestimation or miscalculation of probabilities of error detection and false rejection, that is, the risk of “false alarms“ or ”lack of alarm” is high. We should therefore recognize these limitations and refrain from recommending such practices to minimize the effect of QC material data heterogeneity on the QC process.
In the traditional CBC daily quality control process, the QC technologist is responsible for making the control chart easy to control, and sometimes when the deviation is large, the QC technologist will contact and get the equipment supplier to modify and define the upper and lower control limits (UCL and LCL). However, this is not the standard practice and the QC process should be controlled by the lab staff and not the equipment-resident. Otherwise, the largest SD of the past five batch numbers will be used as the new SD to calculate the UCL and LCL of the new batch number detection value. This prompted the hospital to set the control limit, usually too loose and, therefore, unable to accurately produce a clear sense of the information in the clinical report.
Therefore, this study uses the empirical Bayesian method6–9 to integrate the past batch number quality control data SD and the new batch number quality control data standard difference information to carry out the adjustment of the boundary of the new batch number QC reagent control chart. This method should draw out the most suitable data for the new batch number QC reagent solution control chart.
This paper first introduces the example of the routine hospital blood CBC test, explaining the challenges encountered in the clinical examination of the teaching hospital. The application of the empirical Bayes method is offered, and the adjustment steps of the empirical Bayesian method control chart are introduced. The use of hospital CBC test examples explains how UCL and LCL are adjusted, then computer simulations and CBC daily QC test data are compared with traditional control charts. Finally, the conclusion and discussion are offered.
Materials and Methods
This study collected CBC analyzer (Sysmex XN-2000; Sysmex Corporation©, Hyogo, Japan) test data used in a teaching hospital in northern Taiwan. QC reagent (Sysmex XN CHECK; Sysmex Corporation©, Hyogo, Japan) data included a low concentration (Level-1), medium concentration (Level-2), and a high concentration (Level-3). QC reagent data were collected for one year from January to December 2017, with a daily QC in a morning and evening test, during which the WBC count, RBC count, Hb, and PLT count were collected. There are four test items in the period, with a total of seven lot numbers of QC reagent data. Table 1 shows descriptive statistics of CBC test data. For simplicity, this study selected four common CBC test items in which the QC test values included level-1, level-2, and level-3 variable coefficients for an elevated PLT count for analysis and explanation. The empirical Bayesian method could be applied effectively to improve daily quality control for CBC laboratory tests. Through the empirical Bayesian method, the data of the CBC test items were integrated and tested by the new and old batch number of the QC reagent, then imported into the chart for analysis and explanation.
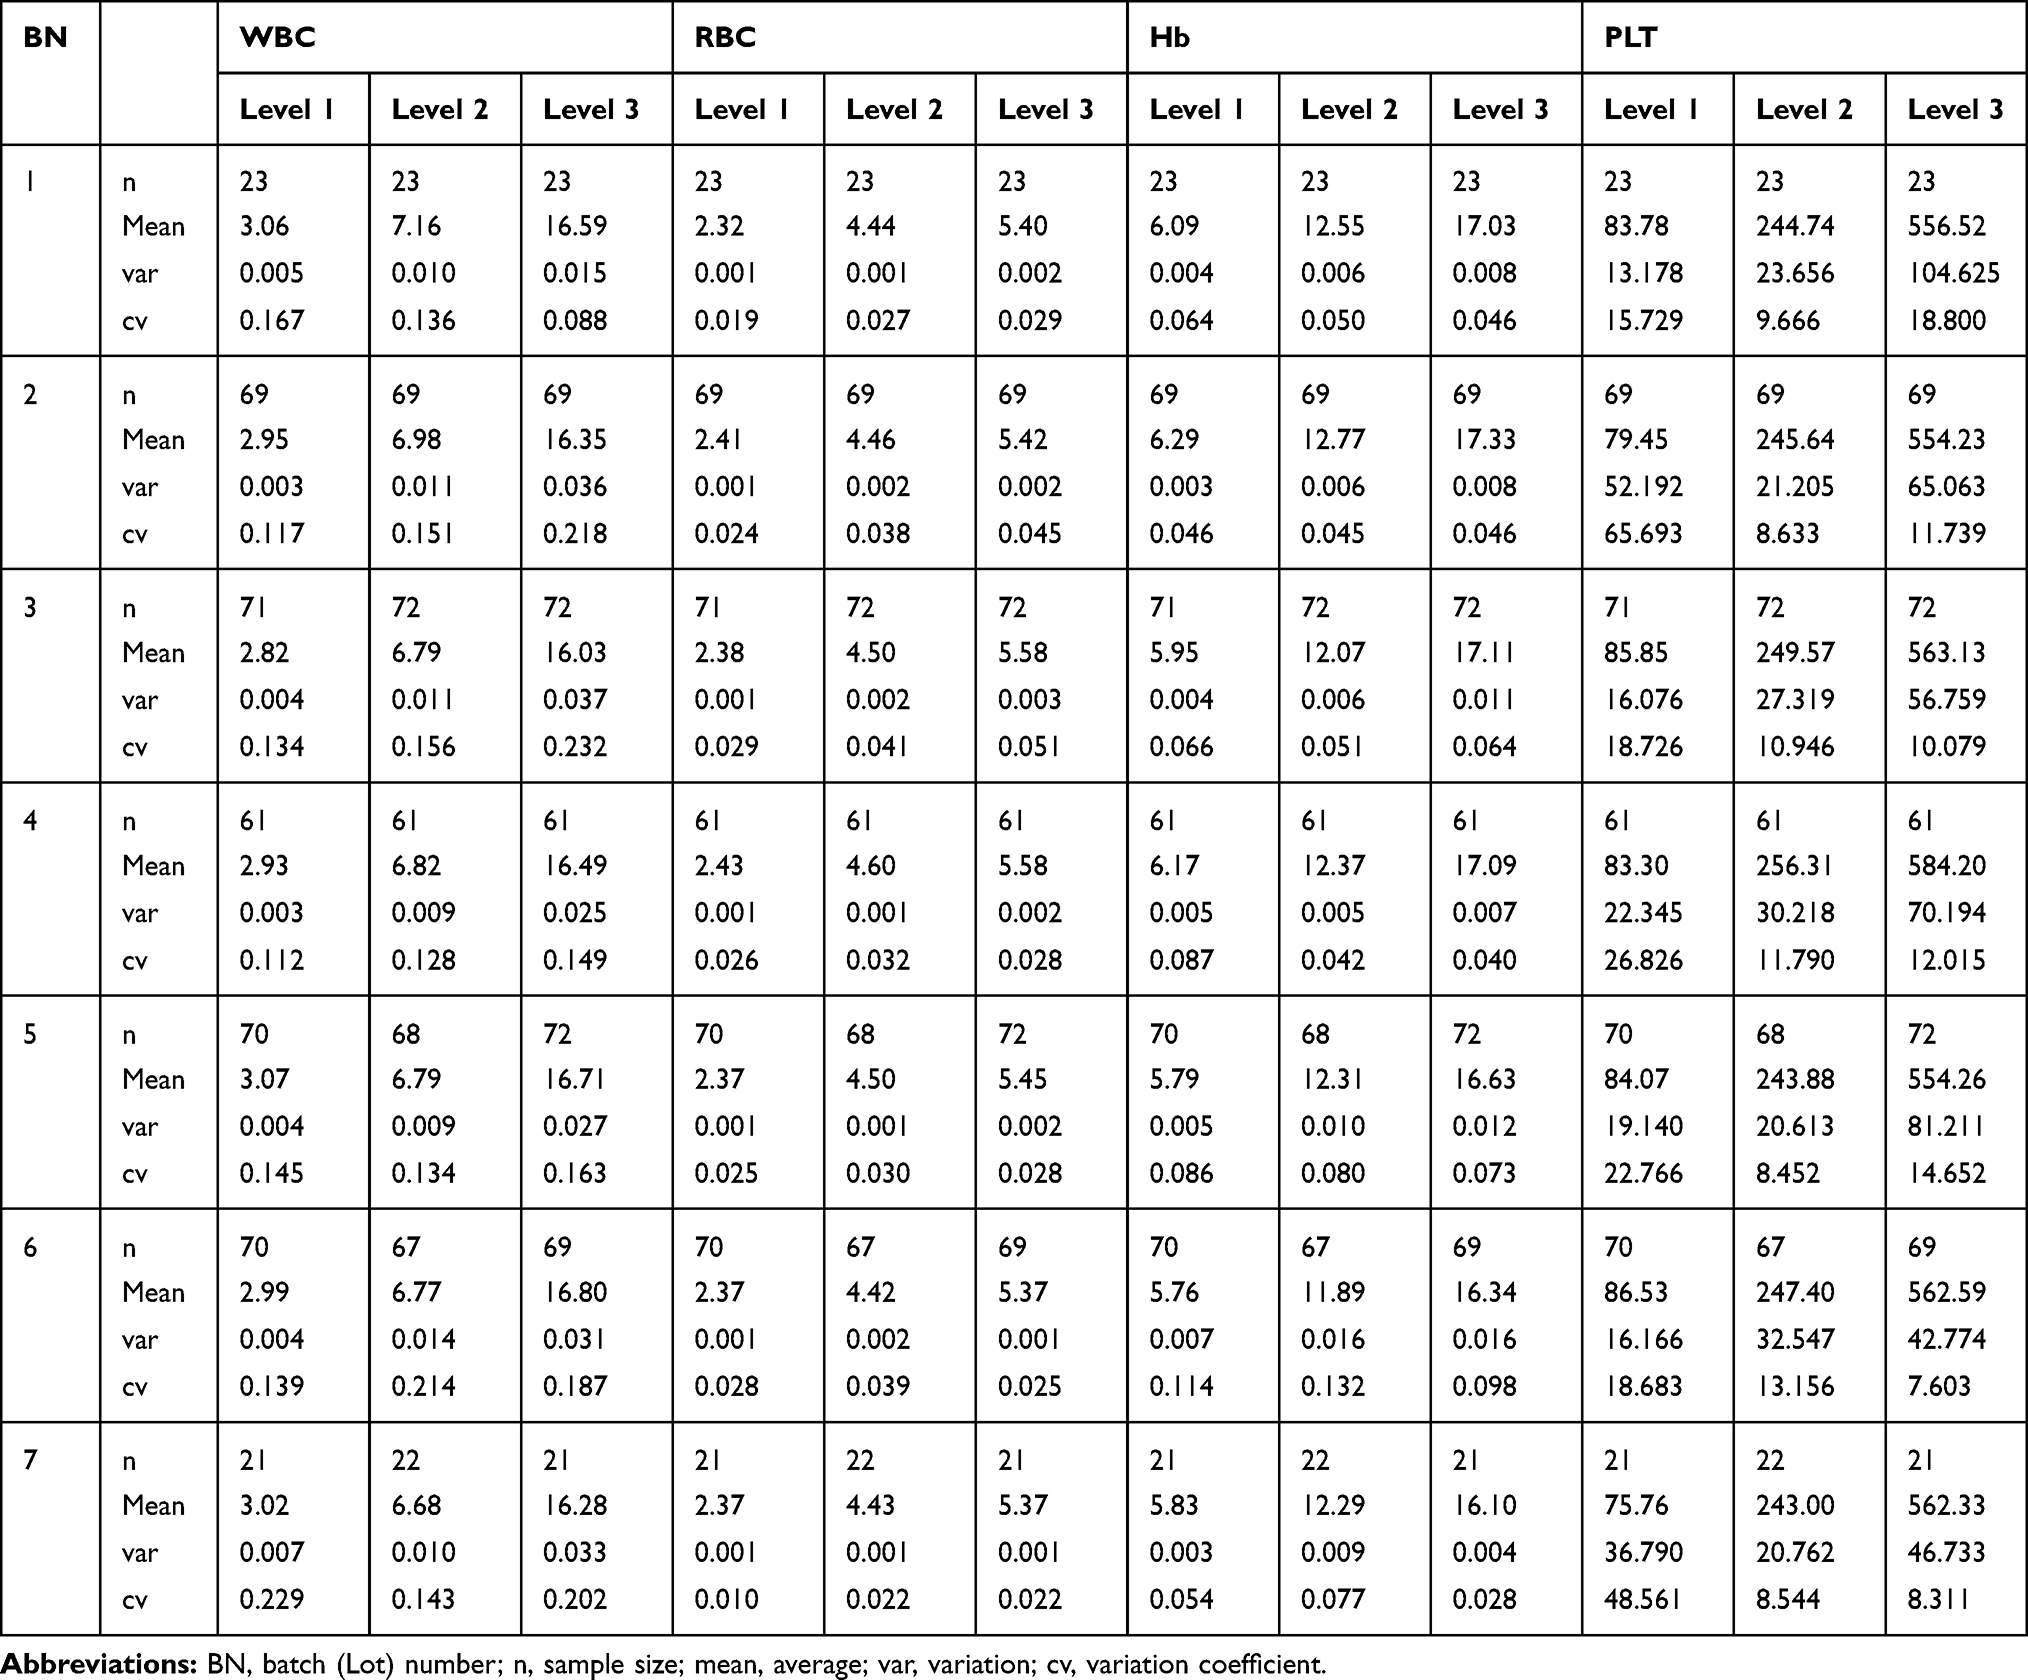 |
Table 1 Descriptive Statistics of CBC Test Items |
Table 1 shows that regardless of any concentration of QC data in the count detection test of PLT, the change in its detection value is significant. This study will use seven lot numbers of platelet counts in a low-concentration (Level-1) detection value series. Figure 1 indicates that the degree of variation is different, while Table 2 shows results of a Levene’s test to determine the number of the seven lot PLT QC count variations in the same degree of variation analysis. Results show that the variation of the PLT value of the seven numbers varies. In the medical laboratory where our study was conducted, we used the Westgard multi-rules for CBC daily QC. There are three limits, namely 1:3s, 2:2s, and R4s, which serve as rejection rules (an action plan was required when a rejection occurred). Also, the 1:2s was a warning rule. Therefore, this work maintains that for the control chart of the detection value of the QC reagent, the control limit should be adjusted using the different lot numbers. UCL and LCL can be adjusted using the empirical Bayesian method, which can increase the efficiency of the control chart.
 |
Table 2 Levene’s Variant Homogenous Test Analysis of Variance Table |
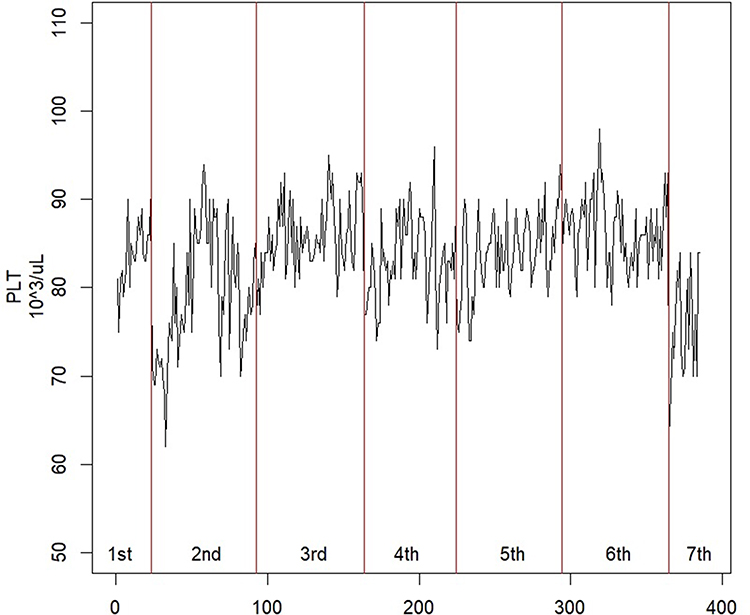 |
Figure 1 Comparison chart of Level-1 PLT count detection value. |
Bayes’ Theorem of Normally Distributed Variances
The Wilcoxon signed-rank test was used to test differences in the paired data in this study, with the S. Consider the detection values of a new QC reagent as  ,
, 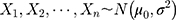 , in which
  is the mean detection of the reagent given by the manufacturer and
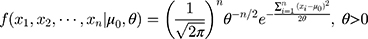
  . Given that the variance
  , the conditional probability distribution of
  is:
is:
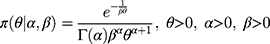
Bayesian analysis can be performed using conjugate prior distributions.6 Assuming that the prior distribution of the variance  is an inverse gamma distribution, that is,
  , then its probability density function is:
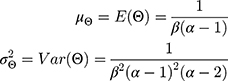
The mean and variance of the inverse gamma distribution are, respectively:
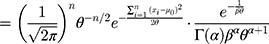
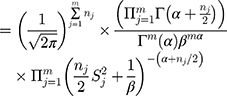
Then, the joint probability density function of  is
is
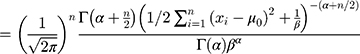
Therefore, the marginal joint probability of  can be deduced as:
According to Equation 1 and Equation 2), it can be deduced that when 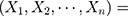
 , the posterior probability of
  is
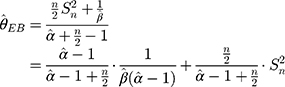
is 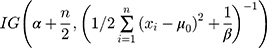 . Therefore, based on a Bayes estimator, the following equation can be derived from Equation 1:
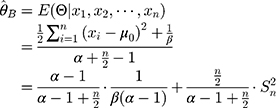
where  is the variance of the nth detection of a new QC reagent; and
  is the mean of prior distributions and the weighted mean of the variance of the detection values of a QC reagent with a new batch number.
Empirical Bayesian Method
The empirical Bayes method can be used to estimate parameters through the marginal distribution of a previous batch of QC data. Consider that a set of QC data in which the quantity of old batch numbers is
  ,7–9 its likelihood function will be where
  is the sample variance of the
  th batch of QC data.
Equation 5 can be used to determine the maximum likelihood estimator (MLE). Substituting  and
and  into
into  yields
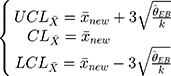
Therefore, the empirical Bayes method can be used to adjust the variance of the detections of a new batch of QC reagents. The control chart of the  , of which
  samples are drawn each time, is where
  is the sample mean during parallel testing.
Results
In this study, the samples were compared with a computer simulation. The sample of blood tests mentioned in subsection one is offered as an example of sample comparison using computer simulations. This example illustrates the steps of adjustment of the limits of the control chart, while section 2 assesses the effectiveness of the control chart before and after the adjustment of the limit by an average series of lengths.
Adjustment of Hospital CBC Routine Test Examples
The research samples in Table 1 were tested during the morning and evening as part of the hospital routine. The frequency of parallel testing was n = 10. In this section, the steps of adjusting the limits of the control chart are explained using low-concentration platelet detection values as an example.
Step 1: According to Table 1, there are six ( ) batch of detection data pertaining to a QC reagent. The batch sizes is
 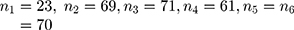 and the detected variance of each old batch is, respectively,
  .076
.076  . Substituting these values into the likelihood function (Equation 5)) will yield
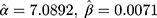 .
.
Step 2: The mean and variance of a low-concentration platelet sample with a new batch number as calculated through parallel testing are, respectively,  . Substituting
  into Equation 6) generates the empirical Bayes estimator of the variance of a detection value with a new batch number, that is,
  .
.
Step 3: In that the morning and evening test data must be monitored,  , and the control chart can be adjusted according to Equation (7) to
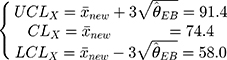
The control chart of the detection values of a sample with a new batch number can be adjusted through these three steps. In addition, since the maximum variance of the previous five batches is 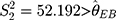 , then the limits of a control chart in a traditional hospital are wider, and its control chart is:
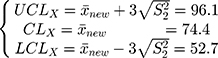
Figure 2 is the control chart of the platelet count detected in the low-concentration QC reagent with a new batch number. It is evident that there is a difference in the UCL and LCL before and after adjustment.
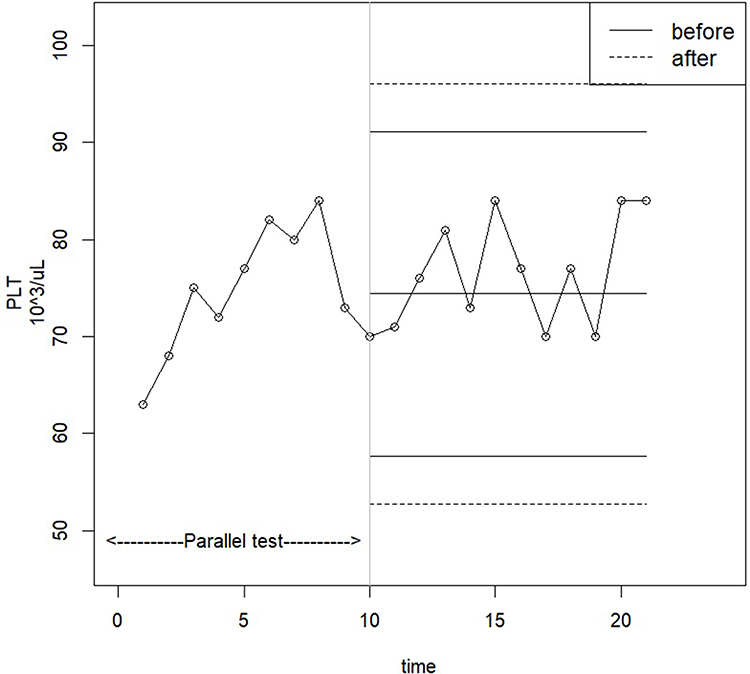 |
Figure 2 Control chart of the platelet count detected in the low-concentration reagent with a new batch number before and after adjustment. |
Regarding the detection values of the other two QC reagents (medium-concentration and high-concentration), their control charts before and after adjustment are shown in Figures 3 and 4, respectively. Based on these figures and Table 1, there is a greater change in variance of the low- and high-concentration detection values in reagents with new and old batch numbers. As a result, there is a greater difference in the adjusted control limit. However, the adjusted limits of the medium-concentration detection values are less significant as the difference between the variance values was marginal.
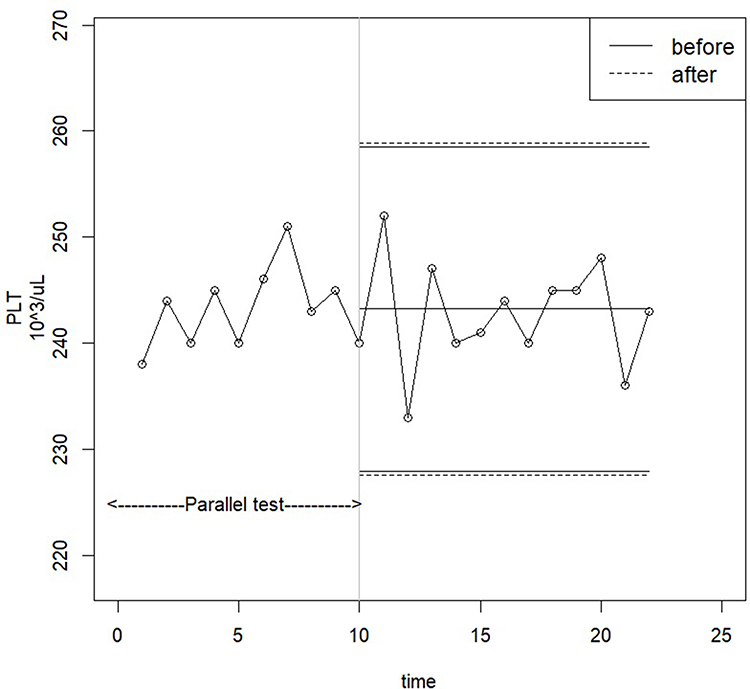 |
Figure 3 Control chart of the platelet count detected in the medium-concentration reagent with a new batch number before and after adjustment. |
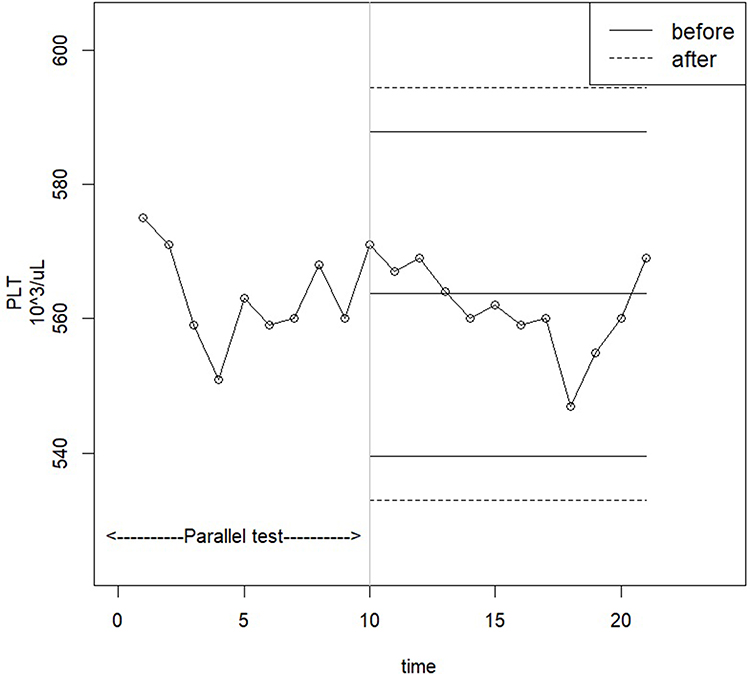 |
Figure 4 Control chart of the platelet count detected in the high-concentration reagent with a new batch number before and after adjustment. |
Comparison with Simulations
In this section, it is assumed that significant differences exist in the variances of QC reagents with different batch numbers. Computer simulations were performed to compare the average run lengths of the control charts before and after adjustment. By using the detection and estimated values of the low-concentration platelet sample, the simulation steps are as follows:
Step 1: Generate seven random variables from the inverse gamma distribution, namely 
Step 2: Generate the observed values of the six old batch numbers  , as well as the data of the ten (
 ) new batch numbers used in parallel testing, ie
 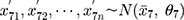 .
.
Step 3: Substitute the simulation data into the three steps in Section 4.1 and calculate the control limits before and after adjustment.
Step 4: Simulate the shift ( ) in detection value and the SD (
 ) of the data of the new batch numbers
 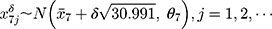 , until the control limit appears. Record the run lengths of the control limits before and after adjustment.
Step 5: Repeat steps 1 to 4 for a total of 2000 run lengths and calculate the average run length (ARL).
In the simulations of this study, the shift was set as  and 2 times the SD. The simulation results of the detected platelet count at each concentration are presented in Table 3. The results showed that the
  at a controlled state and the
  at uncontrolled states of the control charts before adjustment were all substantially large, which indicated that the control charts had lost their monitoring capacity. On the contrary, the
  ,
,  ,
,  at a controlled state of the control charts after adjustment were more adequate and are likely to be detected under uncontrollable conditions. Based on the simulation results, when differences exist in the variances of QC reagents with different batch numbers, Bayes method should be used to adjust the limits of a control chart, thus increasing its monitoring effectiveness.
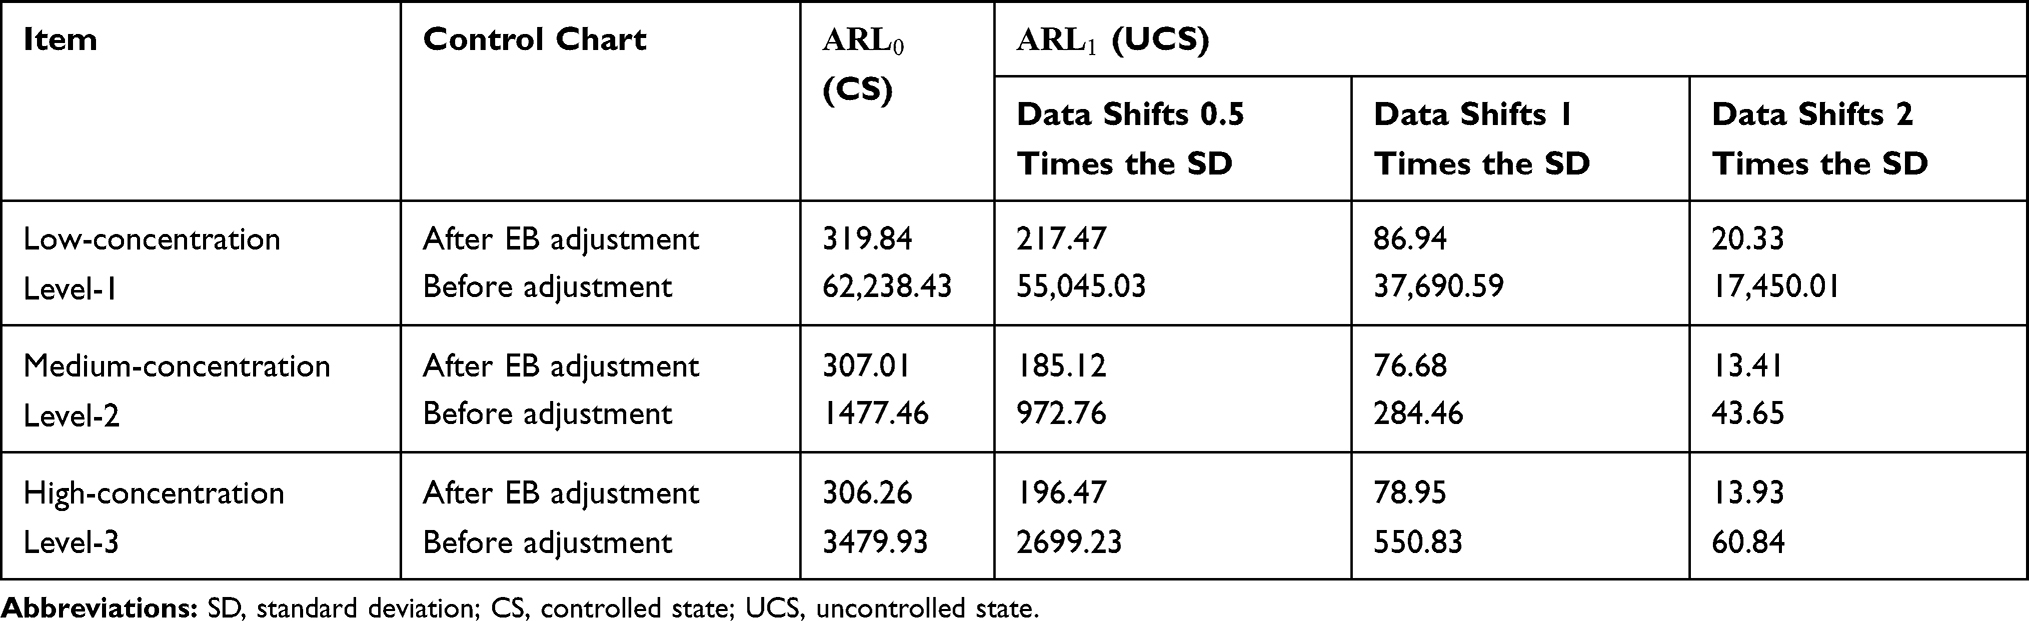 |
Table 3 ARLs of Detected Platelet Counts at Different Concentrations and at Controlled and Uncontrolled States |
Discussion
Westgard (1992) and Petersen et al (1996) agree that internal quality control (IQC) should be designed, the main purpose of which is to ensure that individual hospitals choose different laboratory instruments and methods. IQC is an important basis for verifying the various methods.10,11 According to the latest version of the medical laboratory international certification guidelines (ISO-15,189: 2012). The ISO 15,189 requires that ‘the laboratory shall design IQC systems that verify the attainment of the intended quality of results’.12 Although some medical laboratory scholars believe that the acceptability of the biological variability assessment method should be based on the relevant parameters, there is a consensus on the actual recommended parameters.13 Therefore, for the results of CBC blood tests in clinical patients, there must be a quality control mechanism to eliminate deviations and abnormalities.14
A full range of CBC blood routine test values (including WBC, RBC, Hb, Hct, PLT, MCV, MCH, MCHC, etc.), in the clinical setting can assist specialists to diagnose whether there is anemia, inflammatory infection, blood disease, and clotting disorders, blood cancer or leukemia. For special patients, the critical test report values, such as deviation, will directly affect the doctor’s medication and follow-up treatment methods.
To improve the stability and accuracy of the clinical laboratory QC process, the hospital clinical laboratory conducts parallel testing before replacing the new lot number of the CBC QC reagent. When parallel testing in the range of the admission, the clinical laboratory will use the SD of the old lot number to be the new SD of the new lot number. The SD of the old batch number is likely to be extended to the wider QC reagent standard deviation, resulting in the quality control being a more relaxed problem. Thus, when the laboratory instrument stability is systematically shifted, system errors will occur. Control charts made from existing control rules may not immediately detect abnormal alarms.
Through this study, we found that there are differences between the various lots of CBC QC reagents. Not correcting the SD leads to the control chart monitoring declining or losing capacity. The control chart of the empirical Bayesian method can significantly reduce this problem. Previous lot QC data is combined with the new lot number data to adjust the parameters suitable for the new lot number QC reagent SD control chart. The chart will not rely on the old lot number of the QC reagent’s SD: the new lot number test of the new quality control data will be more in line with the new lot of QC reagent’s SD. For quantitative tests, parallel testing should be performed by assaying the same samples or reference materials with both the old and new batch numbers to assess comparability. Since the original CV% in parallel testing (if the QC rules are accepted) will follow the old standard deviation, the standard deviation of the new batch control chart may lead to the problem of lax control. The rule applied for the empirical Bayesian method is to use the data of the new and old batches by weighing standard deviation when the data of the new batch are smaller in volume and the values are more dependent on the standard deviation of the old batch. However, when the new batch data increase in volume, the values will be more dependent on the standard deviation of the new batch. In other words, the proportion of new batch QC data used in the calculation process also increases, which can improve quality control performance. In practice, the weighted average of CV% in the past six months is generally used as the basis for the subsequent setting of internal quality control limits in order to better reflect the long-term stability of the instrument.
Clinical laboratory routine blood tests are a large part of modern medicine in hospital including biochemical test and complete blood counting. Nearly all inpatients, about half of patients in the emergency department, and nearly one-third of outpatients had laboratory results during their visit to the health-care center,15 comprising a quite portion (5–6%) of the total cost of healthcare.16,17 If we can improve the quality of CBC’s lab test reports, coupled with future cloud consolidation to avoid duplicate testing in the different hospitals even the same hospital, we believe that many health insurance medical expenses can be reduced, while improving the quality of care. At present, there is no golden standard protocol for clinical test personnel to perform parallel testing of QC reagents with new and old batch numbers as part of their CBC routine. In general, the number of parallel tests performed is approximately ten. There should be room for further exploration of the better daily quality control standards for CBC routine blood testing.
In addition to the importance that the United States and some Asian countries attach to laboratory quality management of the Clinical Laboratory Improvement Amendments (CLIA) and the World Health Organization (WHO) requirements,18,19 under the health-care insurance system, several advanced countries in Asia have been constantly committed to the laboratory quality improvement,20,21 reduced medical resource waste and improved cost-effectiveness of clinical laboratories.22–25 We believe that with every laboratory continuous efforts, it will be able to provide the more effective and accurate reporting for medical laboratories, become the better support for clinicians to diagnose diseases, and continuously improve the overall quality of health-care system.
Limitations
The major limitation of this study is that due to this being a hospital-based analysis, variations across different institutions must be considered. Is a pilot study, the lack of laboratories in the hospital, and lack of comparison between different labs is also the research limitation.
Conclusions
Continuous quality improvement in health-care systems is very important and helpful in hospitals.26 This study offers an innovative application of the empirical Bayesian method to adjust the SD of CBC QC reagent daily control data. The research aims to effectively import the hospital clinical laboratory quality control process to improve the quality control ability of the routine blood examination CBC test reports. Further research may build upon the standard parallel comparison quality control procedures in the different lots of QC reagents. Then, adjustments to the control chart limits may be made that are more suitable for the new lot number of the QC reagents. To clarify the variation of inter-/intra-laboratories, more evidence has to be obtained from different institutions.
Patient Consent for Publication
Not required.
Ethics Approval and Consent to Participate
Not required. There are no patient laboratory data in this study.
Consent for Publication
This manuscript contains no person’s details, images, or videos.
Acknowledgments
This research was funded by Ten Chan General Hospital (TCGH) and Ministry of Science and Technology (MOST) for supporting this research with ID TCGH 1060306001; MOST 105-2662-E-161-002-CC3; MOST 108-2221-E-161-003-MY2 and this research received no specific grant from any funding agency in the public, commercial, or not-for-profit sectors. The authors are grateful for all medical technologists of the laboratory of Ten-Chen Medical Group, Ten Chan General Hospital (Chung Li) for their support and help in this study. Chen-Mao Liao and Chih-Ming Lin are co-first authors for this study.
Disclosure
The authors report no conflicts of interest for this work.
References
1. Shewhart WA. Economic Control of Quality of Manufactured Product. London: Macmillan And Co Ltd; 1931.
2. Levey S, Jennings ER. The use of control charts in the clinical laboratory. Am J Clin Pathol. 1950;20(11_ts):1059–1066. doi:10.1093/ajcp/20.11_ts.1059
3. Westgard JO, Barry PL, Hunt MR, Groth T. A multi-rule Shewhart chart for quality control in clinical chemistry. Clin Chem. 1981;27(3):493–501. doi:10.1093/clinchem/27.3.493
4. Plebani M, Piva E. Erythrocyte sedimentation rate: use of fresh blood for quality control. Am J Clin Pathol. 2002;117(4):621–626. doi:10.1309/QB1G-6FRR-DNWX-BKQ9
5. Ezzelle J, Rodriguez-Chavez IR, Darden JM, et al. Guidelines on good clinical laboratory practice: bridging operations between research and clinical research laboratories. J Pharm Biomed Anal. 2008;46(1):18–29. doi:10.1016/j.jpba.2007.10.010
6. Berger JO. Statistical Decision Theory and Bayesian Analysis. Springer Science & Business Media; 2013.
7. Carlin BP, Louis TA. Bayes and Empirical Bayes Methods for Data Analysis. Vol. 88. Boca Raton: Chapman & Hall/CRC; 2000.
8. Berger J, Berliner LM. Robust Bayes and empirical Bayes analysis with $ _\epsilon $-contaminated priors. Ann Stat. 1986;14(2):461–486. doi:10.1214/aos/1176349933
9. Casella G. An introduction to empirical Bayes data analysis. Am Stat. 1985;39(2):83–87.
10. Hyltoft Petersen P, Ricos C, Stockl D, et al. Proposed guidelines for the internal quality control of analytical results in the medical laboratory. Eur J Clin Chem Clin Biochem. 1996;34(12):983–1000.
11. Westgard JO. Assuring analytical quality through process planning and quality control. Arch Pathol Lab Med. 1992;116(7):765–769.
12. ISO. ISO, 15189: 2012, Medical Laboratories–Particular Requirements for Quality and Competence. Geneva: ISO; 2012.
13. Cooper G, DeJonge N, Ehrmeyer S, et al. Collective opinion paper on findings of the 2010 convocation of experts on laboratory quality. Clin Chem Lab Med. 2011;49(5):793–802. doi:10.1515/CCLM.2011.149
14. Miller W, Erek A, Cunningham TD, Oladipo O, Scott MG, Johnson RE. Commutability limitations influence quality control results with different reagent lots. Clin Chem. 2011;57(1):76–83. doi:10.1373/clinchem.2010.148106
15. Ngo A, Gandhi P, Miller WG. Frequency that laboratory tests influence medical decisions. J Appl Lab Med. 2017;1:410–414. doi:10.1373/jalm.2016.021634
16. Hu WY, Yeh CF, Shiao AS, et al. Effects of diagnosis-related group payment on health-care provider behaviors: a consecutive three-period study. J Chin Med Assoc. 2015;78:678–685. doi:10.1016/j.jcma.2015.06.012
17. Choi JW, Kim SJ, Park HK, et al. Effects of a mandatory DRG payment system in South Korea: analysis of multi-year nationwide hospital claims data. BMC Health Serv Res. 2019;19:776.
18. World Health Organization. WHO Manual for Organizing a Nati Onal External Quality Assessment Programme for Health Laboratories and Other Testing Sites. Geneva, Switzerland: WHO Press; 2016.
19. Code of federal regulations chapter IV SubchapterGPart 493 SubpartASection 493.17-test categorization. Available from: https://www.ecfr.gov/cgi-bin/text-idx?SID=1248e3189da5e5f936e55315402bc38b&node=pt42.5.493&rgn=div5.
20. Kim S, Yun YM, Kim H, et al. The new diagnosis-related group reimbursement system and laboratory test quality in Korea: analysis of external quality assessment results. Healthcare. 2020;8(2):127–137. doi:10.3390/healthcare8020127
21. Kim H, Kim S, Yun YM, et al. Status of quality control for laboratory tests of medical institutions in Korea: analysis of 10 years of data on external quality assessment participation. Healthcare. 2020;8(2):75–82. doi:10.3390/healthcare8020075
22. Shimetani N. Medical reimbursement for diagnostic tests. Expert Rev Pharm Outcomes Res. 2004;4:127–130.
23. Su BG, Chen SF, Yeh SH, et al. Cost evaluation of clinical laboratory in Taiwan’s National Health System by using activity-based costing. Clin Chem Lab Med. 2016;54(11):1753–1758. doi:10.1515/cclm-2016-0193
24. Jun JK, Sung NY, Song SH, et al. Budget impact of the accreditation program for clinical laboratories on colorectal cancer screening via fecal immunochemical testing: results from the national cancer screening program in Korea. Ann Lab Med. 2018;38:249–254. doi:10.3343/alm.2018.38.3.249
25. Inal TC, Goruroglu Ozturk O, Kibar F, et al. A. Lean six sigma methodologies improve clinical laboratory efficiency and reduce turnaround times. J Clin Lab Anal. 2018;32(1):e22180. doi:10.1002/jcla.22180
26. Zhang D, Liao M, Liu T. Implementation and promotion of quality control circle: a starter for quality improvement in Chinese hospitals. Risk Manag Healthc Policy. 2020;Volume 13(13):1215–1224. doi:10.2147/RMHP.S261998
 © 2020 The Author(s). This work is published and licensed by Dove Medical Press Limited. The
full terms of this license are available at https://www.dovepress.com/terms
and incorporate the Creative Commons Attribution
- Non Commercial (unported, 3.0) License.
By accessing the work you hereby accept the Terms. Non-commercial uses of the work are permitted
without any further permission from Dove Medical Press Limited, provided the work is properly
attributed. For permission for commercial use of this work, please see paragraphs 4.2 and 5 of our Terms.
© 2020 The Author(s). This work is published and licensed by Dove Medical Press Limited. The
full terms of this license are available at https://www.dovepress.com/terms
and incorporate the Creative Commons Attribution
- Non Commercial (unported, 3.0) License.
By accessing the work you hereby accept the Terms. Non-commercial uses of the work are permitted
without any further permission from Dove Medical Press Limited, provided the work is properly
attributed. For permission for commercial use of this work, please see paragraphs 4.2 and 5 of our Terms.