Back to Journals » Neuropsychiatric Disease and Treatment » Volume 14
Acetaminophen, antibiotics, ear infection, breastfeeding, vitamin D drops, and autism: an epidemiological study
Authors Bittker SS ![]() , Bell KR
, Bell KR ![]()
Received 10 December 2017
Accepted for publication 23 March 2018
Published 31 May 2018 Volume 2018:14 Pages 1399—1414
DOI https://doi.org/10.2147/NDT.S158811
Checked for plagiarism Yes
Review by Single anonymous peer review
Peer reviewer comments 4
Editor who approved publication: Dr Roger Pinder
Video abstract presented by Seth Bittker.
Views: 368
Seth Scott Bittker,1 Kathleen Roberta Bell2
1Interdisciplinary Center for Innovative Theory and Empirics (INCITE), Columbia University, New York, NY, USA; 2Independent Contractor, Waterloo, ON, Canada
Background: While many studies have examined environmental risk factors for autism spectrum disorder (ASD), much of the research focus has been on prenatal or perinatal factors. Yet, the postnatal environment may affect the risk of ASD as well.
Objective: To determine whether a set of five postnatal variables are associated with ASD. These variables are: acetaminophen exposure, antibiotic exposure, incidence of ear infection, decreased duration of breastfeeding, and decreased consumption of oral vitamin D drops.
Materials and methods: An Internet-based survey was conducted. Participants were parents living in the USA with at least one biological child between 3 and 12 years of age. Potential participants were informed about the survey via postings on social media, websites, and listservs and were offered an opportunity to participate in a raffle as well. Participants were also recruited through the Interactive Autism Network.
Results: There were 1,741 completed survey responses. After exclusions, there remained 1,001 responses associated with children with ASD (cases) and 514 responses associated with children who do not have ASD (controls). In this data set, doses of postnatal acetaminophen (adjusted odds ratio [aOR] 1.016, CI: 1.003–1.032, p=0.026), courses of postnatal antibiotics (aOR 1.103, CI: 1.046–1.168, p<0.001), incidence of postnatal ear infection (aOR 1.137, CI: 1.046–1.236, p=0.003), and decreased duration of breastfeeding (aOR 0.948, CI: 0.932–0.965, p<0.001) are all associated with ASD when adjusted for eight demographic variables. A weak association between oral vitamin D drop exposure and ASD was also found when adjusted for breastfeeding and demographics (aOR 1.025, CI: 0.995–1.056, p=0.102).
Conclusion: This study adds to evidence that postnatal acetaminophen use, postnatal antibiotic use, incidence of ear infection, and early weaning are associated with an increased risk of ASD. It also finds that postnatal oral vitamin D drops are weakly associated with ASD when adjusted for breastfeeding and demographics.
Keywords: ASD, folate, epidemiology, risk factor, postnatal
Plain language summary
In order to determine whether certain factors are associated with autism spectrum disorder (ASD), we conducted an Internet survey among parents whose children have ASD and parents whose children do not have ASD. Based on the response from this survey, we find that increased use of acetaminophen among children under 2 years, increased use of antibiotics among children under 2 years, increased cases of ear infection among children under 2 years, and early weaning are associated with ASD. These results account for the associations with demographic variables. In addition, we find a weak association between consumption of oral vitamin D drops and ASD when accounting for associations with breastfeeding and demographics.
Introduction
Autism spectrum disorder (ASD) is a neurodevelopmental disorder characterized by restricted and repetitive behaviors and deficits in social communication.1 Evidence suggests that both genetic and environmental factors are involved in its etiology.2 While many studies have been conducted to examine possible environmental risk factors for ASD, much of the research focus has been on prenatal or perinatal factors.3–5 Yet other studies have found that some infants with seemingly normal or near-normal development in early infancy later regress into ASD.6,7 This suggests that postnatal factors may be of some importance as well.
Some potential postnatal risk factors that have been considered are decreased breastfeeding,8 antibiotic exposure,9 ear infection,10 acetaminophen exposure,11 and decreased vitamin D consumption.12 With respect to breastfeeding, some studies have found that longer duration of breastfeeding is associated with decreased risk of ASD,8,13,14 but one large study found no such effect.15 With respect to antibiotics, prenatal maternal exposure has been found to be associated with ASD.16 Separately, there have been anecdotal reports of regression into ASD following postnatal antibiotic exposure.17 Two small case–control studies, one with 24 controls and the other with 11 controls, found an association between postnatal antibiotics and ASD.9,18 With respect to ear infection, three small case–control studies found an association with ASD,9,10,19 but one large case–control study found the opposite.20 With respect to acetaminophen, a case–control study using Danish medical records found that prenatal exposure is associated with ASD21 and a small case–control survey study found that postnatal exposure is associated with ASD.11 A recent review summarized evidence that postnatal exposure may be a risk factor for ASD and concluded that a rigorous study examining whether it increases the risk is urgently needed.22 With respect to postnatal oral vitamin D exposure, some have inferred that it may reduce the risk based on a variety of arguments,12,23,24 but others have suggested that excessive multivitamin consumption in general during infancy may increase the risk,25 and one of the authors of this study has offered some epidemiological evidence that postnatal oral vitamin D is unlikely to decrease the risk.26
Therefore, with respect to these potential postnatal risk factors for ASD, it would appear the effects of duration of breastfeeding, ear infection, and oral vitamin D supplementation are unsettled. Postnatal antibiotics have been found to be associated with ASD in two small studies, and postnatal acetaminophen has been found be associated with ASD in one small study that has yet to be replicated. The present study was designed to examine these potential factors.
Materials and methods
Questionnaire
A survey was constructed using Qualtrics software. Participants were to be biological parents of children who were born and resided in the USA, and at least one child of each participant was to be between 3 and 12 years of age. The survey had between 22 and 25 multiple-choice questions, depending upon whether the participant had a child with ASD. Each participant with a child with ASD was asked questions regarding the participant’s youngest child with ASD. Each participant whose children did not have ASD was asked questions regarding the participant’s youngest child between 3 and 12 years of age.
Most questions on postnatal exposures were focused on the first 2 years of life. Five questions had an “Other” answer with a textbox to permit entry of additional information. For example, one question asked of ASD parents was, “Does your child have a known genetic syndrome?” The set of non-exclusive multiple-choice answers included “Fragile X”, “Rett Syndrome”, “Tuberous Sclerosis”, “None”, and an “Other” box where participants could enter other genetic conditions.
Ethics
This study was approved by the Institutional Review Board of Columbia University Medical School. All participants whose responses were used in this study completed an electronic informed consent, which served as the first question in the survey.
Recruitment
Potential participants were informed via postings, listservs, and landing pages that the investigators were conducting a short Internet-based research survey. Participants were also offered the opportunity to enter a raffle for a $50 gift card. To increase participation, especially among parents of children who do not have ASD, participants were encouraged to share the survey with friends whose children do not appear to have ASD. A thank you landing page that appeared upon completion of the survey included buttons for sharing the survey on Facebook and for sending an email about the survey to friends.
Posts or emails about the survey were sent to the members of 216 different groups (Table S1) as follows: 32 Autism Society of America chapters, 160 other ASD-related groups, 20 general parenting groups, and 4 other groups. This was done with the permission and often the direct involvement of the leadership of each group. Of these groups, 196 were Facebook groups, 18 were listservs, and 2 were websites.
Some participants were recruited with the assistance of the Interactive Autism Network (IAN) Research Database at the Kennedy Krieger Institute, Baltimore, MD, which is a partnership of Kennedy Krieger Institute and the Simons Foundation and is approved by the Johns Hopkins Medicine Institutional Review Board. The IAN Research Database has been clinically validated,27,28 as well as verified by a review of parent- and professional-provided medical records,29 and participants must have received a professional diagnosis of ASD.
To decrease the likelihood of bias, groups with strongly held views on the etiology of ASD were not targeted for recruitment. Nor were groups where vitamin supplementation was a theme. The survey was referred to as “Developmental Factors Survey”, and the specific factors being examined were not disclosed in any of the recruitment materials. To decrease the likelihood of survey fraud, the IP addresses of participants were recorded and participants were asked to provide their email addresses.
Exclusions
After the data were collected, case and control groups were determined. Only responses from biological parents residing in the USA who answered the survey questions regarding a child between 3 and 12 years of age were included. Responses were then separated into ASD and non-ASD buckets. The ASD bucket as defined in this step included responses associated with children who have ASD, autism, Asperger’s, or pervasive developmental disorder-not otherwise specified according to the survey respondent. While the latter three diagnoses are no longer used, older children may have been diagnosed with these conditions before 2014.30
The following were excluded from the ASD bucket: those not diagnosed by a professional and those with a genetic condition of high penetrance for ASD. As this study is focused on potential postnatal risk factors, if a child’s diagnosis could be attributed to a known genetic factor, which is by the nature of genetics a prenatal factor, exclusion of these individuals from the case set is justified.
One of the questions in the survey was whether the child has attention-deficit/hyperactivity disorder, attention deficit disorder, sensory processing disorder, apraxia, or some other neurologic condition. Often, some symptoms of these disorders are present in those with ASD31–33 and some of these disorders appear to share some common genetic risk factors with ASD.34,35 Likewise, it seems conceivable that they may share some non-genetic risk factors with ASD as well. Therefore, survey responses on children with any of these four conditions were excluded from the control group.
Construction of variables
An initial set of raw binary categorical variables was constructed based on the specific answers to eight questions from the survey. For example, one question in the survey was on breastfeeding duration, and five binary categorical variables were constructed from the five answers to this question.
Using data from these same eight questions, a second distinct set of seven scaled exposure variables was constructed to represent magnitudes of exposure by associating a number with each answer of each of the questions of interest. These seven scaled exposure variables are: breastfeeding (months), antibiotic (courses), ear infection (number), acetaminophen (doses), ibuprofen (doses), vitamin D drop (months × dose), and folate (binary).
For example, the discrete answers to a question on the number of courses of antibiotics provided up to the second birthday were: “None”, “1”, “2–3”, “4–7”, “8–15”, “16+”, and “I’m not sure”. Each answer was associated with the number corresponding to the lower bound in the respective range. Specifically, the corresponding numbers for these answers were 0, 1, 2, 4, 8, 16, and not available (NA). This correspondence was used to construct the scaled antibiotic variable.
While there were two questions related to vitamin D drops in the survey (one for duration and the other for dose), a single cumulative vitamin D drop exposure variable was included among the seven scaled variables used in most analyses to parsimoniously represent vitamin D drop exposure. Specifically, it was defined as a vitamin D drop duration variable multiplied by a vitamin D drop dose variable.
Some research on prenatal folate suggests that maternal supplementation around the time of conception is associated with a decreased risk of ASD.36–38 Thus, the folate variable was defined to be a binary categorical variable, with a value of 1 if the respondent indicated that the biological mother used prenatal folate for the entire pregnancy or just the first trimester and a value of 0 otherwise.
Eight demographic variables were also constructed. Some were scaled variables such as education where the answers were assigned to ordinal numbers. Others were binary categorical variables such as ethnicity, where “White (non-Hispanic)” was associated with 0 and all other ethnicities were associated with 1.
Two additional scaled exposure variables were defined. One was a low-granularity antibiotic variable. The antibiotic question on the survey included six answers with ranges. The ear infection variable included four answers with ranges. Thus, the original antibiotic variable provides data with greater granularity than the ear infection variable. The low-granularity antibiotic variable was constructed to provide data at comparable granularity. Specifically, the top three ranges for antibiotics were assigned to a single value for this variable.
The other scaled exposure variable was a crude total oral vitamin D variable, which was constructed to represent the average amount of oral vitamin D consumed in the first 18 months of life from vitamin D drops, breast milk, infant formula, and cow’s milk. It was calculated using answers from survey questions and data from the literature, and was normalized to 400 International Units (IU) per day, which is the Recommended Dietary Allowance for oral vitamin D for those <1 year old.39
Breast milk, infant formula, and cow’s milk average about 45 IU of vitamin D per liter,40 450 IU of vitamin D per liter,41 and 500 IU of vitamin D per liter,42 respectively. The latter two fluids have more vitamin D because they are highly fortified.41,42 This variable assumed each infant received one of these primary sources of sustenance at any given time during its development. The primary source of sustenance for each month of development was determined by the answer to the breastfeeding question in the survey. For months 1 through 12, those who were not breastfed during that month were assumed to receive infant formula. After 12 months, those who were not breastfed for that time were assumed to receive cow’s milk. The daily exposure to the primary source of sustenance in any given month was assumed to be 600 mL, which is generally consistent with the literature on consumption of breast milk and infant formula.43,44
Details on the encoding of the scaled exposure variables and the encoding of the demographic variables are provided in Tables S2 and S3, respectively.
Statistical analysis
Analyses were run using the R statistical package. Crude Wald odds ratios (ORs) and CIs were computed for each of the binary categorical variables. Pearson’s correlations between each pair of the seven scaled exposure variables were calculated.
A consistent set of covariates was determined objectively for most logistic regressions using the following procedure. A candidate set of covariates was defined to be the set of eight demographic variables. For each of the seven scaled exposure variables, a minimal set of covariates was selected from this candidate set of covariates, using Akaike information criterion (AIC) for a logistic regression of the scaled exposure variable in question against the outcome of ASD. AIC is a measure of relative model quality.45 The superset of covariates obtained from these seven minimal sets defined the consistent set of covariates to be used in most analyses.
Logistic regressions were run to compute ORs and adjusted odds ratios (aORs) for the seven scaled exposure variables using a consistent set of covariates. In addition, six models, each of which included pairs of potentially related variables, were constructed: 1) Antibiotic/Ear infection; 2) Low-granularity antibiotic/Ear infection; 3) Acetaminophen/Ibuprofen, an Analgesic model; 4) Breastfeeding/Vitamin D drops; 5) Breastfeeding/Vitamin D drops excluding cases with ASD siblings; and 6) Breastfeeding/Total vitamin D.
An additional analysis was run on prenatal folate, where the underlying data set was enlarged to include those with genetic conditions of high penetrance for ASD.
Separately, a multifactor ASD risk model was constructed. Candidate variables for inclusion in this model consisted of the seven scaled exposure variables and the eight demographic variables previously described. Variable selection for this model was determined objectively using AIC.45
Results
Cases and controls
The survey was opened to participants on April 5, 2017 and was closed on May 29, 2017. There were 1,741 completed survey responses.
Following the procedure described in the “Materials and methods” section, the raw responses were pared down to case and control groups as shown in Figure 1. Through the “Other” textbox on the genetic syndrome question, some respondents indicated that genetic testing was planned or that the child had a common single-nucleotide polymorphism such as MTHFR. As these answers do not qualify as known genetic conditions of high penetrance for ASD, these responses were not excluded from the case set. After exclusions, 1,515 responses were included in the primary case–control analyses: 1,001 cases and 514 controls.
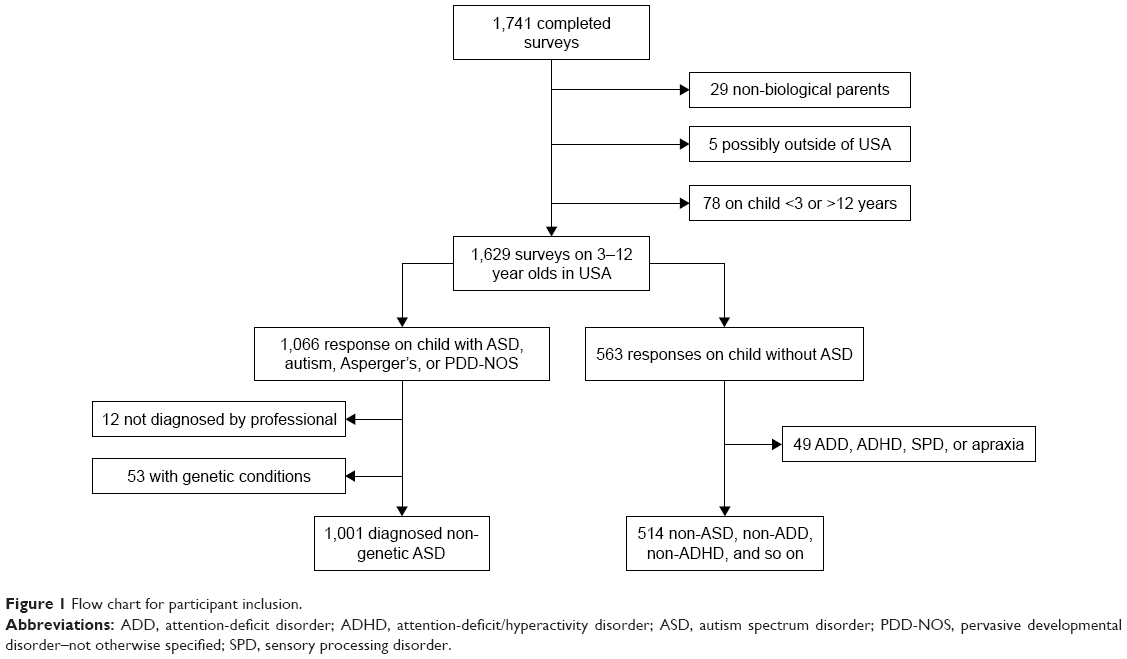 | Figure 1 Flow chart for participant inclusion. |
Demographics
Table 1 provides the demographic characteristics of the participants. Case children were on average 1.8 years older than controls, were much more likely to be male than controls, and were somewhat more ethnically diverse than controls. There was proportionally greater representation in the South among cases than controls and, conversely, proportionally less case representation in the Midwest than controls. Case biological mothers were on average 1.2 years younger than control biological mothers at the birth of the child and were somewhat less educated than control biological mothers. The survey respondents for both cases and controls were overwhelmingly biological mothers.
 | Table 1 Demographics |
Of the groups targeted, the greatest number of responses was generated by IAN. The “How did you hear about the survey?” question did not have an explicit answer for IAN, but many who learned about the survey through IAN selected “Other” and filled in “IAN” or some variant in a textbox. Due to the large number of participants who did this, these responses have been separated from the residual “Other” responses in Table 1.
ORs and aORs
Wald ORs for the set of categorical variables constructed from the raw survey responses are reported in Table 2. Six of the eight questions highlighted in this table have categorical variables with statistically significant associations with ASD. An alternative set of dose-dependent Wald ORs relative to no exposure were computed on the categorical variables and are reported in Table S4.
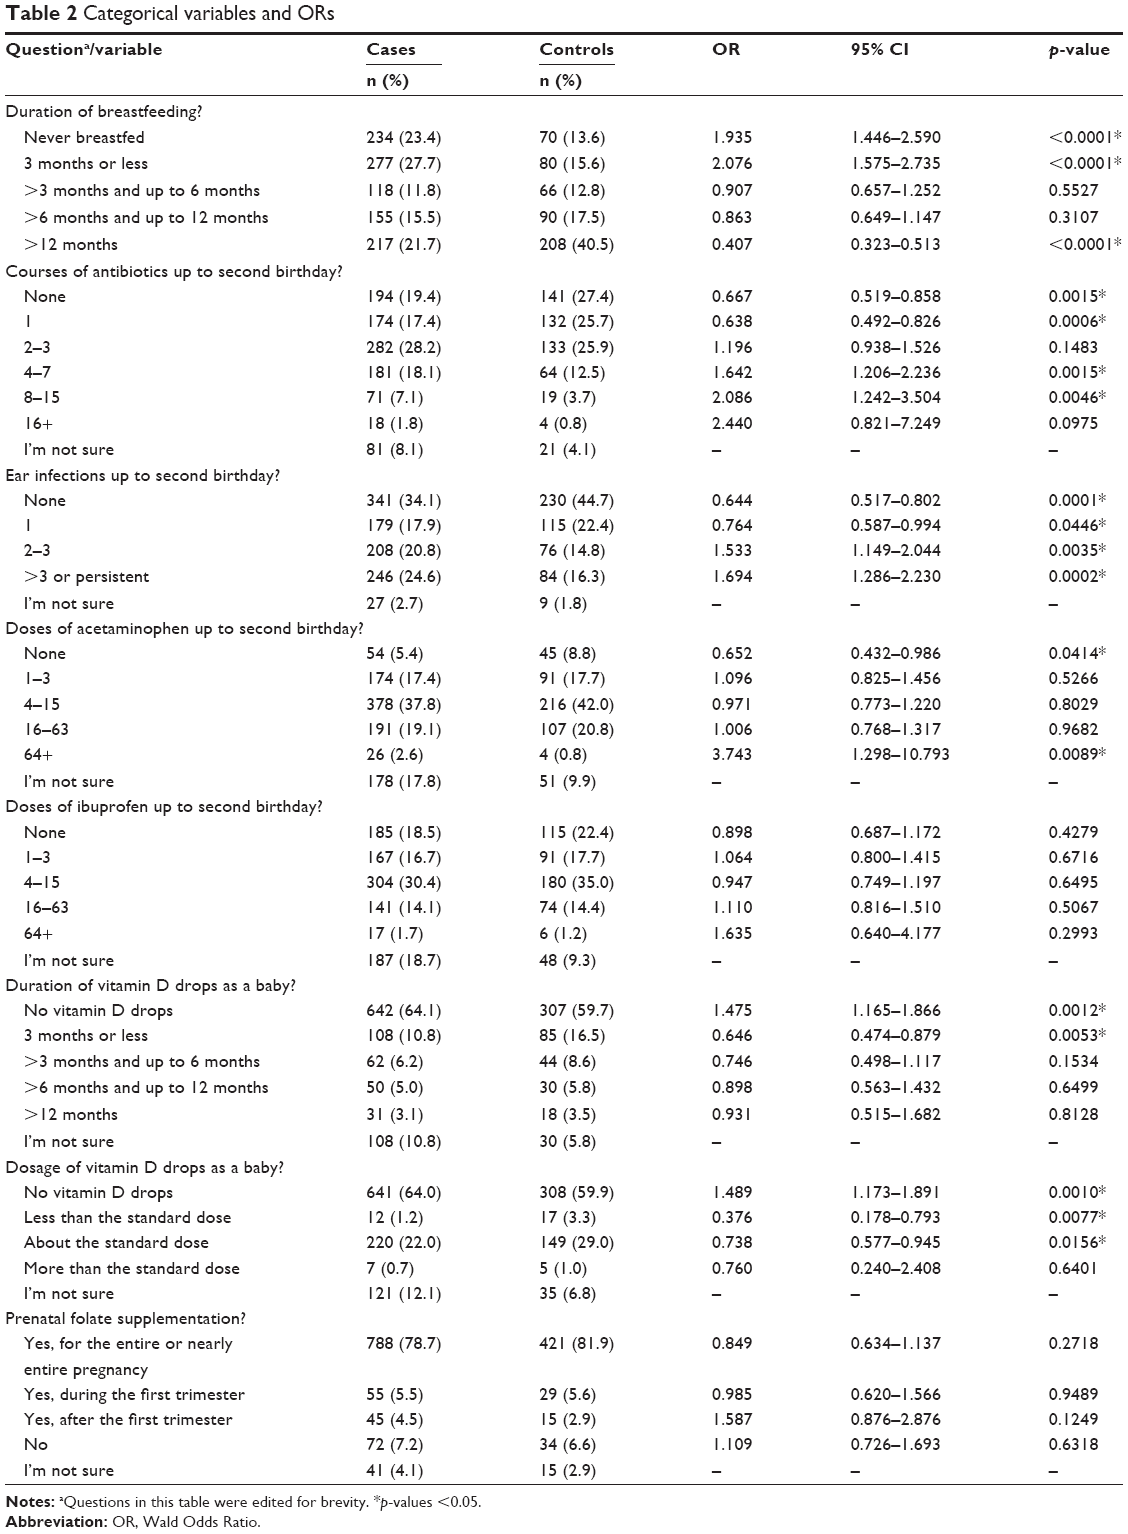 | Table 2 Categorical variables and ORs |
Correlations were computed between each pair of the seven scaled exposure variables and are shown in Table 3, with n’s and p-values in Tables S5 and S6, respectively. Many questions in the survey included an “I’m not sure” answer, or other answers that conveyed limited information. Thus, some variables had missing data. Pairwise deletion was used when computing correlations.
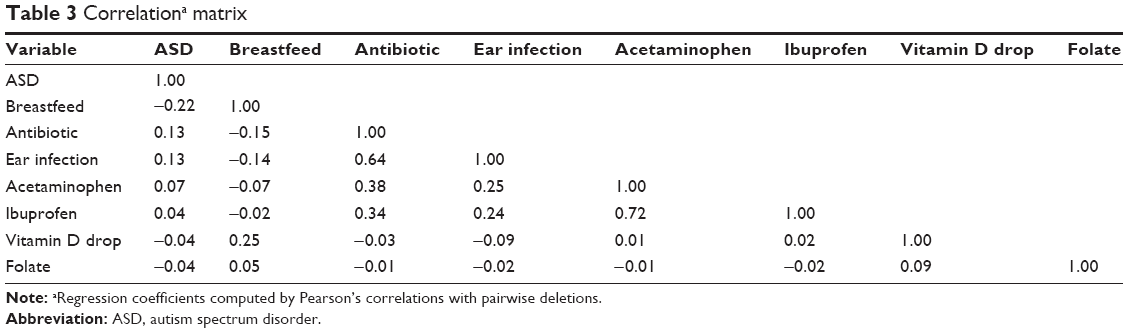 | Table 3 Correlationa matrix |
The consistent set of covariates was found to include all eight of the candidate covariates as all eight were included in the minimal sets of covariates for some of the seven scaled exposure variables based on AIC. The eight covariates are: gender, age of the child, ethnicity, Midwest, South, maternal education, age of the mother at the time of birth of the child, and relationship to the child. The latter two variables were not present in some of the minimal sets.
Four of the seven scaled exposure variables were found to have statistically significant associations with ASD when adjusted for the eight covariates (Table 4). These four are: duration of breastfeeding, doses of postnatal antibiotics, doses of postnatal acetaminophen, and incidence of ear infection. Analogous results, where gender is not a covariate, are shown in Table S7.
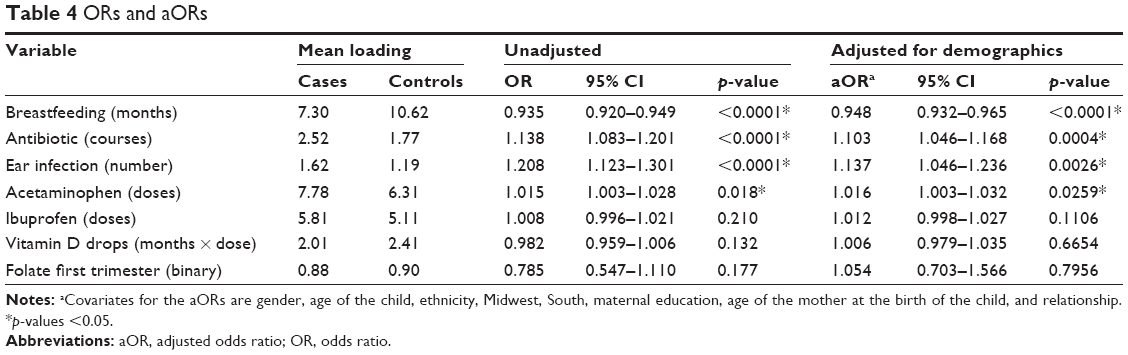 | Table 4 ORs and aORs |
Additional analyses were run to determine whether excluding the covariate for relationship or the covariate for age of the mother would impact the results. Excluding either of these covariates was found to have only minor effects.
Specialized general linear models
The Antibiotic/Ear infection model shows that only the antibiotic variable is statistically significant when included in a joint model with ear infection. The Low-granularity antibiotic/Ear infection model shows that the same is true of the low-granularity antibiotic variable in a joint model with ear infection. Similarly, the Analgesic model shows that the association between acetaminophen and ASD is weak but still present, while any relationship between ibuprofen and ASD is no longer evident in a joint model. Both the Breastfeeding/Vitamin D drop models show that when breastfeeding is included in a model, increased oral vitamin D drop exposure is weakly associated with ASD. Likewise, the Breastfeeding/Total oral vitamin D model shows that when breastfeeding is included, increased total oral vitamin D exposure is weakly associated with ASD. Statistics on these paired variable models as well as the Folate only model with additional genetic conditions are shown in Table 5. Results for analogous models, where gender is not a covariate, are shown in Table S8.
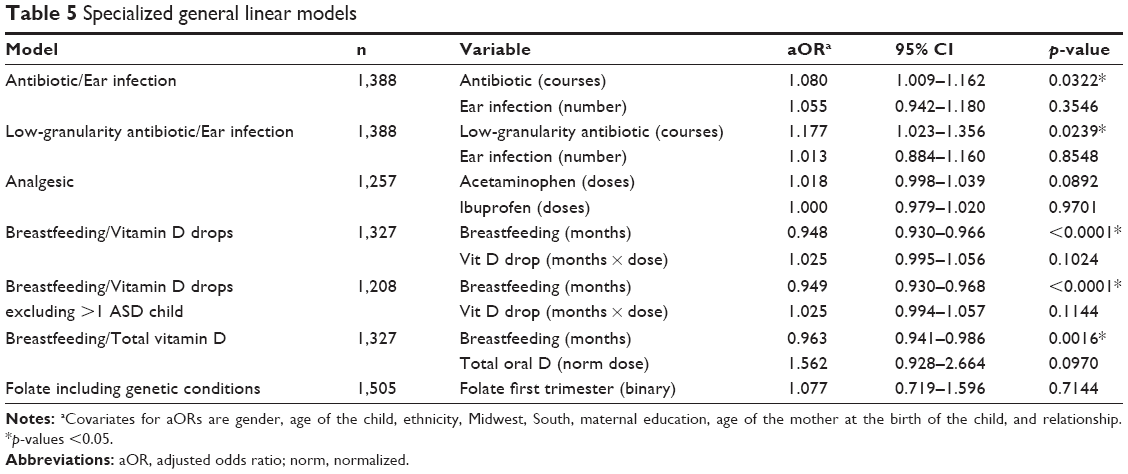 | Table 5 Specialized general linear models |
Multifactor model
Using AIC as the criterion for variable inclusion, the resulting multifactor risk model consists of the variables for breastfeeding, antibiotics, vitamin D drops, gender, and five other covariates. Table 6 provides statistics on this model.
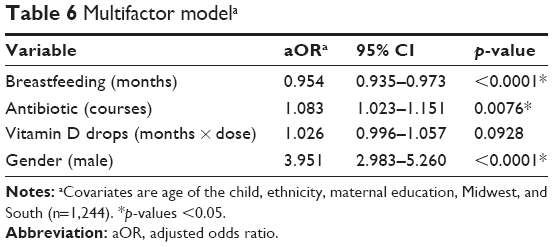 | Table 6 Multifactor modela |
Discussion
Demographics
While there is a high concentration of males among case children, this is expected as male gender is a significant risk factor for ASD.46 In contrast, the male to female ratio among control children is unremarkable.
The age difference between case and control children can be explained by the survey design. Case parents were asked questions about their youngest biological child with ASD, while control parents were asked questions about their youngest biological child between 3 and 12 years of age. Hence, some case parents would have had a younger child between 3 and 12 years. In addition ASD is often diagnosed late.47 Thus, based on these two observations, one would expect that case children would be somewhat older than control children, which is what was found.
While control biological mothers were better educated than case biological mothers in aggregate, both were better educated than the female adult population of the USA between 25 and 54 years of age.48
The emphasis on friend recruitment of controls appears to have been effective. As Table 1 indicates, 73.3% of control respondents were friends of other respondents, while only 16.0% of cases were friends of other respondents. Studies that rely on friend recruitment of controls often result in control groups that are marginally less ethnically diverse and somewhat better educated than cases.49 Thus, it is not surprising that this pattern holds in this data set as well.
Potential bias
One type of bias that may have affected results in this study is self-selection bias. This is sometimes called nonresponse bias, and it comes about from differences between those who choose to participate in a study and those who do not.50 A relevant question is whether this effect resulted in systematic bias in the answers to the exposure questions in this survey. The beliefs of parents of children with ASD regarding causes of ASD are not homogeneous.51–53 About 13% of parents of children with ASD consider vaccines to be the major cause of ASD.51 Since none of the questions in this survey relate to vaccines, this survey is unlikely to have been of exceptional interest to these parents. About 55% of parents of children with ASD believe that genetics is the major cause of ASD.51 It seems likely that this survey would not have been of exceptional interest to most of these parents either. However, some parents whose children have ASD view environmental variables excluding vaccines as potentially significant risk factors.51–53 It seems likely that the survey may have been of exceptional interest to some of these parents. Thus, it seems plausible that such parents participated disproportionately.
It also seems plausible that the views of parents on potential risk factors may have been partly informed by their experiences in the development of their own children. For example, a mother of a child with ASD who did not breastfeed and who later became superficially aware of some of the existing research on potential benefits of breastfeeding might be more inclined to believe that early weaning could be a risk factor for ASD. This is a form of confirmation bias.
If this led to systematic bias on the answers to exposure questions, then it seems probable that this would tend to bias results toward aggregate participant views on whether the variables examined are likely to be causative. As many participants were highly educated, and there is some existing medical literature related to many of the variables examined in the study, it seems plausible that the survey results could be biased toward what the existing medical literature suggests is the general direction or hypothesized direction of association of each of the potential risk factors with ASD. For example, as previously mentioned, some medical literature suggests that breastfeeding may be protective.8,13,14 Hence, the survey results could be biased in this direction. Such an effect could bias results in favor of associations between ASD and early weaning,8,13,14 incidence of ear infection,9,10,19 use of acetaminophen,11,22 and use of antibiotics.9,18 Relatedly, some of the existing literature seems to suggest that prenatal folate and postnatal oral vitamin D could be protective.12,23,24,36–38 However, the results from this study show no association between prenatal folate and the risk of ASD, and the results suggest that postnatal oral vitamin D is weakly associated with increased risk of ASD. Thus, it would seem either this type of confirmation bias did not significantly affect the direction of the associations found in this study or its effects vary significantly per variable.
Encouraging friends of participants to participate in a study is known as snowball sampling.54 Thus, by construction, this study made use of snowball sampling in obtaining some of its case participants and in obtaining the majority of its control participants. Snowball sampling has been used in a number of epidemiological studies on ASD.11,55–57 While snowball sampling has the possibility of inducing biases in a sample,58 some research suggests that in practice, this concern may be overstated.59–61 A key question in this study is whether the reliance on snowball sampling for much of the control group induced systematic bias in the answers to the exposure questions. As many of the control participants were social media friends of cases, it seems likely that some of the control participants had some exposures among the variables under consideration in common with the case participants who referred them. Such a scenario would tend to make control responses more similar to case responses than they would have been with a purely random sample for controls. While this scenario could decrease the strength of some of the associations found, it seems unlikely that it would change the direction of such associations.
As this study is retrospective, the recall of participants is a key consideration. As one might expect, some participants selected the “I’m not sure” answer to some of the questions. This was especially common for the questions related to doses of acetaminophen, ibuprofen, vitamin D drops, and, to a lesser extent, courses of antibiotics. Cases selected this answer much more frequently than controls for each of these questions. For example, for the question on the number of doses of acetaminophen provided up to age two, 17.8% of cases selected “I’m not sure” compared to 9.9% of controls. As previously noted, case children were on average 1.8 years older than controls. Thus, one would expect case participants to be more likely than control participants to select the “I’m not sure” answer. A relevant question is whether this differential in recall affected the ORs and aORs.
The question on number of doses of acetaminophen included answers, “None”, “1–3”, “4–15”, “16–63”, “64+”, and “I’m not sure”. If a participant never provided acetaminophen to her child, or perhaps provided it just once due to a high fever or some other novel event, it seems probable that the participant would be able to recall this fact when taking the survey. If the participant provided acetaminophen frequently to her child for more mundane aches and pains, it seems more likely that the participant would not be able to recall the number of doses. This inference is consistent with research on memory formation, which shows that recall for novel events is superior to recall for common events.62 Thus, it seems likely that children of respondents who selected the “I’m not sure” answer on average received more doses of acetaminophen than children of respondents who did not select this answer. As mentioned, a greater proportion of case participants selected “I’m not sure” than controls. This suggests that exposure of case children to acetaminophen in this survey may have been underestimated relative to controls, which means that the ORs and aORs for acetaminophen may have been underestimated as well. The same is true of the other dose-dependent variables in this study.
Units
Numeric values for ORs, aORs, and CIs are dependent on the units in which the underlying variable is measured.63 For example, the variables for breastfeeding and cumulative vitamin D drop exposure were measured in units of months and months per normalized dose, respectively. If these variables were annualized, the ORs, aORs, and CIs would be greater in magnitude. Relatedly, while the aOR and CI for the total vitamin D drop variable may seem unusually large in nominal terms, this variable was defined in units of a normalized dose of oral vitamin D per day. If this variable were instead represented in units of IUs of oral vitamin D per day, then the aOR and CI would be much smaller in magnitude.
Gender as a covariate
While the main analyses in this study used gender as a covariate, and its selection as a covariate was based on objective criteria, there are reasons why analyses excluding gender may also be relevant. First, as previously highlighted, existing research shows gender is a significant risk factor for ASD,46 and the results from the multifactor risk model (Table 6) confirm this. Hence, if another variable has a gender-specific effect on risk, the inclusion of gender as a covariate may diminish or possibly obscure an association of that variable with ASD due to interaction effects. Second, based on the survey design, none of the biological children of each of the control respondents had ASD. Data on gender of the siblings of each control child were not collected, and it seems plausible that there may be correlation of some of the exposure variables under consideration among siblings in the same family. Thus, the gender-specific nature of some of the control observations may be somewhat overstated, as only one gender was represented per control family, but none of the children in any of the control families had ASD. For these reasons, readers may wish to peruse results in Tables S6 and S7, where gender was not included as a covariate.
Breastfeeding
Breastfeeding durations for controls in this study were somewhat longer than those seen in other national surveys. For example, the Centers for Disease Control found that 30.7% of infants born in 2013 were breastfed for 12 months or more.64 This study found that 37.7% of controls were breastfed for >12 months. The biological mothers of controls in this study were more highly educated, and based on the ethnicities of control children, less ethnically diverse than the national population.48,65 These characteristics are associated with increased duration of breastfeeding.66 Thus, the breastfeeding durations for controls in this study are about what one would expect given the demographics of the control population.
In this data set, longer duration of breastfeeding is associated with decreased risk of ASD when adjusted for any of the other variables. This finding was robust across all models examined. This finding is also consistent with many, but not all, of the existing studies on breastfeeding and ASD.8,13–15
This finding could conceivably reflect correlated variables that are not examined in this study. For example, decreased breastfeeding could reflect an insufficiently developed suckling reflex in the infant or an inability to breastfeed due to poor maternal health. Both could plausibly decrease the number of those who were ever breastfed among cases. However, for those in which breastfeeding was successfully initiated, it seems neither of these factors would lead to appreciably shorter duration. Thus, it appears neither of these factors could explain the significant differences between cases and controls in the longer duration categorical breastfeeding variables from Table 2.
Alternatively, this breastfeeding finding may reflect some protective effect of breast milk. For example, breast milk contains each of the following: bifidobacteria,67 lysozyme,68 lipoxins,69 glutathione,70 and anti-inflammatory cytokines.71 Literature suggests that relative to controls, children with ASD in aggregate have lower levels or bifidobacteria and lysozyme in the digestive tract,72 decreased levels of lipoxin A4 and glutathione in plasma,73–75 and increased levels of inflammatory cytokines in plasma.76 Therefore, a number of possible components of breast milk could plausibly be connected to these results on breastfeeding and ASD.
Ear infection and antibiotics
Table 2 shows that ORs for categorical variables for ear infection incidence increase monotonically with the number of incidents of ear infection. In other words, the raw data suggest ear infection is associated with increased risk of ASD. Table 4 shows that increased incidence of ear infection is associated with ASD (aOR 1.137, CI: 1.046–1.236, p=0.003).
Three smaller studies have previously found such an association between ear infection and ASD.9,10,19 However, a large study based on medical charts recorded prior to diagnosis found that those with ASD had fewer ear infections than controls.20 This study based on charts had an unusually high percentage of controls with at least one ear infection during the first 2 years of life. It also found the following: 1) marginally higher rates of hospitalization for ear infection among those later diagnosed with ASD, 2) higher rates of infection during the first 30 days of life among those diagnosed with ASD, and 3) marginal overrepresentation of those with 13 or more infections among those with ASD. These data suggest that this Rosen et al20 study might have obtained a different result if the focus had been on ear infections that are unusually severe, persistent, or in the very young. Therefore, the authors would not disregard the findings in the present study and the three smaller studies on an association between ear infection and ASD based solely on the Rosen et al study.
Table 2 shows that ORs for categorical variables for antibiotic use increase monotonically with the number of courses. Table 4 shows that increased exposure to postnatal antibiotics is associated with ASD (aOR 1.103, CI: 1.046–1.168, p<0.001). Two smaller studies have previously found such an association, one of which also found an association with ear infection.9,18
Antibiotics and ear infection are correlated variables. The correlation coefficient in Table 3 is 0.64. This is expected, as antibiotics are often used as a treatment for ear infection.77 A natural question is whether one of these variables is causative, while the other is merely associated due to correlation.
Statistics for the Antibiotic/Ear infection model in Table 5 provide one way of examining this question. While the antibiotic variable has a statistically significant association with ASD in this model, the ear infection variable has no meaningful association with ASD. An analogous result holds in the Low-granularity antibiotic/Ear infection model where the antibiotic variable is expressed with a granularity that is comparable to that of the ear infection variable.
Similarly, the objective criteria used in constructing the multifactor model result in inclusion of the antibiotic variable and dropping of the ear infection variable. These results suggest that the antibiotic variable is the more significant of the two. Plausibly, the association of ear infection with ASD could be primarily a result of antibiotic use being correlated with ear infection.
If the association between antibiotics and ASD is fundamental, this may reflect the effect of antibiotics on the microbiome. Specifically, antibiotic use in childhood is associated with increased microbiome depletion and bacterial dysbiosis,78,79 and children with ASD are more prone to microbiome depletion and bacterial dysbiosis.72,80
Acetaminophen and ibuprofen
As Table 2 shows, never being exposed to postnatal acetaminophen is associated with decreased risk of ASD (OR 0.652, CI: 0.432–0.986, p=0.041) and being exposed to 64+ doses of postnatal acetaminophen is associated with increased risk of ASD (OR 3.743, CI: 1.298–10.793, p=0.009). In addition, as Table 4 shows, increased exposure to postnatal acetaminophen, in general, is associated with increased risk of ASD (aOR 1.016, CI: 1.003–1.032, p=0.026). In contrast, the analogous relationships between ibuprofen and ASD are much weaker. The correlation coefficient between acetaminophen and ibuprofen is 0.72, which shows they are correlated. This is not surprising as they are both analgesics. However, the Analgesic model showed that the association between acetaminophen and ASD is weakened but still present when ibuprofen is included as a confounding variable. No such association is evident between ibuprofen and ASD when acetaminophen is included as a confounding variable. In other words, the association between postnatal acetaminophen and ASD is much stronger than the association between ibuprofen and ASD, and the latter weak association could come about solely from ibuprofen use being correlated with acetaminophen use.
As neither analgesic variable is included in the multifactor model, one cannot preclude the possibility that the association between acetaminophen and ASD is due to correlation with other variables. Specifically, from Table 3, acetaminophen use is correlated with antibiotic use. However, the statistically significant and distinct pattern of association exhibited by the categorical acetaminophen variables and the relative strength of the association of the scaled acetaminophen variable with ASD relative to the scaled ibuprofen variable suggest that the association with ASD is not merely due to its correlation with antibiotic use.
The present study replicates findings from a small survey study on postnatal acetaminophen use and ASD.11 Some existing literature has already explored why acetaminophen exposure could be a risk factor for ASD.11,22,81 In this context, the authors wish to highlight that children with ASD in aggregate are likely to metabolize acetaminophen less efficiently than unaffected children. In young children, sulfation is the primary pathway for the metabolism of acetaminophen,82 and the antioxidant glutathione is critical for detoxifying a residual by-product.83,84 Relatedly, research on acetaminophen in animal models suggests that acetaminophen has greater toxicity in those where any of the following are in short supply: sulfate, cysteine, S-adenosyl methionine, or glutathione.85–89 In children with ASD, the levels of free sulfate,74,75 cysteine,74,75,90,91 S-adenosyl methionine,74,75,90,91 and reduced glutathione74,75,90,91 in plasma are on average significantly lower than in controls. Hence, children with ASD as a group would appear to be particularly prone to acetaminophen toxicity.
Vitamin D drops
The “No vitamin D drop” variable (OR 1.475, CI: 1.165–1.866, p=0.001) in Table 2 suggests that providing no vitamin D drops is associated with increased risk of ASD. Yet, there are hints in the “3 months or less vitamin D drop” variable (OR 0.646, CI: 0.474–0.879, p=0.005) and the “Less than standard dose” (OR 0.376, CI: 0.178–0.793, p=0.008) variable that shorter duration of exposure and lower doses are associated with decreased risk of ASD.
The unadjusted OR in Table 4 for the cumulative postnatal vitamin D drop variable (OR 0.982, CI: 0.959–1.006, p=0.132) would seem to suggest that increased exposure to vitamin D drops is weakly associated with decreased risk of ASD. However, control mothers were better educated on average than case mothers, and those with higher education tended to use oral vitamin D drops. In addition, cases in this study were somewhat older than controls, and older children were somewhat less likely to have been exposed to oral vitamin D drops. Thus, once one adjusts for confounding variables, the association between vitamin D drops and ASD no longer points in the direction of decreased risk.
Table 3 shows that the correlation between vitamin D drops and breastfeeding is 0.25. In the USA, vitamin D drops are recommended for children who are breastfed, since infant formula is already fortified with vitamin D.92 Thus, it is expected that these variables would be correlated. Yet, there does not appear to be any associated reduction in ASD risk due to vitamin D drop use. In models that include vitamin D drops, breastfeeding, and demographic variables, the vitamin D drop variable is weakly associated with increased risk of ASD. Specifically, in the multifactor model, where the AIC results in the inclusion of the cumulative vitamin D drop exposure variable, it is weakly associated with ASD (aOR 1.026, CI: 0.996–1.057, p=0.093).
This weak association goes in the opposite direction of that hypothesized by most researchers who have considered vitamin D supplementation in the context of ASD.12,23,24 It seems conceivable that a parent who has multiple children with ASD might have provided vitamin D drops to a younger child with ASD, following the diagnosis of an older child, if the parent was exposed to media suggesting that vitamin D might have a prophylactic effect on the development of ASD. This scenario would tend to bias the results toward case use of vitamin D drops. This scenario is also plausible, since as early as 2008, some literature hypothesized that vitamin D deficiency could be a risk factor for ASD.93 To test whether this media effect could be significant in this data set, the specialized general linear model for breastfeeding and vitamin D drops excluding those with multiple ASD children was constructed as previously described. The association between vitamin D drops and ASD under this model was comparable to the model without this exclusion. Therefore, the weak association between vitamin D drop use and ASD does not appear to be due to a media effect.
One might wonder whether such a relationship would hold if other sources of postnatal oral vitamin D were included in an analysis. This was tested using the Breastfeeding/Total vitamin D model. Based on p-values from Table 5, the association between total oral vitamin D and ASD was marginally stronger than the association between vitamin D drops and ASD.
Thus, vitamin D drops as well as modeled total oral vitamin D consumed were both weakly associated with ASD in this sample when adjusted for breastfeeding. While none of these results are statistically significant using a 0.05 threshold, analogous results for both vitamin D drops and total vitamin D are statistically significant if gender is not included as a covariate (Table S8). These results seem to support Zhou et al’s work suggesting that excessive nutrient intake may be a risk factor for ASD.25 Specifically, these results suggest that excessive postnatal oral vitamin D exposure may be a risk factor for ASD.
Prenatal folate
Unlike other variables in this study, prenatal folate could plausibly affect genetic risk for ASD if taken prior to conception. Therefore, exclusion of those with genetic conditions of high penetrance for ASD from the case set for analysis on prenatal folate seems unjustified. The Folate including genetic conditions model addresses this (Table 5). Yet, statistics on the folate variable in this model are similar to the statistics on the folate variable with genetic conditions excluded (Table 4). None of the folate variables in Tables 2, 4, and 5 have p-values or CIs that would suggest a firm relationship between prenatal folate and risk of ASD.
A number of studies have found that prenatal folate supplementation is associated with a decreased risk of ASD,36–38,94 and other studies have found that prenatal folate attenuates the effect of other risk factors for ASD.95,96 However, other studies, which in aggregate have received much less attention, have found that prenatal folate supplementation may not affect the risk of ASD,97,98 may be associated with an increased risk of ASD,99 may be associated with a decreased risk of ASD when included in a multivitamin but increased risk of ASD when consumed separately,100 or may be associated with an increased risk of ASD at high levels of supplementation and a decreased risk of ASD at moderate levels of supplementation.101
Given the varied and conflicting results in the literature, it is not surprising that the present study found no firm relationship between prenatal folate and the risk of ASD. Three additional considerations are relevant when evaluating this result. First, there was a single question in the survey on prenatal folate, and no data were collected on prenatal folate consumption prior to conception. Each of the studies that found that prenatal folate reduces the risk of ASD included some analysis of supplementation prior to conception.36–38,94 Second, the biological mothers in the present study appear to be somewhat better educated on average than those in at least three of the studies that found that prenatal folate reduces risk.36,37,94 Table 3 in the present study shows that prenatal folate use in this data set is correlated with higher education. Thus, there may be less variability in use of prenatal folate in this sample with higher average education than there were in some of the prior studies. Third, while fortification of some foods with folic acid is mandatory in the USA, it is not mandatory in three of the countries where studies found that prenatal folate reduces risk.36,38,94,102 Hence, a study relying on a data set from the USA like the present one is less likely to find supplementation is beneficial than those based on data sets from countries where food fortification is not mandatory.
While there are already many studies on prenatal folate and ASD in literature, this study adds to evidence that prenatal folate supplementation has no significant effect on the risk of ASD in some populations. However, the results of this study are not inconsistent with the possibility that prenatal folate supplementation may reduce the risk of ASD if consumed prior to conception, in moderate doses only, by those in a less-educated demographic, or by those who do not consume foods fortified with folate.
Strengths and limitations
Some limitations of this study arose from its reliance on data from an Internet survey. While efforts have been made to limit bias in this study and some of the analysis above suggests that any bias in the results was limited, the raw data collected from the survey were essentially unverified beyond what could be gleaned from the participants’ answers. For example, only children whose parents indicated that a diagnosis was made by a professional were included in the case group, but whether such a diagnosis was actually made by a professional for a particular child was not independently verified. Relatedly, there was no uniformity in the type or methodology of diagnosis among case participants.
Separately, as previously noted, there are some material differences between case and control group demographics in this study. For example, the case and control groups differed in aggregate on gender distribution, mean age of child, maternal education, and, to a lesser extent, ethnicity. While most of the key statistical measures used in this study were adjusted to account for differences in these variables and others, it would be desirable if the aggregate demographic characteristics of the case and control groups had greater similarity.
While using an Internet survey to build the underlying data set led to some of the study’s limitations, this approach was also responsible for some of its strengths. For example, a relatively large sample size was obtained. Few ASD survey studies have as many participants as this one has, and this is especially true of postnatal ASD risk factor studies. Relatedly, a large and diverse set of groups were used in recruitment for this study, and participants came from all regions of the USA. Therefore, the results of this study do not have the limitation of potentially only applying to children who were seen at a particular medical center or to children whose parents are members of a particular organization. In addition, using an Internet survey to collect the data for this study minimized the probability of some types of bias associated with personal interactions. For example, data sets assembled via personal interviews have risks of bias associated with inconsistencies in interviewer technique or interviewer subjectivity.
Conclusion
This study adds to the evidence that increased duration of breastfeeding is associated with a decreased risk of ASD (aOR 0.948, CI: 0.932–0.949, p<0.001). It finds that postnatal acetaminophen (aOR 1.016, CI: 1.003–1.032, p=0.026), postnatal antibiotics (aOR 1.103, CI: 1.046–1.168, p<0.001), and incidence of ear infection (aOR 1.137, CI: 1.046–1.236, p=0.003) are associated with an increased risk of ASD. While associations with each of these three latter variables and the risk of ASD appear in the literature, this study serves as replication. This study also finds that cumulative oral vitamin D drop exposure is weakly associated with increased risk of ASD when adjusted for breastfeeding and demographics (aOR 1.025, CI: 0.995–1.056, p=0.102). An analogous result holds for modeled total oral vitamin D as well.
Acknowledgments
We benefited from the facilities, resources, administrative, institutional, and research support provided by the Columbia University’s Interdisciplinary Center for Innovative Theory and Empirics (INCITE). We are especially grateful to Peter Bearman of INCITE for his thoughtful suggestions on the design of the questionnaire and drafts of this paper. We are also grateful to the 1,741 parents who took the time to participate in this study, as well as the administrators, executive directors, and presidents of various groups who graciously permitted the survey to be highlighted through their media. We are also grateful to the Interactive Autism Network (IAN) for its generous assistance with subject recruitment, and we wish to express our gratitude to the following people: Michael Falco of INCITE, Dr Kiely Law of IAN, and Dr Alison Marvin of IAN.
Disclosure
The authors report no conflicts of interest in this work.
References
American Psychiatric Association. Diagnostic and Statistical Manual of Mental Disorders. 5th ed. Arlington, Virginia: American Psychiatric Association; 2013. | ||
Wender CLA, Veenstra-VanderWeele J. Challenge and potential for research on gene-environment interactions in autism spectrum disorder. In: Tolan PH, Leventhal BL, editors. Gene-Environment Transactions in Developmental Psychopathology. 2017;2:157–176. Available from: https://books.google.com/books?isbn=3319492276. Accessed March 22, 2018. | ||
Lyall K, Schmidt RJ, Hertz-Picciotto I. Maternal lifestyle and environmental risk factors for autism spectrum disorders. Int J Epidemiol. 2014;43(2):443–464. | ||
Wang C, Geng H, Liu W, Zhang G. Prenatal, perinatal, and postnatal factors associated with autism: a meta-analysis. Medicine (Baltimore). 2017;96(18):e6696. | ||
Mandy W, Lai MC. Annual Research Review: the role of the environment in the developmental psychopathology of autism spectrum condition. J Child Psychol Psychiatry. 2016;57(3):271–292. | ||
Williams K, Brignell A, Prior M, Bartak L, Roberts J. Regression in autism spectrum disorders. J Paediatr Child Health. 2015;51(1):61–64. | ||
Jones W, Klin A. Attention to eyes is present but in decline in 2–6-month-old infants later diagnosed with autism. Nature. 2013;504(7480):427–431. | ||
Boucher O, Julvez J, Guxens M, et al. Association between breastfeeding duration and cognitive development, autistic traits and ADHD symptoms: a multicenter study in Spain. Pediatr Res. 2017;81(3):434–442. | ||
Niehus R, Lord C. Early medical history of children with autism spectrum disorders. J Dev Behav Pediatr. 2006;27(2 Suppl):S120–S127. | ||
Jeans LM, Santos RM, Laxman DJ, McBride BA, Dyer WJ. Early predictors of ASD in young children using a nationally representative data set. J. Early Interv. 2013;35(4):303–331. | ||
Schultz ST, Klonoff-Cohen HS, Wingard DL, Akshoomoff NA, Macera CA, Ji M. Acetaminophen (paracetamol) use, measles-mumps-rubella vaccination, and autistic disorder: the results of a parent survey. Autism. 2008;12(3):293–307. | ||
Cannell JJ. Autism, will vitamin D treat core symptoms? Med Hypotheses. 2013;81(2):195–198. | ||
Al-Farsi YM, Al-Sharbati MM, Waly MI, et al. Effect of suboptimal breast-feeding on occurrence of autism: a case-control study. Nutrition. 2012;28(7–8):e27–e32. | ||
Schultz ST, Klonoff-Cohen HS, Wingard DL, Akshoomoff NA, Macera CA, Ji M, Bacher C. Breastfeeding, infant formula supplementation, and Autistic Disorder: the results of a parent survey. Int Breastfeeding J. 2006;1:16. | ||
Husk JS, Keim SA. Breastfeeding and autism spectrum disorder in the national survey of children’s health. Epidemiology. 2015;26(4):451–457. | ||
Atladóttir HÓ, Henriksen TB, Schendel DE, Parner ET. Autism after infection, febrile episodes, and antibiotic use during pregnancy: an exploratory study. Pediatrics. 2012;130(6):e1447–e1454. | ||
Sandler RH, Finegold SM, Bolte ER, et al. Short-term benefit from oral vancomycin treatment of regressive-onset autism. J Child Neurol. 2000;15(7):429–435. | ||
Adams JB, Romdalvik J, Ramanujam VM, Legator MS. Mercury, lead, and zinc in baby teeth of children with autism versus controls. J Toxicol Environ Health A. 2007;70(12):1046–1051. | ||
Konstantareas MM, Homatidis S. Ear infections in autistic and normal children. J Autism Dev Disord. 1987;17(4):585–594. | ||
Rosen NJ, Yoshida CK, Croen LA. Infection in the first 2 years of life and autism spectrum disorders. Pediatrics. 2007;119(1):e61–e69. | ||
Liew Z, Ritz B, Virk J, Olsen J. Maternal use of acetaminophen during pregnancy and risk of autism spectrum disorders in childhood: a Danish national birth cohort study. Autism Res. 2016;9(9):951–958. | ||
Parker W, Hornik CD, Bilbo S, et al. The role of oxidative stress, inflammation and acetaminophen exposure from birth to early childhood in the induction of autism. J Int Med Res. 2017;45(2):407–438. | ||
Patrick RP, Ames BN. Vitamin D hormone regulates serotonin synthesis. Part 1: relevance for autism. FASEB J. 2014;28(6):2398–2413. | ||
Mostafa GA, Al-Ayadhi LY. Reduced serum concentrations of 25-hydroxy vitamin D in children with autism: relation to autoimmunity. J Neuroinflammation. 2012;17(9):201. | ||
Zhou SS, Zhou YM, Li D, Ma Q. Early infant exposure to excess multivitamin: a risk factor for autism? Autism Res Treat. 2013:963697. | ||
Bittker S. Oral vitamin D, infants, toddlers, and autism in the United States: 1980 to 2010. J Autism (Herbert). 2015;2:1. | ||
Lee H, Marvin AR, Watson T, et al. Accuracy of phenotyping of autistic children based on Internet implemented parent report. Am J of Med Genet. 2010;153B(6):1119–1126. | ||
Marvin AR, Law PA, Law JK, et al. Non-verbal children with ASD (NV-ASD): validating a registry and characterizing a population. Presentation at the International Meeting for Autism Research. Atlanta, GA: 2014. Available from: https://insar.confex.com/insar/2014/webprogram/Paper16978.html. Accessed March 22, 2018. | ||
Daniels AM, Rosenberg RE, Anderson C, Law JK, Marvin AR, Law PA. Verification of parent-report of child autism spectrum disorder diagnosis to a web-based autism registry. J Autism Dev Disord. 2012;42(2):257–265. | ||
Hazen EP, McDougle CJ, Volkmar FR. Changes in the diagnostic criteria for autism in DSM-5: controversies and concerns. J Clin Psychiatry. 2013;74(7):739–740. | ||
Sinzig J, Morsch D, Bruning N, Schmidt MH, Lehmkuhl G. Inhibition, flexibility, working memory and planning in autism spectrum disorders with and without comorbid ADHD-symptoms. Child Adolesc Psychiatry Ment Health. 2008;2(1):4. | ||
Lane AE, Young RL, Baker AE, Angley MT. Sensory processing subtypes in autism: association with adaptive behavior. J Autism Dev Disord. 2010;40(1):112–122. | ||
Tierney C, Mayes S, Lohs SR, Black A, Gisin E, Veglia M. How valid is the checklist for autism spectrum disorder when a child has apraxia of speech? J Dev Behav Pediatr. 2015;36(8):569–574. | ||
Rommelse NN, Franke B, Geurts HM, Hartman CA, Buitelaar JK. Shared heritability of attention-deficit/hyperactivity disorder and autism spectrum disorder. Euro Child Adolesc Psychiatry. 2010;19(3):281–295. | ||
Baranek GT, Roberts JE, David FJ, et al. Developmental trajectories and correlates of sensory processing in young boys with fragile X syndrome. Phys Occup Ther Pediatr. 2008;28(1):79–98. | ||
Surén P, Roth C, Bresnahan M, et al. Association between maternal use of folic acid supplements and risk of autism spectrum disorders in children. JAMA. 2013;309(6):570–577. | ||
Schmidt RJ, Hansen RL, Hartiala J, et al. Prenatal vitamins, one-carbon metabolism gene variants, and risk for autism. Epidemiology. 2011;22(4):476–485. | ||
Steenweg-de Graaff J, Ghassabian A, Jaddoe VW, Tiemeier H, Roza SJ. Folate concentrations during pregnancy and autistic traits in the offspring. The Generation R Study. Eur J Public Health. 2015;25(3):431–433. | ||
Ross AC, Taylor CL, Yaktine AL, Del Valle HB. Dietary Reference Intakes for Calcium and Vitamin D. Washington, DC: National Academies Press; 2011. | ||
Reeve LE, Chesney RW, DeLuca HF. Vitamin D of human milk: identification of biologically active forms. Am J Clin Nutr. 1982;36(1):122–126. | ||
Pehrsson PR, Lemar LE, Patterson K, Yand Exler J. Vitamin D and Selected Fatty Acids in U.S. Infant Formulas. USDA; 2008. Available from: https://www.ars.usda.gov/ARSUserFiles/80400525/Articles/NDBC33_InfForm.pdf. Accessed March 1, 2018. | ||
Patterson KY, Phillips KM, Horst RL, et al. Vitamin D content and variability in fluid milks from a US Department of Agriculture nationwide sampling to update values in the National Nutrient Database for Standard Reference. J Dairy Sci. 2010;93:5082–5090. | ||
Picciano MF, Calkins EJ, Garrick JR, Deering RH. Milk and mineral intakes of breastfed infants. Acta Paediatr Scand. 1981;70:189–194. | ||
Bonuck K, Avraham SB, Hearst M, Kahn R, Hyden C. Is overweight at 12 months associated with differences in eating behaviour or dietary intake among children selected for inappropriate bottle use? Matern Child Nutr. 2014;10:234–244. | ||
Bozdogan H. Model selection and Akaike’s Information Criterion (AIC): the general theory and its analytical extensions. Psychometrika. 1987;52(3):345–370. | ||
Fombonne E. Epidemiology of autistic disorder and other pervasive developmental disorders. J Clin Psychiatry. 2005;66(Suppl 10):3–8. | ||
Daniels AM, Mandell DS. Explaining differences in age at autism spectrum disorder diagnosis: a critical review. Autism. 2014;18(5):583–597. | ||
US Census Bureau. Educational Attainment of the Population 18 Years and Over, by Age, Sex, Race, and Hispanic Origin for 2016. Available from: https://www.census.gov/data/tables/2016/demo/education-attainment/cps-detailed-tables.html. Accessed March 1, 2018. | ||
Bunin GR, Vardhanabhuti S, Lin A, Anschuetz GL, Mitra N. Practical and analytical aspects of using friend controls in case-control studies: experience from a case-control study of childhood cancer. Paediatr Perinat Epidemiol. 2011;25(5):402–412. | ||
Chubak J, Boudreau DM, Wirtz HS, McKnight B, Weiss NS. Threats to validity of nonrandomized studies of postdiagnosis exposures on cancer recurrence and survival. J Natl Cancer Inst. 2013;105(19):1456–1462. | ||
Fischbach RL, Harris MJ, Ballan MS, Fischbach GD, Link BG. Is there concordance in attitudes and beliefs between parents and scientists about autism spectrum disorder? Autism. 2015;20(3):353–363. | ||
Russell G, Kelly S, Golding J. A qualitative analysis of lay beliefs about the aetiology and prevalence of autistic spectrum disorders. Child Care Health Dev. 2009;36(3):431–436. | ||
Mercer L, Creighton S, Holden JJ, Lewis ME. Parental perspectives on the causes of an autism spectrum disorder in their children. J Genet Couns. 2006;15(1):41–50. | ||
Morgan DL. The SAGE Encyclopedia of Qualitative Research Methods. Thousand Oaks, CA, USA, SAGE Publications, Inc.; 2008:816–817. | ||
Cath DC, Ran N, Smit JH, van Balkom AJ, Comijs HC. Symptom overlap between autism spectrum disorder, generalized social anxiety disorder and obsessive-compulsive disorder in adults: a preliminary case-controlled study. Psychopathology. 2008;41(2):101–110. | ||
Heffernan KS, Columna L, Russo N, et al. Brief report: physical activity, body mass index and arterial stiffness in children with autism spectrum disorder: preliminary findings. J Autism Dev Disord. 2018;48(2):625–631. | ||
Martins Y, Young RL, Robson DC. Feeding and eating behaviors in children with autism and typically developing children. J Autism Dev Disord. 2008;38(10):1878–1887. | ||
Atkinson R, Flint J. Encyclopedia of Social Science Research Methods. Thousand Oaks, CA, USA, SAGE Publications, Inc. 2004:1044–1045. | ||
Etter JF, Perneger TV. Snowball sampling by mail: application to a survey of smokers in the general population. Int J Epidemiol. 2000;29(1):43–48. | ||
Gyarmathy VA, Johnston LG, Caplinskiene I, Caplinskas S, Latkin CA. A simulative comparison of respondent driven sampling with incentivized snowball sampling–the “strudel effect.” Drug Alcohol Depend. 2014;135:71–77. | ||
Lopes CS, Rodrigues LC, Sichieri R. The lack of selection bias in a snowball sampled case-control study on drug abuse. Int J Epidemiol. 1996;25(6):1267–1270. | ||
Ranganath C, Rainer G. Neural mechanisms for detecting and remembering novel events. Nat Rev Neurosci. 2003;4(3):193–202. | ||
Pepe MS, Janes H, Longton G, Leisenring W, Newcomb P. Limitations of the odds ratio in gauging the performance of a diagnostic, prognostic, or screening marker. Am J Epidemiol. 2004;159(9):882–890. | ||
Center for Disease Control. Breastfeeding Report Card Progressing Toward National Breastfeeding Goals United States; 2016. Available from: https://www.cdc.gov/breastfeeding/pdf/2016breastfeedingreportcard.pdf. Accessed March 1, 2018. | ||
US Census Bureau. Quick Facts United States. Available from: https://www.census.gov/quickfacts/. Accessed March 1, 2018. | ||
Thulier D, Mercer J. Variables associated with breastfeeding duration. J Obstet Gynecol Neonatal Nurs. 2009;38(3):259–268. | ||
Grönlund MM, Gueimonde M, Laitinen K, et al. Maternal breast-milk and intestinal bifidobacteria guide the compositional development of the Bifidobacterium microbiota in infants at risk of allergic disease. Clin Exp Allergy. 2007;37(12):1764–1772. | ||
Lönnerdal B. Bioactive proteins in human milk: health, nutrition, and implications for infant formulas. J Pediatr. 2016;173(Suppl):S4–S9. | ||
Weiss GA, Troxler H, Klinke G, Rogler D, Braegger C, Hersberger M. High levels of anti-inflammatory and pro-resolving lipid mediators lipoxins and resolvins and declining docosahexaenoic acid levels in human milk during the first month of lactation. Lipids Health Dis. 2013;12:89. | ||
Ankrah NA, Appiah-Opong R, Dzokoto C. Human breastmilk storage and the glutathione content. J Trop Pediatr. 2000;46(2):111–113. | ||
Field CJ. The immunological components of human milk and their effect on immune development in infants. J Nutr. 2005;135(1):1–4. | ||
Adams JB, Johansen LJ, Powell LD, Quig D, Rubin RA. Gastrointestinal flora and gastrointestinal status in children with autism–comparisons to typical children and correlation with autism severity. BMC Gastroenterol. 2011;11:22. | ||
Yan CL, Zhang J, Hou Y. Decreased plasma levels of lipoxin A4 in children with autism spectrum disorders. Neuroreport. 2015;26(6):341–345. | ||
Adams JB, Audhya T, McDonough-Means S, et al. Nutritional and metabolic status of children with autism vs. neurotypical children, and the association with autism severity. Nutr Metab. 2011;8(1):34. | ||
Geier DA, Kern JK, Garver CR, Adams JB, Audhya T, Geier MR. A prospective study of transsulfuration biomarkers in autistic disorders. Neurochem Res. 2008;34(2):386–393. | ||
Ashwood P, Krakowiak P, Hertz-Picciotto I, Hansen R, Pessah I, Van de Water J. Elevated plasma cytokines in autism spectrum disorders provide evidence of immune dysfunction and are associated with impaired behavioral outcome. Brain Behav Immun. 2011;25(1):40–45. | ||
Del Mar C, Glasziou P, Hayem M. Are antibiotics indicated as initial treatment for children with acute otitis media? A meta-analysis. BMJ. 1997;314(7093):1526–1529. | ||
Yassour M, Vatanen T, Siljander H, et al. Natural history of the infant gut microbiome and impact of antibiotic treatment on bacterial strain diversity and stability. Sci Transl Med. 2016;8(343):343ra81. | ||
Korpela K, Salonen A, Virta LJ, et al. Intestinal microbiome is related to lifetime antibiotic use in Finnish pre-school children. Nat Commun. 2016;7:10410. | ||
Wang L, Christophersen CT, Sorich MJ, Gerber JP, Angley MT, Conlon MA. Low relative abundances of the mucolytic bacterium Akkermansia muciniphila and Bifidobacterium spp. in feces of children with autism. J Appl Environ Microbiol. 2011;77(18):6718–6721. | ||
Ghanizadeh A. Acetaminophen may mediate oxidative stress and neurotoxicity in autism. Med Hypotheses. 2012;78(2):351. | ||
Jiang XL, Zhao P, Barrett JS, Lesko LJ, Schmidt S. Application of physiologically based pharmacokinetic modeling to predict acetaminophen metabolism and pharmacokinetics in children. CPT Pharmacometrics Syst Pharmacol. 2013;2:e80. | ||
Mazaleuskaya LL, Sangkuhl K, Thorn CF, FitzGerald GA, Altman RB, Klein TE. PharmGKB summary: pathways of acetaminophen metabolism at the therapeutic versus toxic doses. Pharmacogenet Genomics. 2015;25(8):416–426. | ||
Linden CH, Rumack BH. Acetaminophen overdose. Emerg Med Clin North Am. 1984;2(1):103–119. | ||
Gregus Z, Kim HJ, Madhu C, Liu Y, Rozman P, Klaassen CD. Sulfation of acetaminophen and acetaminophen-induced alterations in sulfate and 3′-phosphoadenosine 5′-phosphosulfate homeostasis in rats with deficient dietary intake of sulfur. Drug Metab Dispos. 1994;22(5):725–730. | ||
Price VF, Jollow DJ. Effects of sulfur-amino acid-deficient diets on acetaminophen metabolism and hepatotoxicity in rats. Toxicol Appl Pharmacol. 1989;101(2):356–369. | ||
Lauterburg BH, Corcoran GB, Mitchell JR. Mechanism of action of N-acetylcysteine in the protection against the hepatotoxicity of acetaminophen in rats in vivo. J Clin Invest. 1983;71(4):980–991. | ||
Terneus MV, Kiningham KK, Carpenter AB, Sullivan SB, Valentovic MA. Comparison of S-Adenosyl-L-methionine and N-acetylcysteine protective effects on acetaminophen hepatic toxicity. J Pharmacol Exp Ther. 2007;320(1):99–107. | ||
Zhao P, Kalhorn TF, Slattery JT. Selective mitochondrial glutathione depletion by ethanol enhances acetaminophen toxicity in rat liver. Hepatology (Baltimore, Md.). 2002;36(2):326–335. | ||
James SJ, Cutler P, Melnyk S, et al. Metabolic biomarkers of increased oxidative stress and impaired methylation capacity in children with autism. Am J Clin Nutr. 2004;80(6):1611–1617. | ||
Melnyk S, Fuchs GJ, Schulz E, et al. Metabolic imbalance associated with methylation dysregulation and oxidative damage in children with autism. J Autism Dev Disord. 2012;42(3):367–377. | ||
Wagner CL, Greer FR; American Academy of Pediatrics Section on Breastfeeding; American Academy of Pediatrics Committee on Nutrition. Prevention of rickets and vitamin D deficiency in infants, children, and adolescents. Pediatrics. 2008;122(5):1142–1152. | ||
Cannell JJ. Autism and vitamin D. Med Hypotheses. 2008;70(4):750–759. | ||
Levine SZ, Kodesh A, Viktorin A, et al. Association of maternal use of folic acid and multivitamin supplements in the periods before and during pregnancy with the risk of autism spectrum disorder in offspring. JAMA Psychiatry. 2018;75(2):176–184. | ||
Goodrich AJ, Volk HE, Tancredi DJ, et al. Joint effects of prenatal air pollutant exposure and maternal folic acid supplementation on risk of autism spectrum disorder. Autism Res. 2018;11(1):69–80. | ||
Bjørk M, Riedel B, Spigset O, et al. Association of folic acid supplementation during pregnancy with the risk of autistic traits in children exposed to antiepileptic drugs in utero. JAMA Neurol. 2018;75(2):160–168. | ||
Virk J, Liew Z, Olsen J, Nohr EA, Catov JM, Ritz B. Preconceptional and prenatal supplementary folic acid and multivitamin intake and autism spectrum disorders. Autism. 2016;20(6):710–718. | ||
Strøm M, Granström C, Lyall K, Ascherio A, Olsen SF. Research Letter: folic acid supplementation and intake of folate in pregnancy in relation to offspring risk of autism spectrum disorder. Psychol Med. 2018;48(6):1048–1054. | ||
DeSoto MC, Hitlan R. Synthetic folic acid supplementation during pregnancy may increase the risk of developing autism. J Pediatr Biochem. 2012;2:251–261. | ||
DeVilbiss EA, Magnusson C, Gardner RM, et al. Antenatal nutritional supplementation and autism spectrum disorders in the Stockholm youth cohort: population based cohort study. BMJ. 2017;359:j4273. | ||
Raghavan R, Riley AW, Volk H, et al. Maternal multivitamin intake, plasma folate and vitamin B12 levels and autism spectrum disorder risk in offspring. Paediatr Perina Epidemiol. 2018;32(1):100–111. | ||
EUROCAT World map of countries having mandatory fortification of food with folic acid. Available from: http://www.eurocat-network.eu/content/EUROCAT-Folic-Acid-Map.pdf. Accessed March 22, 2018. |
 © 2018 The Author(s). This work is published and licensed by Dove Medical Press Limited. The
full terms of this license are available at https://www.dovepress.com/terms
and incorporate the Creative Commons Attribution
- Non Commercial (unported, 3.0) License.
By accessing the work you hereby accept the Terms. Non-commercial uses of the work are permitted
without any further permission from Dove Medical Press Limited, provided the work is properly
attributed. For permission for commercial use of this work, please see paragraphs 4.2 and 5 of our Terms.
© 2018 The Author(s). This work is published and licensed by Dove Medical Press Limited. The
full terms of this license are available at https://www.dovepress.com/terms
and incorporate the Creative Commons Attribution
- Non Commercial (unported, 3.0) License.
By accessing the work you hereby accept the Terms. Non-commercial uses of the work are permitted
without any further permission from Dove Medical Press Limited, provided the work is properly
attributed. For permission for commercial use of this work, please see paragraphs 4.2 and 5 of our Terms.