Back to Journals » International Journal of Chronic Obstructive Pulmonary Disease » Volume 11 » Issue 1
Accuracy of forced oscillation technique to assess lung function in geriatric COPD population
Authors Tse HN, Tseng CZS, Wong KY, Yee KS, Ng LY
Received 10 December 2015
Accepted for publication 19 February 2016
Published 26 May 2016 Volume 2016:11(1) Pages 1105—1118
DOI https://doi.org/10.2147/COPD.S102222
Checked for plagiarism Yes
Review by Single anonymous peer review
Peer reviewer comments 2
Editor who approved publication: Prof. Dr. Richard Russell
Hoi Nam Tse,1 Cee Zhung Steven Tseng,1 King Ying Wong,2 Kwok Sang Yee,2 Lai Yun Ng1
1Medical and Geriatric Department, Respiratory Unit, Kwong Wah Hospital, 2Department of Tuberculosis and Chest Unit, Wong Tai Sin Hospital, Hong Kong, People’s Republic of China
Introduction: Performing lung function test in geriatric patients has never been an easy task. With well-established evidence indicating impaired small airway function and air trapping in patients with geriatric COPD, utilizing forced oscillation technique (FOT) as a supplementary tool may aid in the assessment of lung function in this population.
Aims: To study the use of FOT in the assessment of airflow limitation and air trapping in geriatric COPD patients.
Study design: A cross-sectional study in a public hospital in Hong Kong. ClinicalTrials.gov ID: NCT01553812.
Methods: Geriatric patients who had spirometry-diagnosed COPD were recruited, with both FOT and plethysmography performed. “Resistance” and “reactance” FOT parameters were compared to plethysmography for the assessment of air trapping and airflow limitation.
Results: In total, 158 COPD subjects with a mean age of 71.9±0.7 years and percentage of forced expiratory volume in 1 second of 53.4±1.7 L were recruited. FOT values had a good correlation (r=0.4–0.7) to spirometric data. In general, X values (reactance) were better than R values (resistance), showing a higher correlation with spirometric data in airflow limitation (r=0.07–0.49 vs 0.61–0.67), small airway (r=0.05–0.48 vs 0.56–0.65), and lung volume (r=0.12–0.29 vs 0.43–0.49). In addition, resonance frequency (Fres) and frequency dependence (FDep) could well identify the severe type (percentage of forced expiratory volume in 1 second <50%) of COPD with high sensitivity (0.76, 0.71) and specificity (0.72, 0.64) (area under the curve: 0.8 and 0.77, respectively). Moreover, X values could stratify different severities of air trapping, while R values could not.
Conclusion: FOT may act as a simple and accurate tool in the assessment of severity of airflow limitation, small and central airway function, and air trapping in patients with geriatric COPD who have difficulties performing conventional lung function test. Moreover, reactance parameters were better than resistance parameters in correlation with air trapping.
Keywords: airflow limitation, air trapping, chronic obstructive pulmonary disease
Introduction
COPD is a common and morbid disease worldwide, affecting a significant proportion of geriatric patients.1 Though spirometry is a mandatory tool for diagnosis and assessing severity in patients with COPD, it is underused in geriatric patients.2,3 The higher prevalence of cognitive and functional impairment in elderly patients has rendered many of them incapable of performing a satisfactory forced expiratory maneuverer in spirometry.4–6 In fact, ~18% of advanced-age patients with COPD failed to perform adequate spirometry,5 and the quality of spirometric performance is also jeopardized in elderly patients with COPD.4
Forced oscillation technique (FOT) may be an alternative tool to assess lung function in geriatric patients. FOT is less time-consuming and technically easier to perform, as it is measured when patients effortlessly breathe-in their tidal volume, requiring minimal patient cooperation. In fact, current evidences suggest that FOT parameters correlated well with forced expiratory volume in 1 second (FEV1) and could reflect airway resistance accurately.7–10 It was also suggested to be a more sensitive marker for detection of airway hypersensitivity11–14 as well as early airway disease.15,16
Despite these benefits, FOT was not widely applied in the diagnosis and monitoring of patients with geriatric COPD. Besides, the use of FOT in the assessment of air trapping in “geriatric COPD patients” was not well investigated in earlier studies, although close relationship exists between air trapping and patients’ symptomatology.17 Furthermore, previous studies did not explicitly demonstrate the use of FOT in identifying the “severe type” (%FEV1 <50%) of elderly patients with COPD, which is important since the current Global Initiative for Chronic Obstructive Lung Disease (GOLD) guideline recommends combined assessment approach to manage patients with COPD with %FEV1 <50% being regarded as a “high-risk” group.
Therefore, our study aims to investigate the use of various FOT parameters (both reactance and resistance) in assessment of airflow limitation, small airway disease, and air trapping in patients with geriatric COPD. We also aim to investigate the accuracy of FOT in identifying the “severe type” of elderly patients with COPD (%FEV1 <50%), who are regarded as belonging to a high-risk group according to the GOLD guideline.
Aims
The study aims to investigate the use of FOT in the assessment of different degrees of air trapping as well as airflow limitation in patients with geriatric COPD.
Methods
Study design and population
This is a cross-sectional study conducted in a public hospital in Hong Kong (Kwong Wah Hospital, Hong Kong, People’s Republic of China). The study population included stable COPD subjects who attended the specialized COPD clinic or the COPD ambulatory rehabilitation clinic from January 1, 2011 to December 31, 2014, in Kwong Wah Hospital.
Geriatric COPD subjects aged between 60 and 85 years with a clinical history compatible with COPD and the spirometry showing obstructive pattern (FEV1/forced vital capacity [FVC] <0.7) were recruited. Subjects were excluded from the study if they had coexisting pulmonary diseases such as asthma, interstitial lung diseases, and lung malignancy or if they were uncooperative or too dyspneic for lung function test.
Patients’ demographic data including age, sex, smoking status, comorbidities, and dyspnea level (Modified Medical Research Council Dyspnea Scale) were recorded. Both FOT and plethysmography were performed, and the results from both methods were compared for assessment of airflow limitation and air trapping.
Lung function tests
Both lung function tests (FOT and plethysmography) were performed by trained respiratory specialist nurses in the same visit. Since FOT would not affect the bronchial tone, it was performed before plethysmography for every patient. The details of the lung function tests are as follows.
FOT
FOT was performed using the instrument i2M (Chess Medical, Ghent, Belgium) with the aid of nose clip and mouthpiece that stabilized patients’ tongue position. It measured the respiratory mechanics (“resistance” and “reactance”) by producing a multifrequency (4–48 Hz) pseudorandom noise impulse. The test was done with the patient in sitting position and the cheek supported by both hands to reduce airway shunting. The machine was calibrated before using for each COPD subject, according to the instructions of the machine manufacturer. The test was done based on the European Respiratory Society Task Force recommendations on forced oscillation testing.18 Moreover, only measured values with a minimal coherence function of 95% were considered valid. Three valid measurements were taken, and the final result of the test was calculated as the mean of these three measurements.
The resistance and reactance components of the respiratory system over various frequencies (4–48 Hz) were obtained at every 2 Hz and were expressed as two distinct curves. The FOT parameters that were included for analysis included resistance (R) and reactance (X) at various oscillation frequencies (4–48 Hz), frequency resonance (Fres – the frequency at which reactance equals to zero), frequency dependence (FDep – the slope of resistance plotted against frequency), average reactance (XAvr), and average resistance (RAvr). The predicted values of FOT parameters were calculated and provided by the manufacturer according to the European Respiratory Society recommendation.18
Plethysmograph
This was performed by the machine MedGraphics Elite series™ Plethysmograph (Medical Graphics Corporation, St Paul, MN, USA) with acceptable repeatability and in concordance with the American Thoracic Society standard for lung function test.19 Spirometry data (FEV1, FVC, FEV1/FVC ratio, %FEV1, forced expiratory flow between 25% and 75% of forced vital capacity [FEF25–75%]), lung volume (inspiratory capacity [IC], vital capacity, total lung capacity [TLC], residual volume [RV], RV/TLC ratio), as well as airway resistance (Raw) and conductance (Gaw) were measured. The Chinese reference values for spirometric parameters were used for analysis.20
Statistical analysis
For continuous parametric data, values were expressed as mean ± standard error of mean unless stated otherwise. Comparison between two continuous variables was done by correlation test and expressed as Spearman correlation coefficient (r). Analysis of variance test was used to compare continuous variables among three or more groups with post hoc analysis estimated by Bonferroni test. Receiver operating characteristic curve was plotted with Jouden Index being used to determine the cutoff points of various FOT parameters in predicting severe type of COPD (%FEV1 <50%). All tests were two sided and regarded as significant if P-value was <0.05. Predictive Analytics Software 18.0 (IBM Corp., Armonk, NY, USA) was used for statistical analysis.
Ethics
Written informed consent was obtained from every eligible subject. The study was approved by the Hong Kong Hospital Authority Kowloon West Cluster Research Ethic Committee (reference: KW/EX-12-030 [48-15]).
Results
Among the 177 eligible COPD subjects, 19 patients were excluded (five patients refused to participate, 14 patients defaulted the lung function tests). Finally, 158 COPD subjects, with a mean age of 71.9±8.3 years and %FEV1 of 53.4±21.4, completed the study. Demographic and lung function data of the subjects are shown in Tables 1 and 2, respectively.
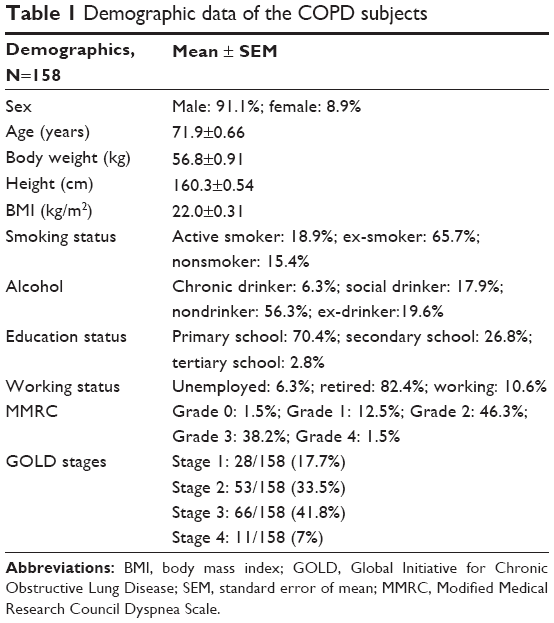 | Table 1 Demographic data of the COPD subjects |
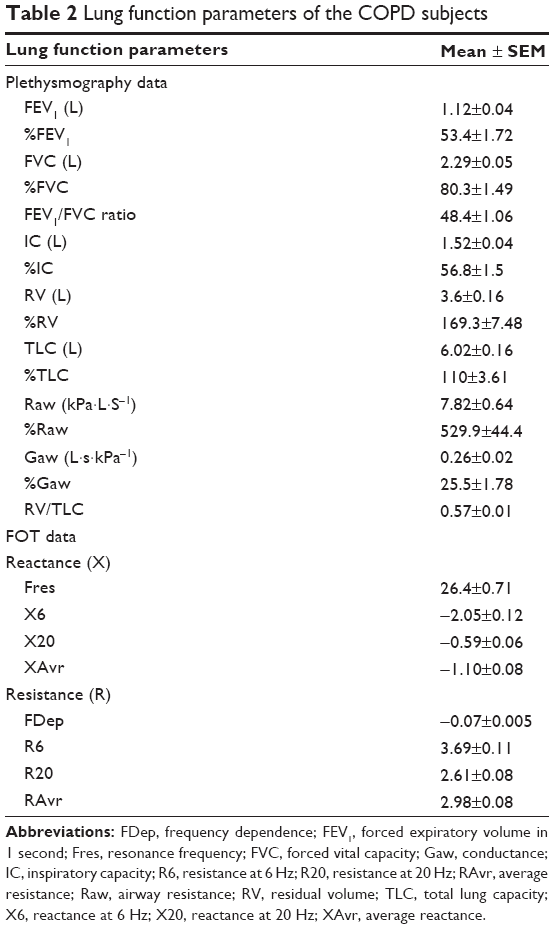 | Table 2 Lung function parameters of the COPD subjects |
Assessment of airflow limitation/COPD severity
Reactance (X) was superior to resistance (R) parameters in the assessment of airflow limitation, with a higher correlation to FEV1 (Figure 1), FEF25–75% (Figure 2) and RV/TLC ratio (Figure 3). Regarding the COPD severity, all X parameters (Fres, XAvr, X6Hz, and X20Hz) had a good correlation with GOLD stages, while the correlation to GOLD stages was much diverse among R parameters (Figure 4). Among the R parameters, FDep correlated well with GOLD stages, while R20 and RAvr correlated poorly (Figure 4).
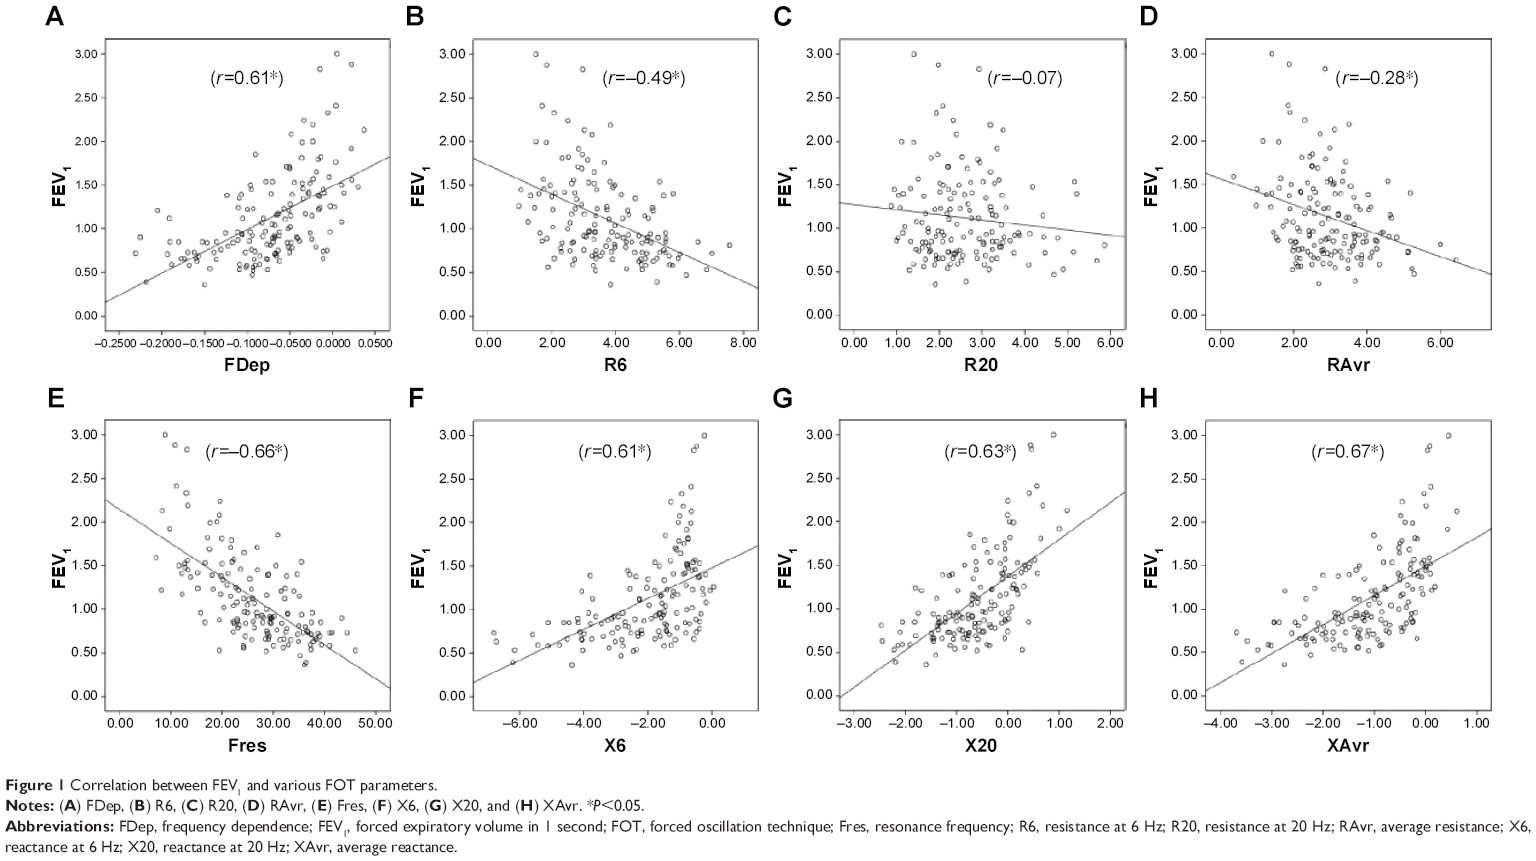 | Figure 1 Correlation between FEV1 and various FOT parameters. |
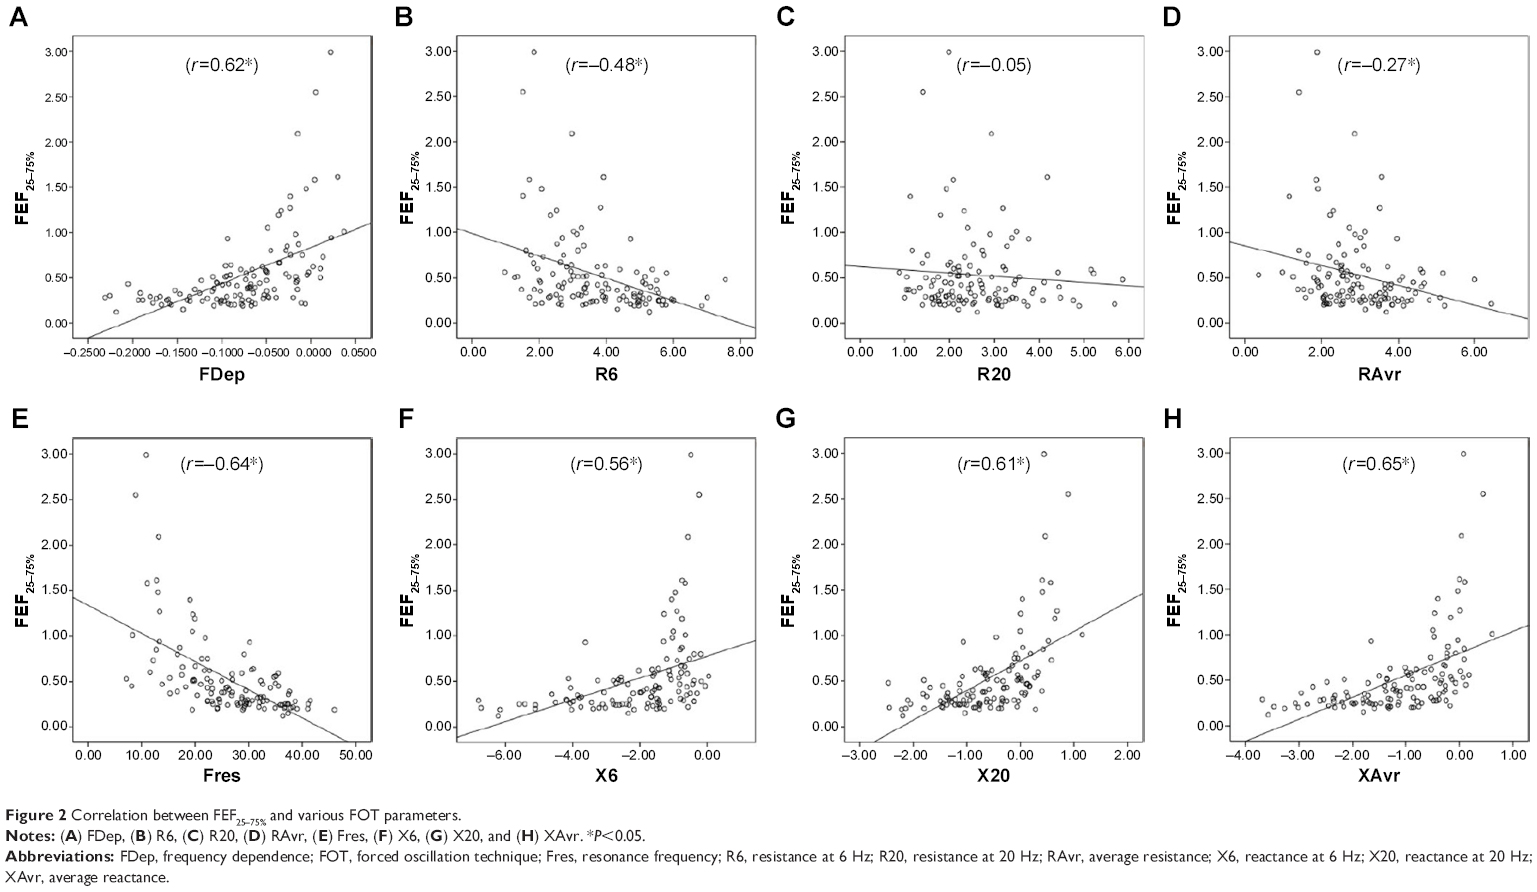 | Figure 2 Correlation between FEF25–75% and various FOT parameters. |
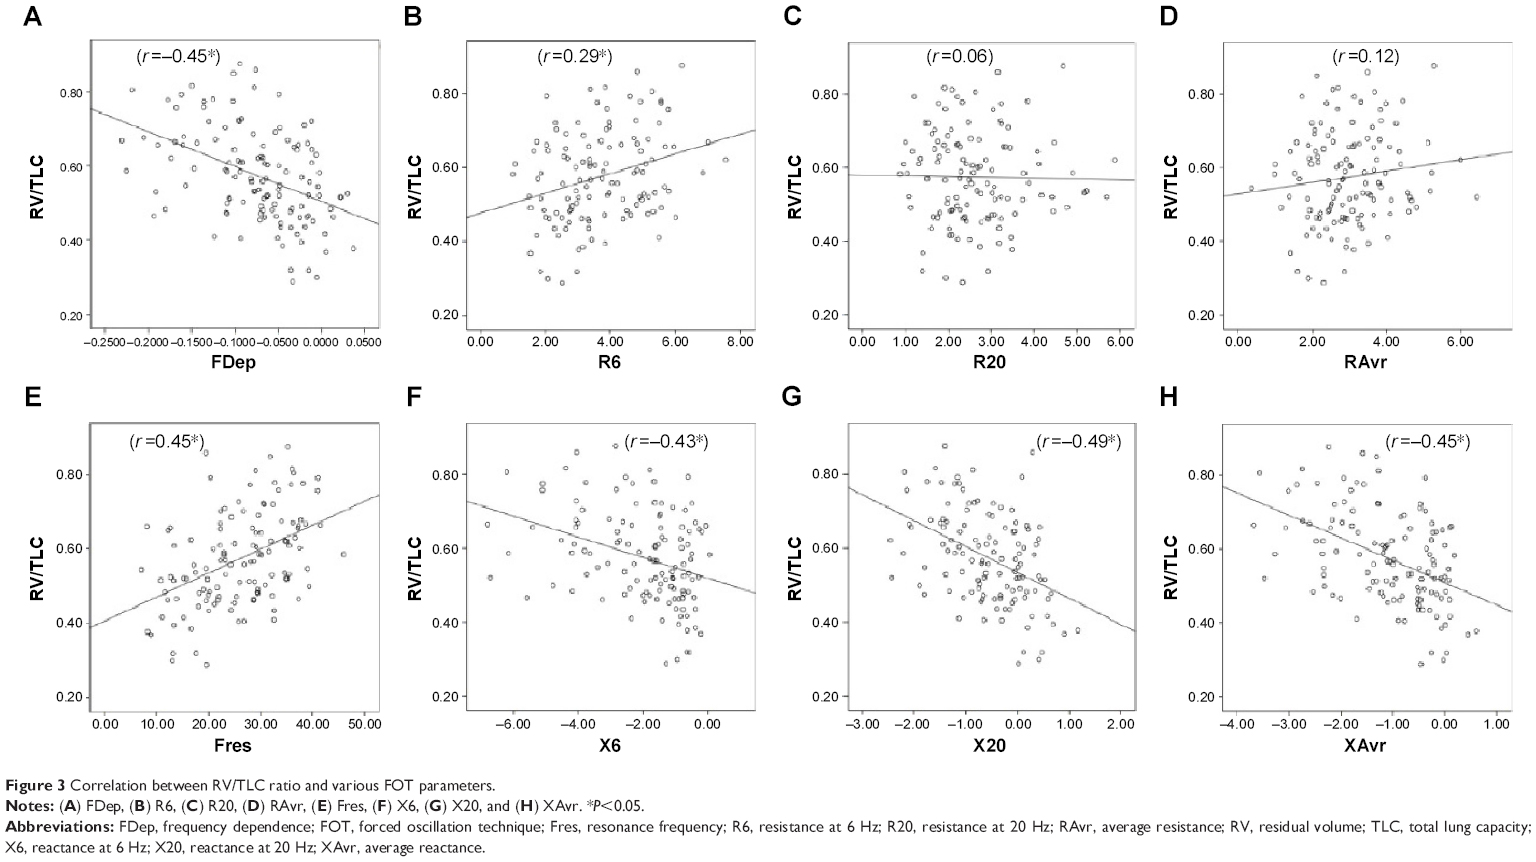 | Figure 3 Correlation between RV/TLC ratio and various FOT parameters. |
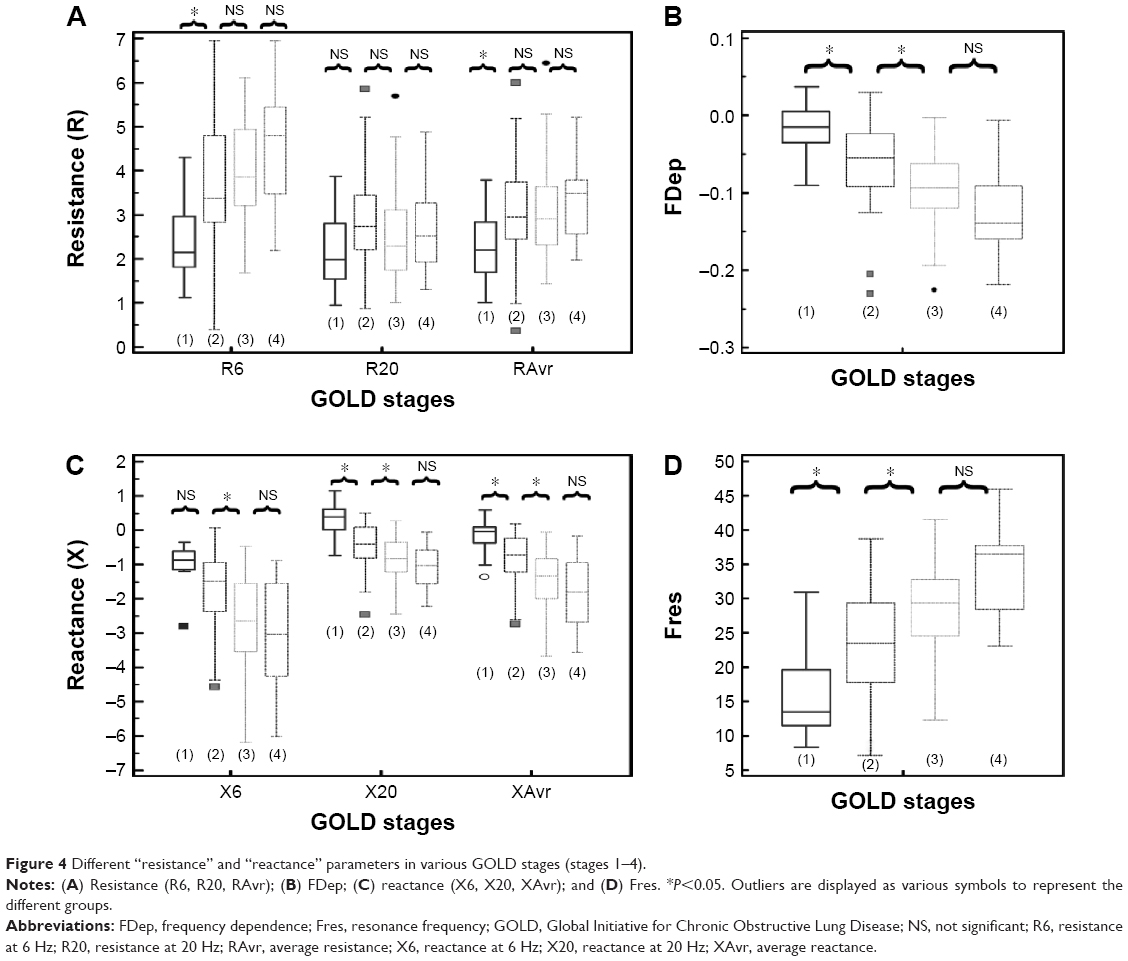 | Figure 4 Different “resistance” and “reactance” parameters in various GOLD stages (stages 1–4). |
Predicting severe type of patients with COPD (FEV1 <50%)
Reactance values (X), in general, had a high sensitivity (70%–76%) and specificity (64%–72%) in identifying severe type of COPD, among which Fres showed the highest area under the curve (AUC: 0.80). Of the resistance parameters, FDep was good in identifying severe patients with COPD (AUC: 0.77), while isolated R values (R6, R20, and RAvr) were not (AUC: 0.4–0.6) (Table 3; Figure 5).
 | Table 3 The cutoff points of various FOT parameters (reactance and resistance) in diagnosing severe type of patients with COPD (%FEV1 <50%) |
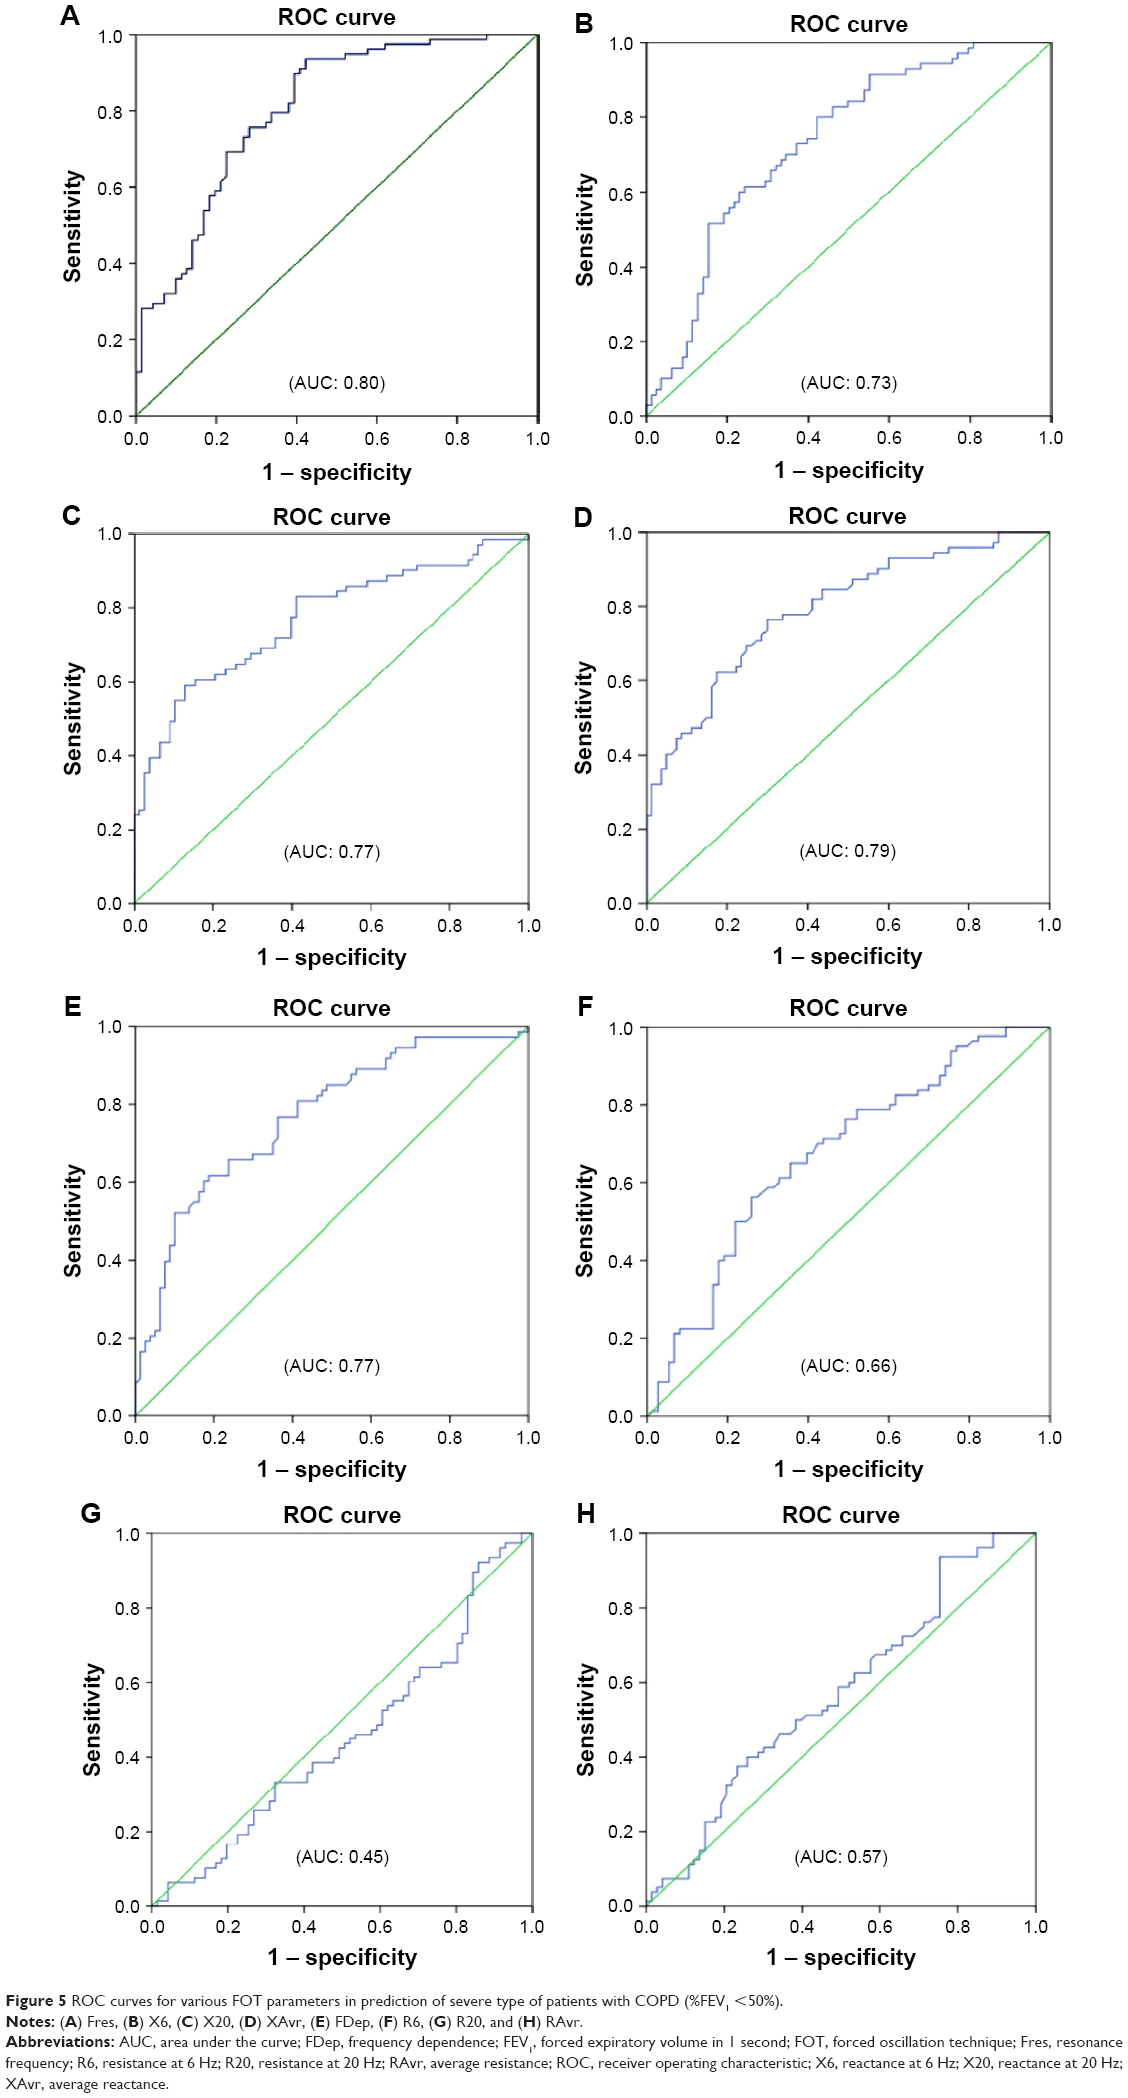 | Figure 5 ROC curves for various FOT parameters in prediction of severe type of patients with COPD (%FEV1 <50%). |
Assessment of air trapping
Since there is no standardized stratification system for the severity of air trapping in patients with COPD, air trapping was arbitrarily divided into three different degrees according to the RV/TLC ratio in this study. The cutoff points were chosen to be close to the 25th and 50th percentile of RV/TLC ratio. Group 1 (mild air trapping) consisted of patients with RV/TLC ratio <0.45, group 2 (moderate air trapping) patients had the ratio between 0.45 and 0.6, and group 3 (severe air trapping) patients had RV/TLC ratio >0.6.
The correlation of FOT parameters to various degrees of air trapping is depicted in Figure 6. Reactance was better than resistance parameters in stratifying various degrees of air trapping. There was a significant difference of reactance values (XAvr, Fres, and X20Hz) among the three different severities of air trapping (P<0.05 between each group), while isolated resistance FOT parameters (RAvr and R6Hz) did not differ (P>0.05) (Figure 6). Moreover, reactance (X) parameters showed a stronger correlation with other lung volume parameters (IC, FVC, RV, RV/TLC ratio) when compared to the isolated R parameters (r around 0.45 vs r<0.3) (Figure 3; Table S1).
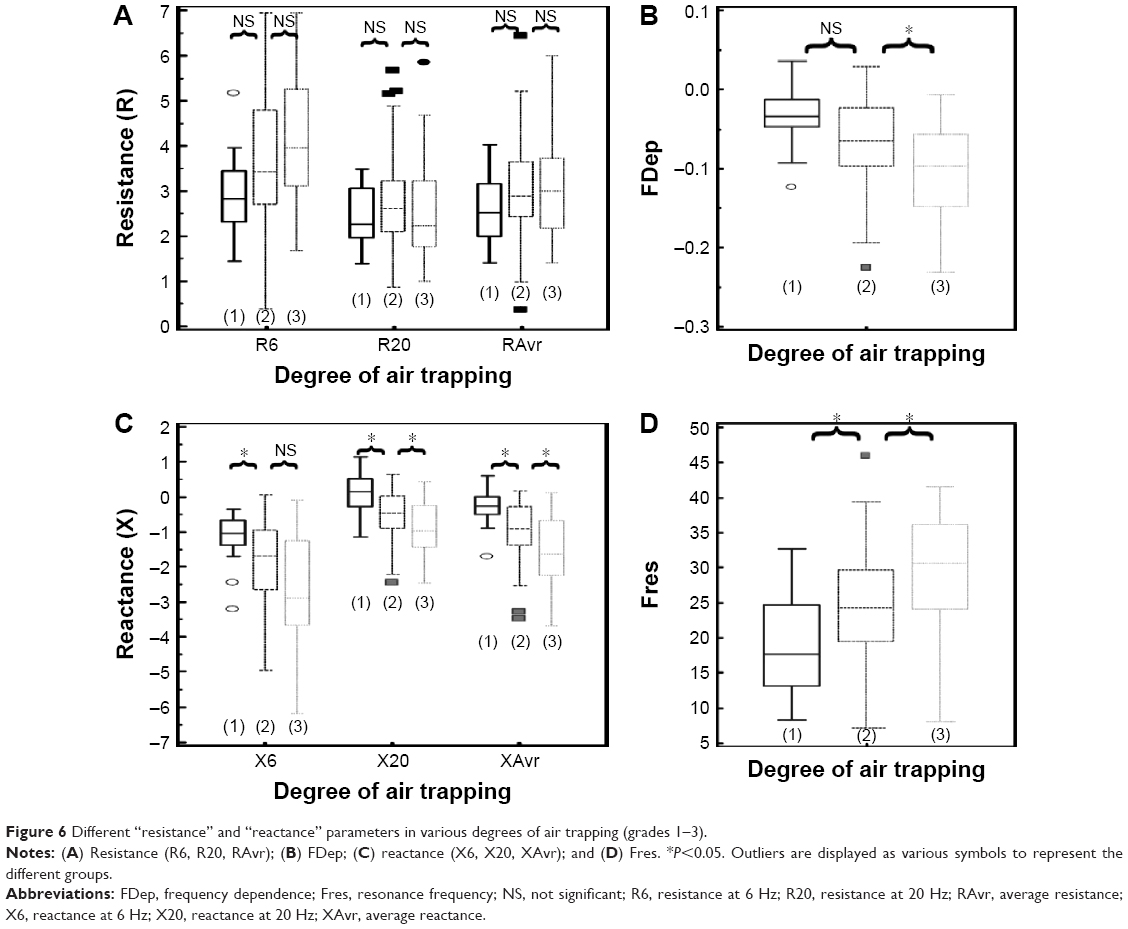 | Figure 6 Different “resistance” and “reactance” parameters in various degrees of air trapping (grades 1–3). |
Discussion
Assessment of the severity of airflow limitation and central airway function
Previous studies have shown a rather good correlation between FOT and spirometric parameters.7,8,21–29 Moreover, our study has further highlighted that such good correlation could be maintained even at an advanced age among geriatric group patients (mean age of our study population was 72 years), who are more vulnerable to cognitive and functional impairment that results in difficulties and underuse of conventional lung function test.
Furthermore, we also demonstrated that FOT might have a role in the assessment of the severity of airflow limitation in geriatric patients, especially in those elderly patients who have difficulty in performing conventional spirometry. In particular, FEV1, generally regarded as a marker to reflect central airway function, was shown to be highly correlated to both X values and FDep (r=0.61–0.67). Furthermore, the role of X values and FDep in the assessment of severity of airflow obstruction was further highlighted by their strong correlation with various GOLD stages in the current study. These results are compatible with previous findings and are of paramount importance since current COPD guideline recommends combined assessment approach in the management of patients with COPD, in which patients with COPD with severe airflow limitation (%FEV1 <50%) are regarded as a high-risk group. Our study showed not only the superiority of X to R in the classification of various GOLD stages but also its high sensitivity and specificity in identifying the high-risk patients. In particular, X values, in general, have a high sensitivity (70%–76%) and specificity (64%–72%) in identifying the severe type of COPD (%FEV1 <50%), among which Fres showed the highest AUC (0.80). In contrast, R values were insensitive to identify severe type of COPD (AUC: 0.4–0.6). Likewise, previous studies26,30,31 had suggested that isolated R values like RAvr were a poor parameter to assess COPD severity, while X values (especially Fres) as well as FDep were better markers.32 In addition, the various FOT cutoff values for severe airflow limitation (%FEV1 <50%) were also determined in our study.
Assessment of small airway function
Small airway measurement is challenging and it was expressed in terms of FEF25–75% in our study. A high correlation between X and FEF25–75% signified that X is valuable in small airway assessment. X is the imaginary part of respiratory impedance (Zrs), comprising the effects of inertia (I) and compliance (C). Compliance (C), which represents the ability of the respiratory system to store energy, is primarily located in the lung periphery. Therefore, X at a low frequency can reflect tissue recoil in distal airway. Furthermore, within-breath analysis had further suggested that respiratory phase difference in reactance (ΔXrs) could detect expiratory flow limitation (EFL), which is a characteristic feature in patients with moderate-to-severe COPD with dynamic hyperinflation.33–35
However, R values, in general, had a lower correlation to FEF25–75%, when compared to X values. R20 assesses small airway function poorly because of its damping effect in distal airways. Moreover, our study suggested that FDep was the best indicator among R values for assessment of peripheral airway obstruction (FEF25–75%) (r=0.48 vs 0.62). FDep is the slope of resistance–frequency curve, it is very sensitive to detect small airway disease because a small rise in small airway resistance would significantly reduce the slope-gradient in FDep. In fact, the use of FDep has also been proposed by previous studies to be highly correlated with peripheral airway disease32,36 and detection of early airway disease.16,37 Furthermore, FDep had been shown to be closely linked to the activity-related dyspnea in patients with moderate-to-severe COPD.38
In fact, evidences suggested that FOT may detect subtle changes in distal airway function earlier than with conventional spirometry, even in the setting of normal spirometry.39 Shi et al40 suggested that small airway impulse oscillometry index was even better than FEV1 and FEF25–75% in the detection of small airway dysfunction. Besides, in the trial of Frantz et al,41 self-reported chronic bronchitis, emphysema, or COPD was associated with higher impulse oscillometry pulmonary resistance and lower pulmonary reactance, even in patients with normal spirometry. The high sensitivity of FOT in small airway function renders its value in clinical application to monitor disease progress and treatment response. It has already been utilized to monitor disease progress in patients with posttransplant bronchiolitis obliterans and treatment effect on small airway in patients with COPD.42,43
Assessment of the degree of air trapping
Measurement of air trapping is difficult, although it contributes significantly to symptoms in patients with COPD.17 Conventional plethysmography is labor intensive and time-consuming, while a quantitative computed tomography (CT) scan is expensive with significant radiation risk.44,45 FOT, a convenient tool with good correlation with small airway function, may have a role in the assessment of air trapping. However, previous trials on the correlation between FOT and air trapping parameters showed conflicting results. For instance, the prospective study of Kolsum et al8 showed only a weak association between FOT parameters and lung volume parameters such as TLC and IC (r<0.25). Likewise, the large cohort study of Crim et al46 that utilized “percentage of low attenuation area” (%LAA) in CT thorax scan for assessing degree of air trapping/emphysema failed to demonstrate a significant direct relationship between FOT parameters (R5, R5–R20, reactance area) and %LAA (r<0.16), despite the fact that both FOT impedance parameters and %LAA worsen as GOLD stage increases.
In contrary to these studies, our study did demonstrate a higher correlation between FOT parameters and IC (r around 0.4–0.46). We also demonstrated that X parameters (eg, Fres and XAvr) had a good correlation with RV/TLC ratio (r around 0.45), while isolated “resistive” parameters (RAvr and R6Hz) did not show the correlation (r<0.3).
Our study is consistent with the study of Van Noord et al,47 which showed the most prominent decrease in Xrs (resonance frequency) and frequency dependence in emphysema patients when compared to chronic bronchitis and asthma patients. In a recent study, Mikamo et al48 reported that a high EFL index (0.55 kPa·L−1·S−1) in FOT was independently predicted by emphysema extent measured by high-resolution computed tomography as well as the degree of hyperinflation as expressed by functional residual capacity. These findings could be explained by the superiority of X in the assessment of small airway dysfunction that results in air trapping. Furthermore, X represents lung compliance, which is the ability of the respiratory system to store energy. Compliance is significantly reduced in emphysema or air trapping because of loss of lung elastic recoil. It was, therefore, proposed that the degree of emphysema or air trapping correlated to the FOT reactance (X) parameters.49 Apart from this, respiratory phase difference in reactance (ΔX5) could also detect EFL,33,34 as demonstrated in the within-breath analysis. This EFL and small airway obstruction would result in air trapping. We thus believe that reactance parameters may have a role in the assessment of severities of air trapping in patients with COPD.
Strengths and limitations
The present study suggests that FOT may be a simple and effective means to assess airflow limitation (both central and small airway) as well as air trapping in patients with geriatric COPD, even at an advanced age (mean age >72 years), which may be important because this population has the most difficulties in performing conventional spirometry. Besides, we performed a comprehensive assessment of FOT in our study, showing that reactance parameters (X) are better than resistance parameters (R) in the assessment of the degree of airflow limitation, small and central airway function, as well as air trapping, which is significantly related to patients’ symptomatology. Furthermore, we also contributed to the management of patients with geriatric COPD by demonstrating FOT as a simple tool with high sensitivity and specificity in identifying the patients with high-risk COPD (%FEV1 <50%) in the geriatric group.
However, there were a number of limitations in our study. First, the COPD subjects were predominantly Chinese male; while reflecting the local epidemiology of predominant male smokers, this affects the study’s generalizability.
Second, since there was no reference value for the FOT parameters in Chinese patients, it was difficult to compare the “adjusted” FOT values to the “adjusted” spirometric values such as %FEV1. Regarding the assessment of air trapping, though RV/TLC ratio was correlated with hyperinflation of lung, it may not be the most accurate or stable parameter to determine the degree of air trapping. Other measurements such as quantitative CT scan may be a more robust method for determining the degree of air trapping. Moreover, within-breath analysis of FOT parameter was not performed in our study, though previous studies had suggested that higher impedances were observed in the expiratory phase of patients with COPD. Nevertheless, our study did confirm the high correlation between FOT and spirometric values, and we also demonstrated its role in the assessment of small airway function and air trapping.
Further studies on the role of FOT in the assessment of air trapping as well as identifying different COPD phenotypes are needed, especially using within-breath analysis of different FOT parameters and more robust techniques, such as quantitative CT scan, to quantify the severity of air trapping.
Conclusion
FOT may act as a simple and accurate tool in the assessment of severity of airflow limitation, small and central airway function, and air trapping in patients with geriatric COPD, especially in those who have difficulties performing conventional lung function test. Moreover, reactance parameters were better than resistance parameters in correlation with air trapping as well as identifying high-risk patients (%FEV1 <50%).
Acknowledgments
IRB committee: Hong Kong Hospital Authority Kowloon West Cluster Research Ethic committee (KWC-REC reference: KW/EX-12-030 [48-15]) is gratefully acknowledged. We would like to thank Ms Lau HM, Ms Siu MC, Ms Wong SY, Mr Cheung KT, Mr Hung CK, and Ms Chow FY for their technical assistance in performing lung function tests for the patients.
Author contributions
All authors made substantial contributions to conception and design, acquisition of data, or analysis and interpretation of data; took part in drafting the article or revising it critically for important intellectual content; gave final approval of the version to be published; and agree to be accountable for all aspects of the work.
Disclosure
The authors report no conflicts of interest in this work.
References
Ko FW, Hui DS, Lai CK. Worldwide burden of COPD in high- and low-income countries. Part III. Asia-Pacific studies. Int J Tuberc Lung Dis. 2008;12(7):713–717. | ||
Han MK, Kim MG, Mardon R, et al. Spirometry utilization for COPD: how do we measure up? Chest. 2007;132(2):403–409. | ||
Nishi SP, Wang Y, Kuo YF, Goodwin JS, Sharma G. Spirometry use among older adults with chronic obstructive pulmonary disease: 1999–2008. Ann Am Thorac Soc. 2013;10(6):565–573. | ||
De Filippi F, Tana F, Vanzati S, Balzarini B, Galetti G. Study of respiratory function in the elderly with different nutritional and cognitive status and functional ability assessed by plethysmographic and spirometric parameters. Arch Gerontol Geriatr. 2003;37(1):33–43. | ||
Pezzoli L, Giardini G, Consonni S, et al. Quality of spirometric performance in older people. Age Ageing. 2003;32(1):43–46. | ||
Sharma G, Hanania NA, Shim YM. The aging immune system and its relationship to the development of chronic obstructive pulmonary disease. Proc Am Thorac Soc. 2009;6(7):573–580. | ||
Williamson PA, Clearie K, Menzies D, Vaidyanathan S, Lipworth BJ. Assessment of small-airways disease using alveolar nitric oxide and impulse oscillometry in asthma and COPD. Lung. 2011;189(2):121–129. | ||
Kolsum U, Borrill Z, Roy K, et al. Impulse oscillometry in COPD: identification of measurements related to airway obstruction, airway conductance and lung volumes. Respir Med. 2009;103(1): 136–143. | ||
Jiang LF, Wang H, Yin KS, Huang M, Sun PL, Feng Y. [Impulse oscillometry for estimation of airway obstruction]. Zhonghua Jie He He Hu Xi Za Zhi. 2008;31(12):912–914. | ||
Wang M, Niu S, Li Y, Zhang Z, Bai C. The diagnostic value of total respiratory impedance by impulse oscillometry in chronic obstructive lung disease. Chin Med J (Engl). 1999;112(11):982–984. | ||
Kim HY, Shin YH, Jung da W, Jee HM, Park HW, Han MY. Resistance and reactance in oscillation lung function reflect basal lung function and bronchial hyperresponsiveness respectively. Respirology. 2009;14(7):1035–1041. | ||
Mansur AH, Manney S, Ayres JG. Methacholine-induced asthma symptoms correlate with impulse oscillometry but not spirometry. Respir Med. 2008;102(1):42–49. | ||
Weersink EJ, vd Elshout FJ, van Herwaarden CV, Folgering H. Bronchial responsiveness to histamine and methacholine measured with forced expirations and with the forced oscillation technique. Respir Med. 1995;89(5):351–356. | ||
Wouters EF, Polko AH, Schouten HJ, Visser BF. Contribution of impedance measurement of the respiratory system to bronchial challenge tests. J Asthma. 1988;25(5):259–267. | ||
Faria AC, Costa AA, Lopes AJ, Jansen JM, Melo PL. Forced oscillation technique in the detection of smoking-induced respiratory alterations: diagnostic accuracy and comparison with spirometry. Clinics (Sao Paulo). 2010;65(12):1295–1304. | ||
Brochard L, Pelle G, de Palmas J, et al. Density and frequency dependence of resistance in early airway obstruction. Am Rev Respir Dis. 1987;135(3):579–584. | ||
O’Donnell DE, Flüge T, Gerken F, et al. Effects of tiotropium on lung hyperinflation, dyspnoea and exercise tolerance in COPD. Eur Respir J. 2004;23(6):832–840. | ||
Oostveen E, MacLeod D, Lorino H, et al. The forced oscillation technique in clinical practice: methodology, recommendations and future developments. Eur Respir J. 2003;22(6):1026–1041. | ||
Standardization of spirometry, 1994 update. American Thoracic Society. Am J Respir Crit Care Med. 1995;152(3):1107–1136. | ||
Ip MS, Ko FW, Lau AC, et al. Updated spirometric reference values for adult Chinese in Hong Kong and implications on clinical utilization. Chest. 2006;129(2):384–392. | ||
Tanaka H, Fujii M, Kitada J. [Further examination of COPD using spirometry, respiratory function test, and impulse oscillometry]. Nihon Rinsho. 2011;69(10):1786–1791. | ||
Kanda S, Fujimoto K, Komatsu Y, Yasuo M, Hanaoka M, Kubo K. Evaluation of respiratory impedance in asthma and COPD by an impulse oscillation system. Intern Med. 2010;49(1):23–30. | ||
Winkler J, Hagert-Winkler A, Wirtz H, Schauer J, Kahn T, Hoheisel G. [Impulse oscillometry in the diagnosis of the severity of obstructive pulmonary disease]. Pneumologie. 2009;63(5):266–275. | ||
Vestbo J, Anderson W, Coxson HO, et al. Evaluation of COPD Longitudinally to Identify Predictive Surrogate End-points (ECLIPSE). Eur Respir J. 2008;31(4):869–873. | ||
Al-Mutairi SS, Sharma PN, Al-Alawi A, Al-Deen JS. Impulse oscillometry: an alternative modality to the conventional pulmonary function test to categorise obstructive pulmonary disorders. Clin Exp Med. 2007;7(2):56–64. | ||
Di Mango AM, Lopes AJ, Jansen JM, Melo PL. Changes in respiratory mechanics with increasing degrees of airway obstruction in COPD: detection by forced oscillation technique. Respir Med. 2006;100(3):399–410. | ||
Guo YF, Sun TY, Herrmann F, Janssens JP. Comparison of airway resistance measurements by the forced oscillation technique and the interrupter technique for detecting chronic obstructive pulmonary disease in elderly patients. Chin Med J (Engl). 2005;118(22):1921–1924. | ||
Cooper CB. Assessment of pulmonary function in COPD. Semin Respir Crit Care Med. 2005;26(2):246–252. | ||
Zerah F, Lorino AM, Lorino H, Harf A, Macquin-Mavier I. Forced oscillation technique vs spirometry to assess bronchodilatation in patients with asthma and COPD. Chest. 1995;108(1):41–47. | ||
Janssens JP, Nguyen MC, Herrmann FR, Michel JP. Diagnostic value of respiratory impedance measurements in elderly subjects. Respir Med. 2001;95(5):415–422. | ||
Làndsér FJ, Clément J, Van de Woestijne KP. Normal values of total respiratory resistance and reactance determined by forced oscillations: influence of smoking. Chest. 1982;81(5):586–591. | ||
Clément J, Làndsér FJ, Van de Woestijne KP. Total resistance and reactance in patients with respiratory complaints with and without airways obstruction. Chest. 1983;83(2):215–220. | ||
Dellacà RL, Duffy N, Pompilio PP, et al. Expiratory flow limitation detected by forced oscillation and negative expiratory pressure. Eur Respir J. 2007;29(2):363–374. | ||
Dellacà RL, Santus P, Aliverti A, et al. Detection of expiratory flow limitation in COPD using the forced oscillation technique. Eur Respir J. 2004;23(2):232–240. | ||
Paredi P, Goldman M, Alamen A, et al. Comparison of inspiratory and expiratory resistance and reactance in patients with asthma and chronic obstructive pulmonary disease. Thorax. 2010;65(3):263–267. | ||
Lándsér FJ, Nagles J, Demedts M, Billiet L, van de Woestijne KP. A new method to determine frequency characteristics of the respiratory system. J Appl Physiol. 1976;41(1):101–106. | ||
Coe CI, Watson A, Joyce H, Pride NB. Effects of smoking on changes in respiratory resistance with increasing age. Clin Sci (Lond). 1989;76(5):487–494. | ||
Mahut B, Caumont-Prim A, Plantier L, et al. Relationships between respiratory and airway resistances and activity-related dyspnea in patients with chronic obstructive pulmonary disease. Int J Chron Obstruct Pulmon Dis. 2012;7:165–171. | ||
Oppenheimer BW, Goldring RM, Berger KI. Distal airway function assessed by oscillometry at varying respiratory rate: comparison with dynamic compliance. COPD. 2009;6(3):162–170. | ||
Shi Y, Aledia AS, Tatavoosian AV, Vijayalakshmi S, Galant SP, George SC. Relating small airways to asthma control by using impulse oscillometry in children. J Allergy Clin Immunol. 2012;129(3):671–678. | ||
Frantz S, Nihlen U, Dencker M, Engstrom G, Löfdahl CG, Wollmer P. Impulse oscillometry may be of value in detecting early manifestations of COPD. Respir Med. 2012;106(8):1116–1123. | ||
Tse HN, Raiteri L, Wong KY, et al. High-dose N-acetylcysteine in stable COPD: the 1-year, double-blind, randomized, placebo-controlled HIACE study. Chest. 2013;144(1):106–118. | ||
Tse HN, Raiteri L, Wong KY, Ng LY, Yee KS, Tseng CZ. Benefits of high-dose N-acetylcysteine to exacerbation-prone patients with COPD. Chest. 2014;146(3):611–623. | ||
Barbosa EM Jr, Song G, Tustison N, et al. Computational analysis of thoracic multidetector row HRCT for segmentation and quantification of small airway air trapping and emphysema in obstructive pulmonary disease. Acad Radiol. 2011;18(10):1258–1269. | ||
Lynch DA, Newell JD. Quantitative imaging of COPD. J Thorac Imaging. 2009;24(3):189–194. | ||
Crim C, Celli B, Edwards LD, et al. Respiratory system impedance with impulse oscillometry in healthy and COPD subjects: ECLIPSE baseline results. Respir Med. 2011;105(7):1069–1078. | ||
Van Noord JA, Clément J, Van de Woestijne KP, Demedts M. Total respiratory resistance and reactance in patients with asthma, chronic bronchitis, and emphysema. Am Rev Respir Dis. 1991;143(5 Pt 1):922–927. | ||
Mikamo M, Shirai T, Mori K, et al. Predictors of expiratory flow limitation measured by forced oscillation technique in COPD. BMC Pulm Med. 2014;14:23. | ||
Goldman MD, Saadeh C, Ross D. Clinical applications of forced oscillation to assess peripheral airway function. Respir Physiol Neurobiol. 2005;148(1–2):179–194. |
Supplementary material
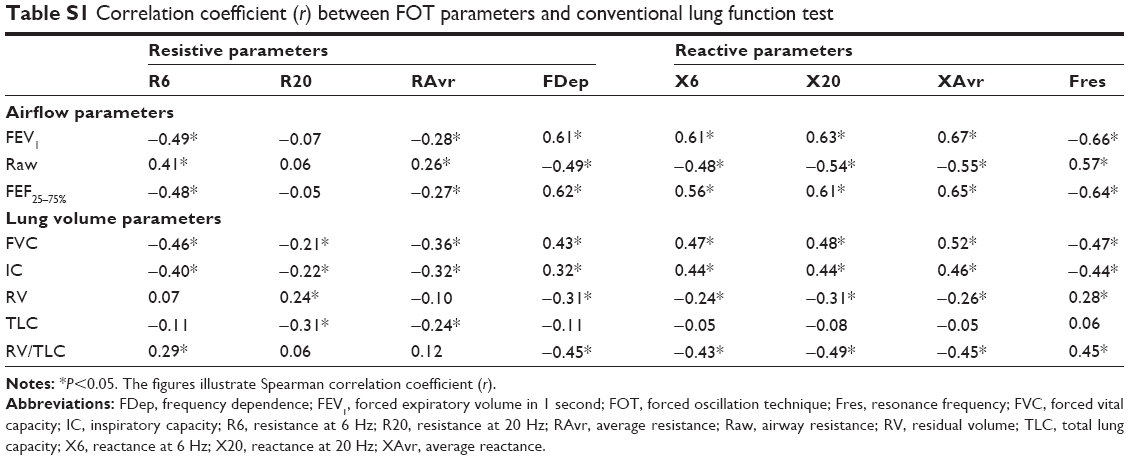 | Table S1 Correlation coefficient (r) between FOT parameters and conventional lung function test |
 © 2016 The Author(s). This work is published and licensed by Dove Medical Press Limited. The
full terms of this license are available at https://www.dovepress.com/terms
and incorporate the Creative Commons Attribution
- Non Commercial (unported, 3.0) License.
By accessing the work you hereby accept the Terms. Non-commercial uses of the work are permitted
without any further permission from Dove Medical Press Limited, provided the work is properly
attributed. For permission for commercial use of this work, please see paragraphs 4.2 and 5 of our Terms.
© 2016 The Author(s). This work is published and licensed by Dove Medical Press Limited. The
full terms of this license are available at https://www.dovepress.com/terms
and incorporate the Creative Commons Attribution
- Non Commercial (unported, 3.0) License.
By accessing the work you hereby accept the Terms. Non-commercial uses of the work are permitted
without any further permission from Dove Medical Press Limited, provided the work is properly
attributed. For permission for commercial use of this work, please see paragraphs 4.2 and 5 of our Terms.