Back to Journals » ClinicoEconomics and Outcomes Research » Volume 7
Acceptance of health technology assessment submissions with incremental cost-effectiveness ratios above the cost-effectiveness threshold
Authors Griffiths E, Hendrich J, Stoddart S, Walsh S
Received 27 April 2015
Accepted for publication 8 July 2015
Published 31 August 2015 Volume 2015:7 Pages 463—476
DOI https://doi.org/10.2147/CEOR.S87462
Checked for plagiarism Yes
Review by Single anonymous peer review
Peer reviewer comments 6
Editor who approved publication: Professor Giorgio L Colombo
Elizabeth A Griffiths, Janek K Hendrich, Samuel DR Stoddart, Sean CM Walsh
HERON™ Commercialization, PAREXEL International, London, UK
Objectives: In health technology assessment (HTA) agencies where cost-effectiveness plays a role in decision-making, an incremental cost-effectiveness ratio (ICER) threshold is often used to inform reimbursement decisions. The acceptance of submissions with ICERs higher than the threshold was assessed across different agencies and across indications, in order to inform future reimbursement submissions.
Methods: All HTA appraisals from May 2000 to May 2014 from National Institute for Health and Care Excellence (NICE), Scottish Medicines Consortium (SMC), Pharmaceutical Benefits Advisory Committee (PBAC), and Canadian Agency for Drugs and Technologies in Health (CADTH) were assessed. Multiple technology appraisals, resubmissions, vaccination programs, and requests for advice were excluded. Submissions not reporting an ICER, or for which an ICER could not be determined were also excluded. The remaining appraisals were reviewed, and the submitted ICER, recommendation, and reasoning behind the recommendation were extracted.
Results: NICE recommended the highest proportion of submissions with ICERs higher than the threshold (34% accepted without restrictions; 20% with restrictions), followed by PBAC (16% accepted without restrictions; 4% with restrictions), SMC (11% accepted without restrictions; 14% accepted with restrictions), and CADTH (0% accepted without restrictions; 26% with restrictions). Overall, the majority of higher-than-threshold ICER submissions were classified into the "malignant disease and immunosuppression" therapeutic category; however, there was no notable variation in acceptance rates by disease area. Reasons for accepting submissions reporting ICERs above the threshold included high clinical benefit over the standard of care, and addressing an unmet therapeutic need.
Conclusion: Acceptance of submissions with higher-than-threshold ICERs varied by HTA agency and was not significantly influenced by disease category. Such submissions must be accompanied by robust, concrete, and transparent evidence in order to achieve patient access.
Keywords: decision-making, incremental cost-effectiveness ratio, health technology assessment, QALY, cost-effectiveness
Introduction
Health care decision-makers are faced with the challenge of identifying the optimal allocation of limited resources to optimize health benefit. However, due to constant budgetary constraints, most health care systems cannot make all new interventions developed for the detection, prevention, and treatment of diseases available.1
Governments are increasingly required to manage limited health care resources strategically, by investing only in those services that deliver the best health outcomes while still providing care that is affordable, effective, safe, and patient-centered. In response to these pressures, health care decision-makers have developed explicit systems, in the form of a health technology assessment (HTA), to identify interventions that provide the best value and aid resource allocation decisions.
Over the last 10 years, HTA has become an increasingly important part of the overall assessment system of new health technologies, and has the potential to assist payers in making informed decisions about allocating resources across the health care system. HTA examines the full range of clinical and economic evidence of a new intervention following market authorization, focusing not only on the health effects but also on the broader societal implications of introducing the intervention within the health care system.2
The objective of HTA programs is to make decisions regarding the acceptance, restriction, or rejection of interventions on a rational basis. Many HTA agencies use cost-effectiveness analysis to inform such decisions, where cost-effectiveness is expressed using incremental cost-effectiveness ratios (ICERs). ICERs are calculated by dividing the incremental cost of an intervention by the incremental benefit, which is often expressed in quality-adjusted life years (QALYs). QALYs are captured by applying a quality-adjusted weight to each health state of a disease (by balancing the quantity of life [or life-years gained] against the quality of that life), multiplying this by the time in each health state, and summing. Alternatively, disability-adjusted life-years or life-years gained may be used to estimate health benefit in cost-effectiveness analyses.1
Agencies that consider cost-effectiveness tend to use either a formal or informal ICER threshold to aid the decision-making process;3 however, there are some situations where applying an ICER threshold is insufficient. The concept of an ICER threshold refers to a balance between costs and health benefits that an intervention must achieve in order to be considered acceptable within a given health care system.1 By using an ICER threshold in HTA, the decision rule for any intervention is based on achieving a prespecified ratio of monetary costs per measure of health gain. The use of ICER thresholds in the HTA decision-making process ensures the consistency, transparency, and predictability of the process. ICER thresholds dictate that the results of the cost per health gain should be the sole decision criterion for resource allocation. However, this limits the incorporation of other considerations, such as societal preferences, budget impact of the intervention under evaluation, and the value of innovation.
Establishing the economic value of an intervention can be difficult in certain situations, such as in the case of orphan drugs, which are therapies indicated for the treatment of rare diseases. There is no globally accepted definition for an orphan disease, but the European Medicines Agency considers it to be a disease that affects fewer than 5 per 10,000 of the population, while the US Food and Drug Administration defines it as a disease affecting fewer than 200,000 people.4 Due to the small patient populations, orphan drugs are often associated with a high cost, making it unlikely that the drug will be able to demonstrate cost-effectiveness according to traditional thresholds. As a result, many HTA programs have established specific criteria with which to judge the cost-effectiveness of orphan drugs.5,6 Similarly, allowances may be made in some cases for drugs that extend life for patients with a short life expectancy (the so-called “end-of-life” criteria).7 The policy decisions around orphan drugs and end-of-life care demonstrate some of the difficulties of using ICER thresholds as the sole decision criterion of HTA.
While many HTA programs use formal or informal ICER thresholds to make decisions, whereby the calculated ICER for an intervention is a key criterion for decision-making, there remains an opportunity to incorporate other criteria within the process.3
The objective of this study was to identify the key rationale provided by four different HTA agencies – the National Institute for Health and Care Excellence (NICE, England), Scottish Medicines Consortium (SMC), Canadian Agency for Drugs and Technologies in Health (CADTH), and Pharmaceutical Benefits Advisory Committee (PBAC, Australia) – when their decisions went against the assumed ICER thresholds, and evaluate any differences between disease areas. We hypothesized that no significant differences in acceptance rates of submissions with ICERs higher than the threshold are observed between disease areas.
Methods
Data sources
All publicly available HTA appraisals from NICE, SMC, CADTH, and PBAC were searched from January 2000 to May 2014. These agencies were chosen as they represent key agencies that use cost-effectiveness criteria to inform decision-making around the globe and release publicly available, transparent, English-language appraisal documents for each intervention evaluated. Agency ICER thresholds (expressed in cost per QALY) were assumed for each of the four HTA agencies included in this analysis, based on published literature, agency publications, and inference based on previous decision-making trends.3,8,9 The following agency thresholds were assumed in the analysis: £30,000 per QALY for NICE and SMC; CAN$50,000 for CADTH; and AUS$42,000 for PBAC.
Appraisal selection
All single technology appraisals across the four agencies were assessed in this analysis. Appraisals were not excluded on the basis of disease area, indication, or type of intervention. Not all HTA submissions present a cost-effectiveness analysis, instead using a cost-minimization analysis or budget impact analysis. Since this analysis considered the rationale for decisions that went against the assumed ICER thresholds, other types of economic evaluations were not relevant to this analysis. Therefore, submissions that did not present a cost-effectiveness analysis expressed in cost per QALY, or for which an ICER could not be determined, were excluded. Multiple technology appraisals, resubmissions, vaccination programs, and requests for advice were also excluded, due to the practical difficulties of extracting singular ICERs for such submissions.
Data extraction
The full responses for all appraisals that met the inclusion criteria of this analysis were reviewed. The manufacturer’s base case ICER, recommendation, and rationale for the recommendation were extracted for all appraisals. The base case ICER was extracted to ensure consistency in the approach; while the ICER may have been adjusted during the appraisal process, the base case ICER reflected a common starting point from which to compare appraisals (being the most consistently reported value). Appraisals accepted in-line with the submission indication were classified as accepted. Appraisals accepted in a restricted population or for which agency-defined restrictions were placed were classified as restricted. Appraisals that were not recommended were classified as rejected.
Where multiple base case ICERs were submitted, the ICER was selected based on the proposed indication of the drug. When submissions included patient access schemes, ICERs both with and without the patient access schemes were extracted (Figure 1).
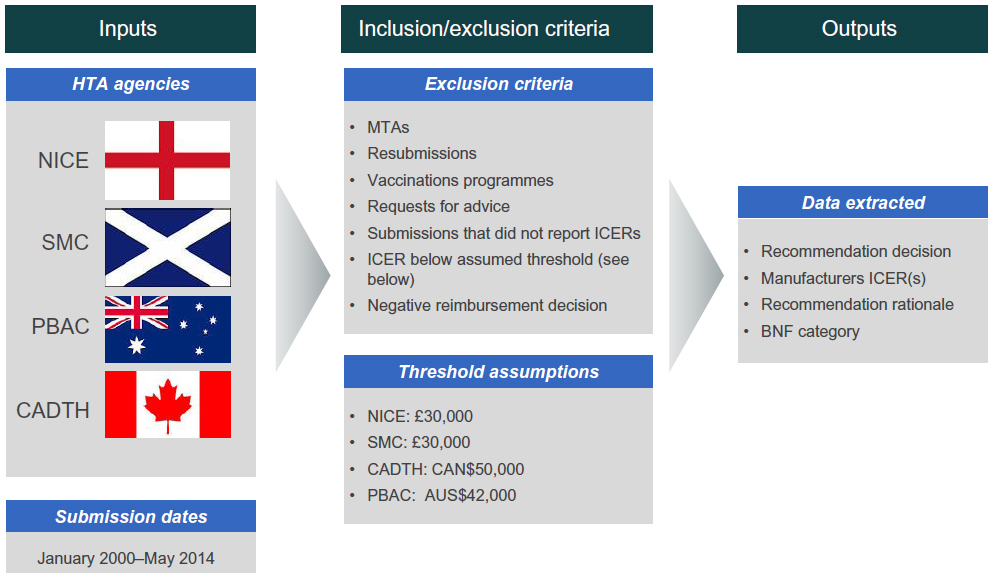 | Figure 1 Summary of methods. |
Disease area analysis
Submissions were classified by disease area based on British National Formulary (BNF) categories. To determine whether differences in acceptance rates varied by disease area, a funnel plot was used with limits ±3 standard error (SE) of the mean. This method allows for differences in sample sizes between categories. A chi-square test was also carried out to test any potential significant differences.
Results
Overall acceptance trends
A total of 679 submissions were identified that met the inclusion criteria between January 2000 and May 2014: 114 from NICE, 310 from SMC, 68 from CADTH, and 187 from PBAC.
NICE recommended the highest proportion of submissions overall, with an acceptance rate of 76% (87/114); 66 of these were accepted unconditionally and 21 with restrictions. SMC recommended 52% (162/310) of submissions, 94 without restrictions and 68 with restrictions. CADTH recommended 53% (36/68) of submissions, though just 4 of these were accepted without restrictions; the remaining 32 were restricted. PBAC recommended the lowest proportion of submissions (42% [79/187]), 73 of which were accepted without restrictions and 6 with restrictions (Table 1).
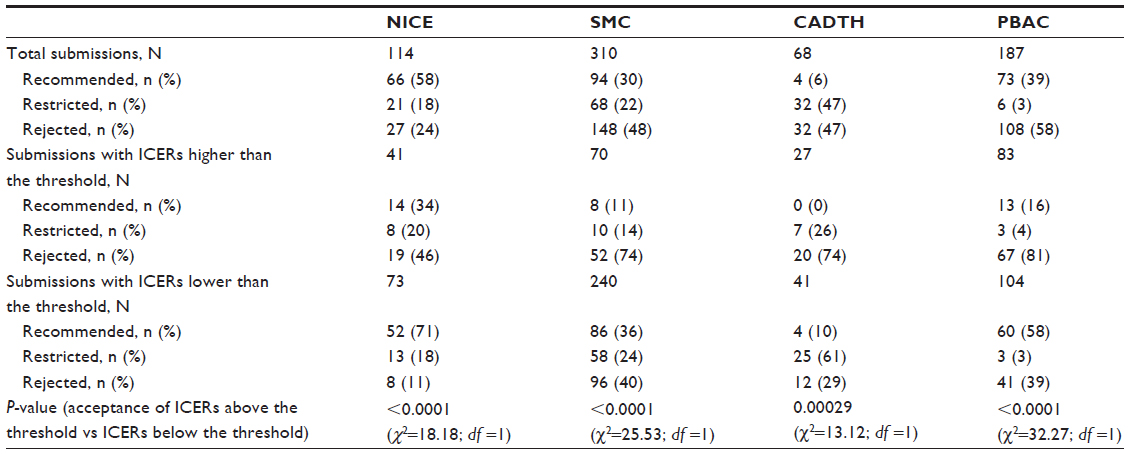 | Table 1 Acceptance rates for total submissions and for submissions with ICERs higher than the threshold (N=679) |
The influence of ICER thresholds on acceptance rates was then examined. Across all agencies, acceptance rates were statistically significantly lower for submissions with ICERs higher than the threshold than for submissions with ICERs lower than the threshold (P<0.0005 for all agencies). Nevertheless, a considerable proportion of submissions were accepted with ICERs higher than the threshold, especially in the case of NICE (Table 1). A list of all submissions accepted with ICERs higher than the threshold can be found in Table S1.
Rationale for acceptance of submissions reporting ICERs higher than the threshold
A total of 28/63 (44%) accepted submissions with ICERs higher than the threshold had restrictions imposed on them (8 for NICE; 10 for SMC; 7 for CADTH; and 3 for PBAC), mostly by limiting the eligible patient population. In submissions that were accepted unconditionally, a convincing argument was required to justify the added costs, and patient access or risk-sharing schemes were often agreed to bring costs down. In other cases, drivers for acceptance included addressing an unmet therapeutic need, demonstrating a clear and certain clinical benefit over the current standard of care, and meeting end-of-life or orphan drug criteria (Table S1). In the case of NICE, innovation was also a key consideration for some submissions.
The effect of therapy area on appraisal outcome
Acceptance rates by disease area were assessed to determine whether submissions in some disease areas were more likely to be accepted than others. ICER thresholds were also applied to these findings, to explore whether ICER thresholds vary by disease area (Table S2).
NICE
Interventions in the malignant disease and immunosuppression disease category (specifically oncologics) accounted for the majority of NICE submissions, with an acceptance rate slightly lower than the average across all disease areas. Over half of submissions in the malignant disease and immunosuppression category reported ICERs higher than NICE’s £30,000 cost-effectiveness threshold (32/56; 57.1%). Technologies in the cardiovascular system category had the highest overall acceptance rate, with 13/14 (92.9%) submissions accepted without restrictions. However, all of these submissions reported ICERs in line with the threshold (Figure 2A).
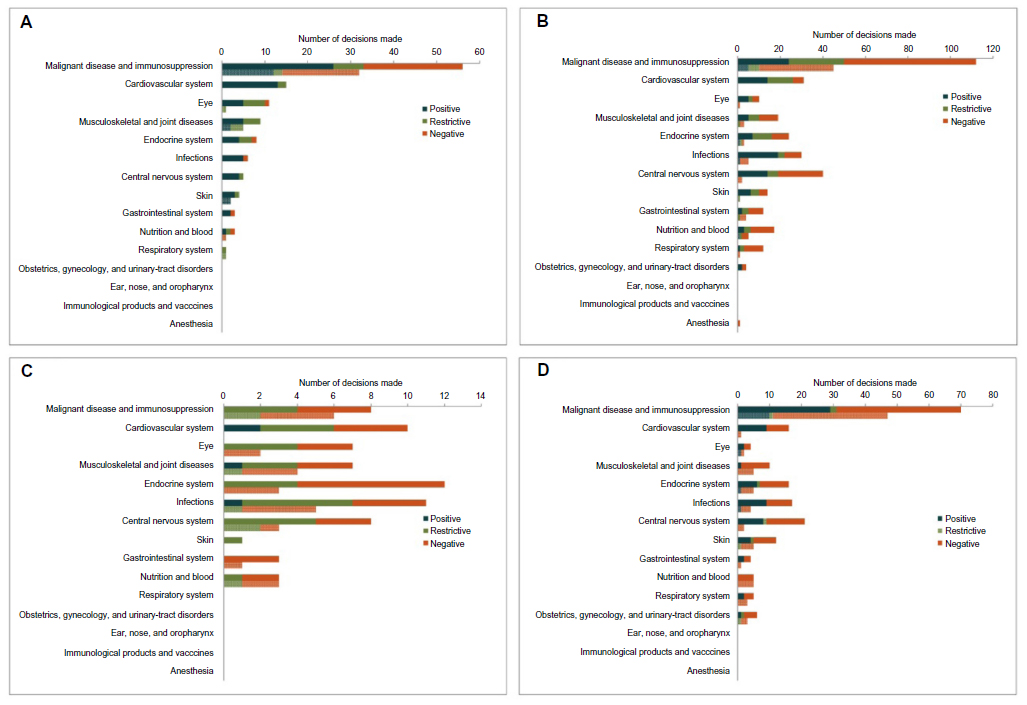 | Figure 2 HTA submission outcomes by disease area, for total submissions (top, darker bars) and submissions with ICERs higher than the threshold (bottom, lower bars). |
SMC
As for NICE, malignant disease and immunosuppression accounted for the majority of SMC submissions overall as well as submissions with ICERs higher than the £30,000 cost-effectiveness threshold (Figure 2B). However, the rejection rate was higher than for NICE, regardless of disease area or ICER threshold compliance.
CADTH
CADTH does not typically assess oncologics, which was reflected in the low number of submissions in the malignant disease and immunosuppression disease category. Notable for CADTH was the high proportion of restricted submissions regardless of disease area; few submissions were accepted unconditionally (Figure 2C).
PBAC
Following the trend for NICE and SMC, the majority of PBAC submissions (overall as well as submissions with ICERs higher than the AUS$42,000 cost-effectiveness threshold) fell into the malignant disease and immunosuppression category. There were no notable disease-area specific variations in acceptance or rejection rates (Figure 2D).
Pooled analysis
Finally, the results across all agencies were pooled to determine whether submissions in some disease areas were more likely to be accepted with above-threshold ICERs than in other disease areas.
Based on the outputs of a funnel plot with limits ±3 SE of the mean, there was no significant difference in acceptance rates between disease areas compared with the average acceptance rate of 29%, for submissions with ICERs higher than the threshold (Figure 3). The funnel plot shows decisions for each BNF category plotted with the number of decisions above the standard threshold across the x-axis and the percentage successful on the y-axis. Confidence intervals ±3 SEs of the mean (~99% confidence interval) are plotted to help the reader see the variability that might be expected by chance. The fact that the rates we observe fall within these lines indicates that the results are unsurprising.
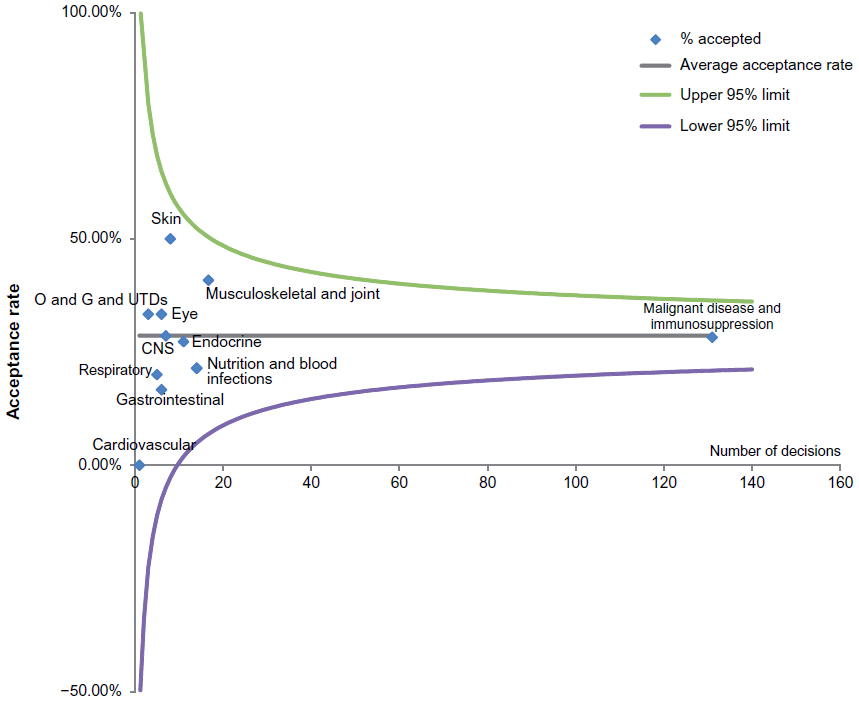 | Figure 3 Funnel plot demonstrating difference in acceptance rates for submissions with ICERs higher than the threshold for different disease areas. |
A chi-square test was also carried out on this data set to test any differences in acceptance rates by disease area. The chi-square test of these data produced a P-value of 0.967 (χ2=4.093, df =11) (Table S3); therefore, the hypothesis that differences in the proportion of decisions accepted above the threshold are purely due to sampling error cannot be rejected.
Discussion
The aim of this study was to evaluate the prevalence of submissions to different HTA agencies that are accepted with ICERs higher than the threshold and investigate any variation by disease area. We found that, overall, over a quarter of submissions with ICERs higher than the threshold were given a positive reimbursement submission; however, 42% of these submissions were restricted in their use within the relevant health system. In cases where submissions were accepted unconditionally, a strong evidence base and convincing argument was required to warrant a positive decision. A key finding was that a large number of submissions with ICERs higher than the threshold fell into the malignant disease and immunosuppression category; however, submissions in this disease category were not more likely to be accepted than submissions in other disease areas (based on the outputs of the funnel plot and chi-square test).
Why are submissions accepted with ICERs higher than the cost-effectiveness threshold?
The concept of the ICER puts in place a threshold for cost-effectiveness, which is necessary to ensure that adequate health gains can be obtained within the fixed budget of a health care system.1,8 For new technologies to effectively bypass this system by being accepted with higher ICERs, it can be assumed that there are additional criteria in place.
Some HTA agencies focus only on clinical effectiveness, and do not consider cost-effectiveness.10 While the agencies included in this analysis all use cost-effectiveness criteria to inform decision-making, in-depth review of individual submissions suggests that demonstration of clinical benefit can be a contributing factor to the acceptance of submissions for which standard cost-effectiveness criteria are not met.11–13 Examples of a strong clinical evidence base in such cases include positive head-to-head trial evidence against a relevant comparator or adjusted indirect comparison with low levels of uncertainty and bias, and/or a clearly defined improvement in treatment effect.8 Previous research has also suggested that the number of randomized trials can strengthen the clinical evidence from the perspective of HTA agencies.14
Additionally, unmet therapeutic needs and lack of alternative options can override ICER thresholds. Under the value-based pricing framework proposed in the UK, assessments would be formally weighted by criteria, including level of unmet need and the wider societal benefit.15 Considering that value-based pricing proposals have been heavily criticized and stalled,16–18 it is interesting to note that these criteria are already informally incorporated into the decision-making process in several markets.
Another priority is orphan drug designation. Due to the need of manufacturers to recover development costs in indications with small patient numbers, orphan drugs tend to be more expensive than therapies in more prevalent disease areas.5 As a result, orphan drugs do not usually meet standard cost-effectiveness criteria, and reported ICERs in manufacturers’ reimbursement submissions are often higher than the market’s willingness-to-pay (WTP) threshold.5,6 To mitigate these challenges, HTA agencies may consider higher WTP thresholds for orphan drugs, though no formal threshold or process exists.19 The results of our research support the theory that orphan drugs may have higher WTP thresholds, as several submissions with higher-than-threshold ICERs were accepted on the basis of meeting orphan drug criteria. Further research is warranted to characterize the potential ICER allowance for orphan drugs.
The wider societal view in respect to end-of-life therapies should also be considered. It is recognized that society values the humanistic appeal of life-extending therapies, and NICE has published specific guidance on appraising end-of-life drugs.7 Although end-of-life therapies were not considered in this analysis as such, many of these would have fallen into the malignant disease and immunosuppression disease category. Interestingly, while a large number of these submissions reported ICERs higher than the threshold, the proportion of accepted submissions in this category did not differ significantly to that in other disease areas, based on the outputs of the funnel plot and chi-square test. These findings do not support the theory that end-of-life drugs have higher ICER thresholds; however, not all cancer drugs are considered end-of-life therapies, and these criteria can be met by drugs in other indications. Therefore, further research into the effect of end-of-life criteria on ICER thresholds would be informative in this respect.
Why are acceptance rates variable between HTA agencies?
Acceptance of above-threshold ICER technologies varies from country to country, highlighting the differing approaches each country takes to adopting new technologies.
NICE accepted the highest proportion of submissions with ICERs higher than the threshold out of all the HTA agencies. This is likely to be due to the selective nature of NICE appraisals,20 with horizon scanning potentially acting as an early bottleneck for technologies unlikely to be accepted. Other HTA agencies adopt the approach of evaluating a larger range of potential technologies, with the result that the rejection rate is higher. Another potential reason for the high rate of recorded acceptance is that NICE considers a wider range of criteria than other agencies. For example, NICE recognizes the innovative nature of technologies and makes allowances for end-of-life drugs, whereas other HTA agencies may not.8 It has also been suggested that patient group submissions, the number of randomized trials, and the number of systematic reviews supporting NICE submissions can positively affect the appraisal outcome.14 A further reason for the higher acceptance rate may be the fact that NICE’s formal cost-effectiveness threshold is in fact lower than the threshold applied in practice; previous modeling of NICE decisions has suggested an ICER threshold closer to the range of £35,000–£40,000.21
The acceptance rate for SMC was lower than for NICE, both overall and for submissions with ICERs higher than the threshold. This is likely to partly reflect differences in the volume of drugs being appraised, as SMC considers all health technologies for appraisal while NICE considers only a selection.20,22 Nevertheless, the fact that SMC approves a smaller proportion of technologies with ICERs above £30,000 than NICE does implies a lower willingness-to-pay for such interventions. This should be considered by manufacturers when seeking reimbursement in the UK.
CADTH did not unconditionally accept any submissions with ICERs higher than the threshold, instead placing restrictions on all such submissions that gained a positive reimbursement decision. The reason for the high rate of restriction remains unclear, though CADTH also restricts a high proportion of submissions overall. Previous research in this area has highlighted clinical and economic uncertainty, as well as nonrelevant clinical endpoints as negative drivers of CADTH decisions.23 In addition, CADTH does not tend to assess oncologics, which are instead evaluated under the pan-Canadian Oncology Drug Review, and this may have affected the recorded acceptance rates.24
PBAC rejected the highest proportion of higher-than-threshold ICER submissions overall, but accepted more drugs unconditionally than CADTH or SMC. It has been suggested that clinical significance, clinical and economic uncertainty, relevance of endpoints, indication (specifically, drugs for life-threatening conditions), and cost to government (in terms of financial impact) can affect the likelihood of acceptance of PBAC submissions, in addition to cost-effectiveness criteria,23,25–27 which may influence the decision-making process.
Strengths, limitations, and scope for further research
This study incorporated the decisions made by multiple HTA agencies in the analysis, which allowed for direct comparison of reimbursement trends across different markets. Further investigation across additional HTA agencies could help expand the context of the results detailed here. Similarly, more detailed comparisons between HTA agencies, perhaps in relation to individual products, would yield more information on some of the nuances of HTA decision-making when it comes to above-threshold ICER submissions.
The limitations of the analysis primarily surround uncertainty in the definition of the ICER threshold. Different ICER thresholds for orphan drugs and therapies meeting end of life criteria were not considered; although such drugs may have higher WTP thresholds,19 these are neither defined in the literature nor by HTA agencies. In addition, reporting of multiple ICERs for some submissions made selection of the appropriate base-case ICER difficult in some cases. Further, the “ICER threshold” itself is not a concrete concept; in reality, ranges are more likely to be applied.21 For example, NICE formally uses a threshold range of £20,000– £30,000 per QALY,8 (and in practice, this threshold range may be even higher21) and formal thresholds for other agencies are not usually published. The results are therefore sensitive to the assumed ICER thresholds. In light of this, reasons for differences between HTA acceptance rates must be contextualized. The application of different assumed ICER thresholds to the analysis would certainly affect the results presented here, and this limits the potential for objective comparisons between HTA agencies.
The rationale for acceptance in the submissions extracted was not quantified, as it proved difficult to objectively categorize decision drivers. In reality, a wide range and combination of reasons will contribute to the overall appraisal outcome, which will be specific to the treatment landscape of the technology being appraised as well as agency-specific criteria and policies. Further, HTA agencies vary in the level of detail included in their publically available summary documents for each appraisal, and so extraction of such information is a subjective exercise that is unlikely to capture all of the decision drivers behind acceptance. Nevertheless, such information would be informative to manufacturers seeking acceptance of technologies with high ICERs in order to best demonstrate their value, and therefore further research beyond the exploratory analysis detailed in Table S1 is warranted.
No significant differences in acceptance rates of submissions with ICERs higher than the threshold by disease area were observed in the pooled analysis, based on the funnel plot and chi-square test output. This outcome may have been skewed by the large number of submissions with higher-than-threshold ICERs in the malignant disease and immunosuppression category, compared with other disease categories where low numbers of submissions were recorded. We cannot prove that there is no difference present, just that it is not sufficiently large to be considered surprising. There are, however, marked differences in the number of decisions across BNF categories, and some of the cells in the chi-square analysis had a small number of decisions in them. Nevertheless, the results do appear to be robust to distributional assumptions, and the expected values are very close indeed to those observed. More granular analysis or use of a disease classification method other than BNF categories could help to further inform differences in disease area-specific trends.
Conclusion
While the submitted ICER is the most influential factor in the HTA decision-making process in the four HTA agencies evaluated, additional criteria are important in determining the success or failure of a submission. Differing criteria of HTA bodies should be considered, as well as the nature of the technology being appraised. Nevertheless, submissions reporting a higher-than-threshold base-case ICER must be supported by transparent, robust, and concrete evidence in order to achieve patient access.
Acknowledgment
We would like to thank Michael Tang for his help reviewing this manuscript.
Funding
Elizabeth Griffiths, Janek Hendrich, Samuel Stoddart, and Sean Walsh were employed by HERON™ Commercialization at the time of writing this manuscript, and HERON™ Commercialization provided support in the form of salaries for all authors. Although HERON™ Commercialization played a role in the study through the participation of the authors listed above, the authors maintained scientific control over the study, including final study design, data collection, and analysis. All authors were involved in the preparation of the manuscript and jointly made the decision to publish.
Disclosure
Elizabeth Griffiths, Janek Hendrich, Samuel Stoddart, and Sean Walsh were employed by HERON™ Commercialization at the time of writing this manuscript. There are no patents, products in development or marketed products to declare. This does not alter the adherence to any policies on sharing data and materials. The authors report no other conflicts of interest in this work.
References
Drummond M, Sculpher M, Torrance G, O’Brien B, Stoddart G. Methods for the Economic Evaluation of Health Care Programmes. 3rd ed. Oxford, UK: Oxford University Press; 2005. | |
HTAGlossary.net. Health Technology Assessment (HTA). Available from: http://htaglossary.net/health+technology+assessment+(HTA). Accessed December 17, 2014. | |
Simoens S. How to assess the value of medicines? Front Pharmacol. 2010;1:115. | |
Orphanet. About orphan drugs. Available from: http://www.orpha.net/consor/cgi-bin/Education_AboutOrphanDrugs.php?lng=EN. Accessed February 5, 2015. | |
Drummond M. Challenges in the economic evaluation of orphan drugs. Eurohealth. 2008;14(2):16–17. | |
Hughes-Wilson W, Palma A, Schuurman A, Simoens S. Paying for the orphan drug system: break or bend? Is it time for a new evaluation system for payers in Europe to take account of new rare disease treatments? Orphanet J Rare Dis. 2012;7:74. | |
NICE. Appraising life-extending, end of life treatments 2009. Available from: http://www.nice.org.uk/guidance/gid-tag387/resources/appraising-life-extending-end-of-life-treatments-paper2. Accessed December 4, 2014. | |
NICE. Guide to the methods of technology appraisal 2013. Available from: http://www.nice.org.uk/article/pmg9/chapter/foreword. Accessed December 10, 2014. | |
George B, Harris A, Mitchell A. Cost-effectiveness analysis and the consistency of decision making: evidence from pharmaceutical reimbursement in Australia (1991 to 1996). Pharmacoeconomics. 2001; 19(11):1103–1109. | |
International Society for Pharmacoeconomics and Outcomes Research. ISPOR Global Health Care Systems Road Map. Available from: http://www.ispor.org/HTARoadMaps/Default.asp. Accessed December 4, 2014. | |
SMC. Carglumic acid 200mg dispersible tablets (Carbaglu) No 299/06. Available from: http://www.scottishmedicines.org.uk/files/carglumic_acid_200mg_Carbaglu_299_06.pdf. Accessed February 10, 2015. | |
PBAC. Everolimus, tablets, 2.5 mg, 5 mg and 10 mg, Afinitor® – April 2013. Available from: http://www.pbs.gov.au/info/industry/listing/elements/pbac-meetings/psd/2013-04/everolimus. Accessed February 10, 2015. | |
CADTH. CEDAC final recommendation for sunitinib (Sutent™). Available from: http://www.cadth.ca/media/cdr/complete/cdr_complete_Sutent_March-28-07.pdf. Accessed February 10, 2015. | |
Dakin HA, Devlin NJ, Odeyemi IA. “Yes”, “No” or “Yes, but”? Multinomial modelling of NICE decision-making. Health Policy. 2006;77:352–367. | |
Department of Health. A new value-based approach to the pricing of branded medicines – a consultation. Available from: http://www.dhsspsni.gov.uk/medicineconsultation.pdf. Accessed December 4, 2014. | |
Nature News Blog. UK backs away from ‘value-based pricing’ for drugs. Available from: http://blogs.Nature.com/news/2013/11/uk-backs-away-from-value-based-pricing-for-drugs.html. Accessed June 24, 2015. | |
NICE Decision Support Unit, Miners A, Cairns J, Wailloo A. Department of Health proposals for including wider societal benefits into value based pricing: a description and critique. Available from: http://www.nice.org.uk/Media/Default/About/what-we-do/NICE-guidance/NICE-technology-appraisals/DSU-Wider-Societal-Benefits-Briefing-Paper.pdf. Accessed June 24, 2015. | |
Linley WG, Hughes DA. Societal views on NICE, cancer drugs fund and value-based pricing criteria for prioritising medicines: a cross-sectional survey of 4118 adults in Great Britain. Health Econ. 2013;22:948–964. | |
Vegter S, Rozenbaum MH, Postema R, Tolley K, Postma MJ. Review of regulatory recommendations for orphan drug submissions in the Netherlands and Scotland: focus on the underlying pharmacoeconomic evaluations. Clin Ther. 2010;32(9):1651–1661. | |
NICE. Guide to the processes of technology appraisal 2014. Available from: http://www.nice.org.uk/article/pmg19/chapter/Acknowledgements. Accessed December 4, 2014. | |
Devlin N, Parkin D. Does NICE have a cost-effectiveness threshold and what other factors influence its decisions? A binary choice analysis. Health Econ. 2004;13:437–452. | |
SMC. Scottish Medicines Consortium: What we do (remit). Available from: http://www.scottishmedicines.org.uk/About_SMC/What_we_do/Remit. Accessed December 4, 2014. | |
Clement FM, Harris A, Li JJ, Yong K, Lee KM, Manns BJ. Using effectiveness and cost-effectiveness to make drug coverage decisions: a comparison of Britain, Australia, and Canada. JAMA. 2009;302:1437–1443. | |
CADTH. Procedure for the CADTH Common Drug Review. Available from: http://www.cadth.ca/media/cdr/process/CDR_Procedure.pdf. Accessed December 4, 2014. | |
Harris AH, Hill SR, Chin G, Li JJ, Walkom E. The role of value for money in public insurance coverage decisions for drugs in Australia: a retrospective analysis 1994–2004. Med Decis Making. 2008;28(5):713–722. | |
Mauskopf J, Chirila C, Masaquel C, et al. Relationship between financial impact and coverage of drugs in Australia. Int J Technol Assess Health Care. 2013;29:92–100. | |
Chim L, Kelly PJ, Salkeld G, Stockler MR. Are cancer drugs less likely to be recommended for listing by the Pharmaceutical Benefits Advisory Committee in Australia? Pharmacoeconomics. 2010;28:463–475. |
Supplementary materials
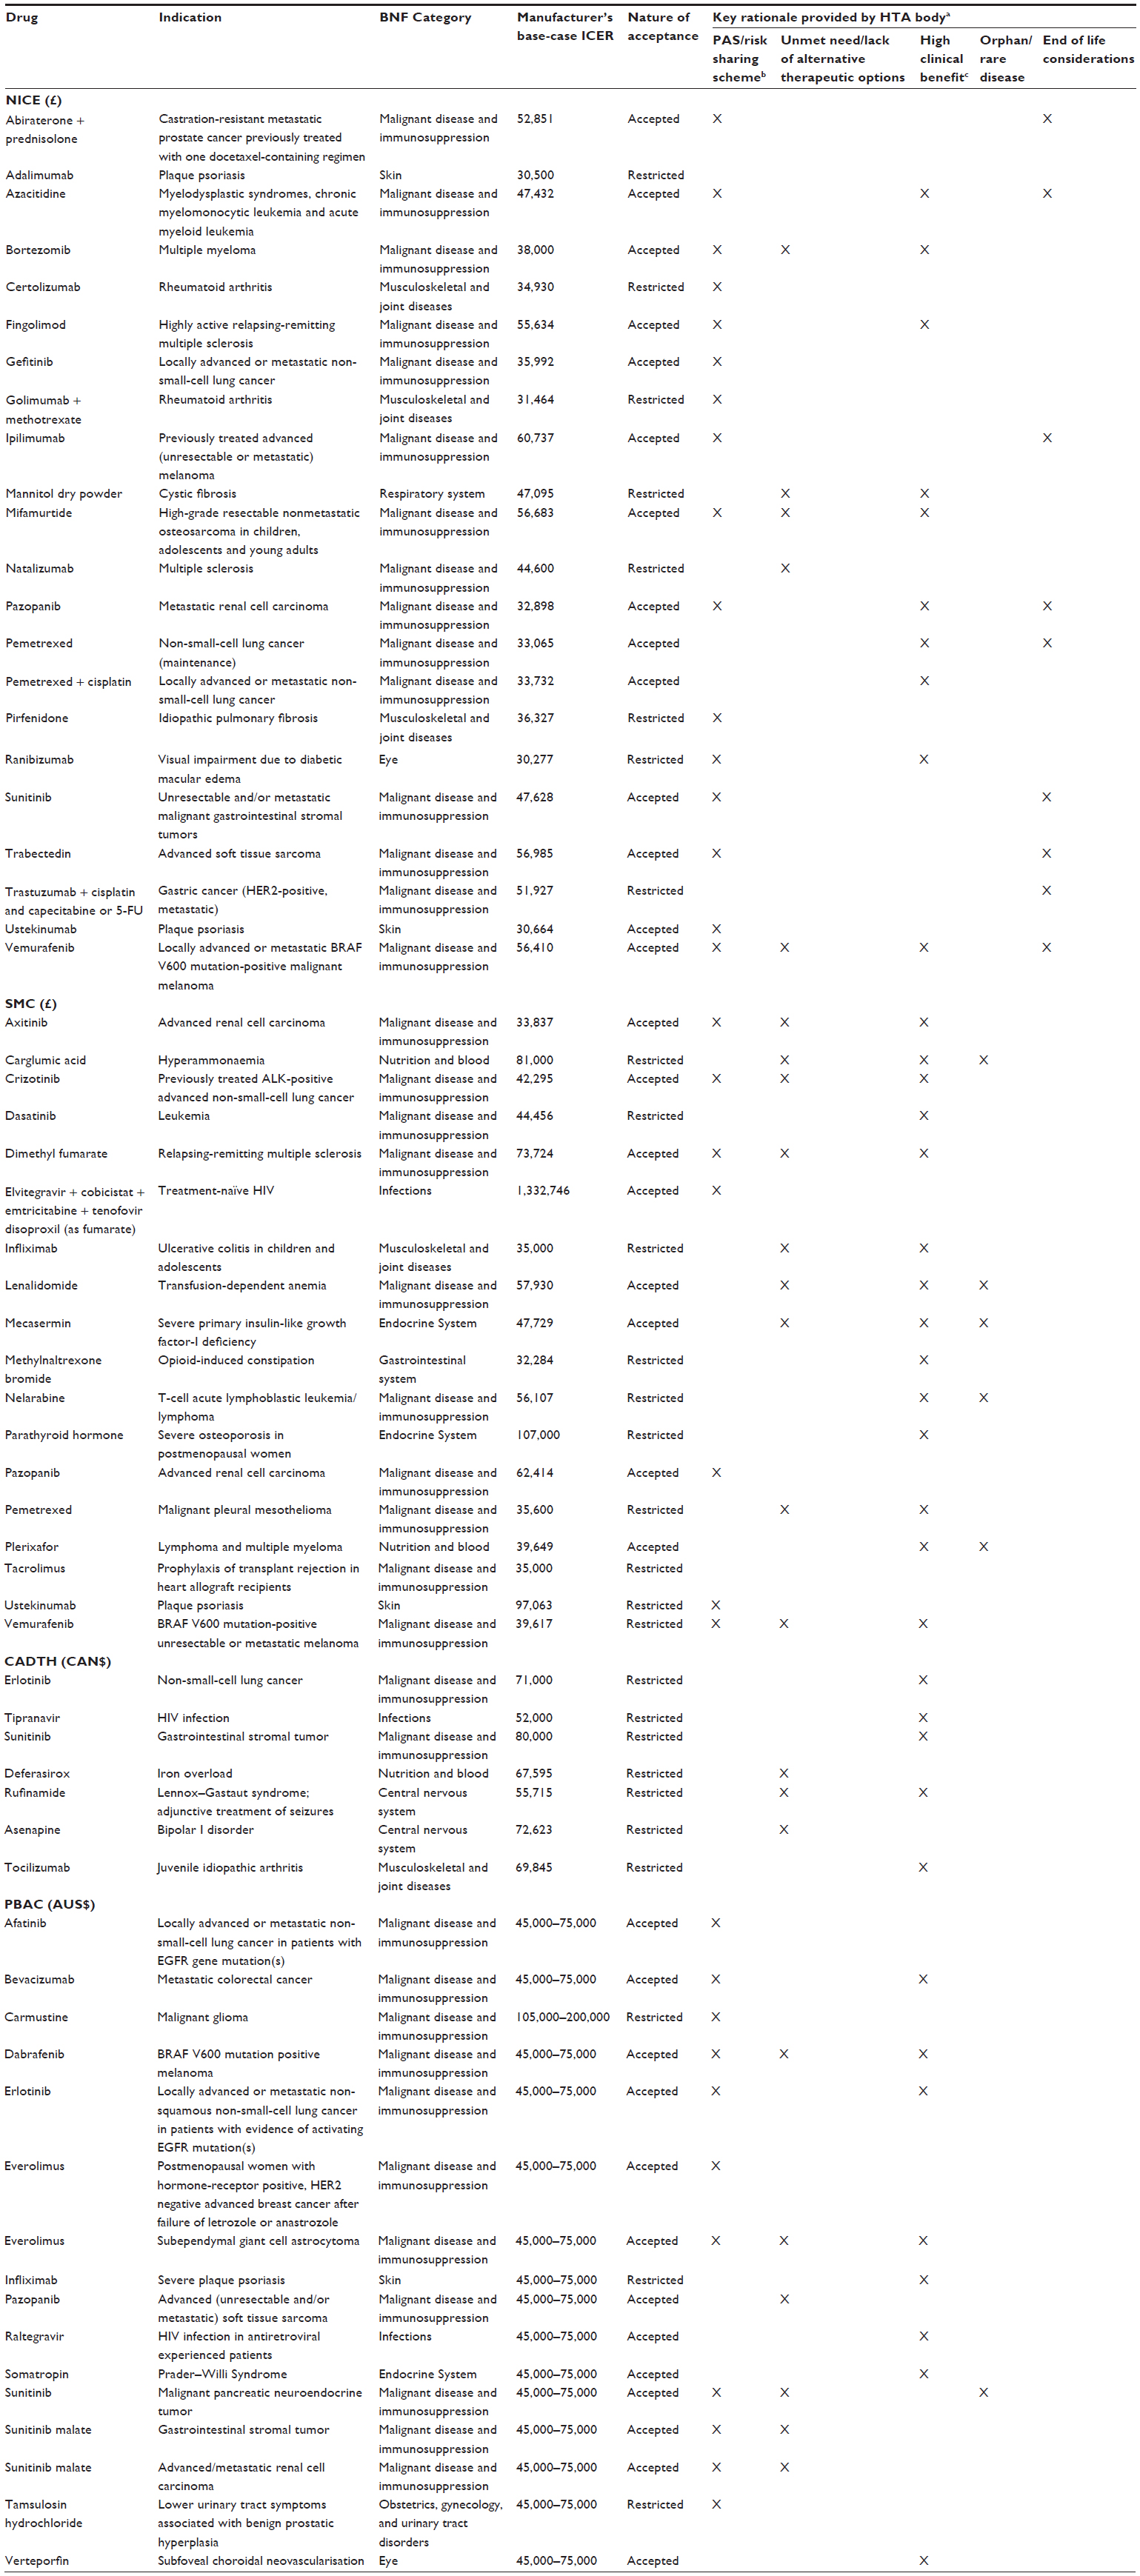 | Table S1 List of all submissions that were accepted with ICERs higher than the threshold, by HTA agency |
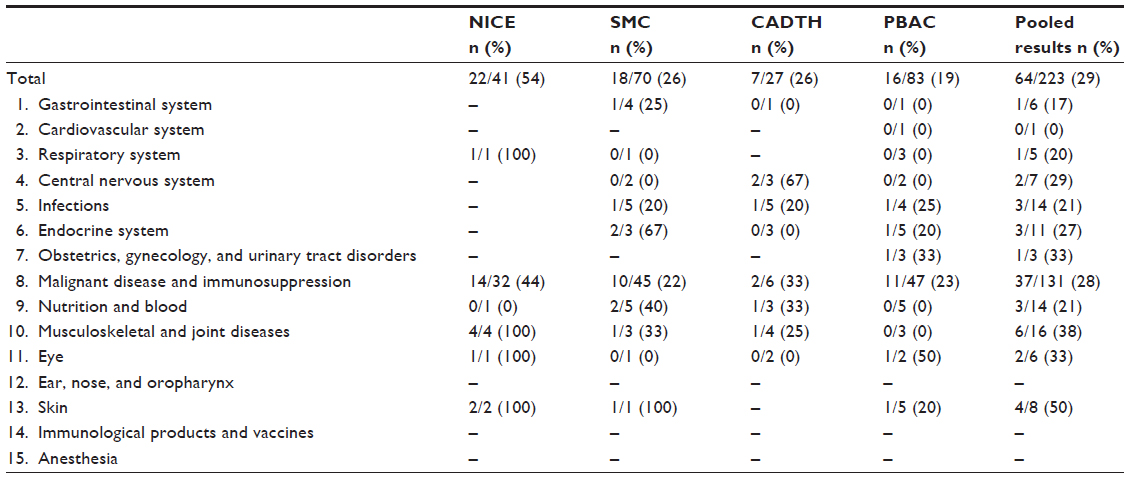 | Table S2 Acceptance of submissions with ICERs higher than the threshold by disease area |
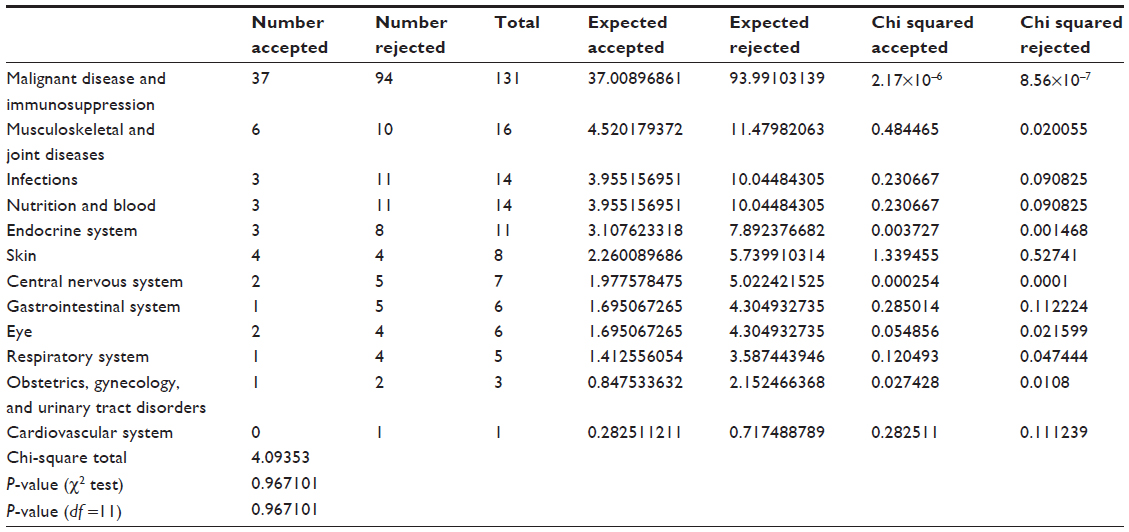 | Table S3 Chi-square test “Is there evidence that acceptance rates above the accepted thresholds are higher for some therapeutic areas than for others?” |
 © 2015 The Author(s). This work is published and licensed by Dove Medical Press Limited. The
full terms of this license are available at https://www.dovepress.com/terms
and incorporate the Creative Commons Attribution
- Non Commercial (unported, 3.0) License.
By accessing the work you hereby accept the Terms. Non-commercial uses of the work are permitted
without any further permission from Dove Medical Press Limited, provided the work is properly
attributed. For permission for commercial use of this work, please see paragraphs 4.2 and 5 of our Terms.
© 2015 The Author(s). This work is published and licensed by Dove Medical Press Limited. The
full terms of this license are available at https://www.dovepress.com/terms
and incorporate the Creative Commons Attribution
- Non Commercial (unported, 3.0) License.
By accessing the work you hereby accept the Terms. Non-commercial uses of the work are permitted
without any further permission from Dove Medical Press Limited, provided the work is properly
attributed. For permission for commercial use of this work, please see paragraphs 4.2 and 5 of our Terms.