Back to Journals » Neuropsychiatric Disease and Treatment » Volume 14
Aberrantly expressed long noncoding RNAs and genes in Parkinson's disease
Authors Zhou Y, Gu C, Li J, Zhu L ![]() , Huang G, Dai J
, Huang G, Dai J ![]() , Huang H
, Huang H
Received 29 June 2018
Accepted for publication 3 October 2018
Published 22 November 2018 Volume 2018:14 Pages 3219—3229
DOI https://doi.org/10.2147/NDT.S178435
Checked for plagiarism Yes
Review by Single anonymous peer review
Peer reviewer comments 2
Editor who approved publication: Dr Yu-Ping Ning
Yong Zhou, Chengzhi Gu, Jia Li, Lianhai Zhu, Guoxiang Huang, Jie Dai, Huaiyu Huang
Department of Neurology, The Second Affiliated Hospital of Nantong University, The First People’s Hospital of Nantong, Nantong, China
Purpose: Parkinson’s disease (PD) is a common neurodegenerative movement disorder, but the pathogenesis remains elusive. This study was aimed to explore key genes and long noncoding RNAs (lncRNAs) associated with PD.
Materials and methods: Three patients with PD and three normal controls were enrolled in the present study from July 12, 2017, to August 29, 2017. RNA sequencing and bioinformatics analysis were performed to obtain differentially expressed micro RNAs (DEmRNAs) and lncRNAs (DElncRNAs) between patients with PD and normal controls. PD-specific protein–protein interaction networks were constructed. DEmRNAs transcribed within a 100 kb window upstream or downstream of DElncRNAs were searched, which were defined as cis nearby targeted DEmRNAs of DElncRNAs. Datasets GSE57475 and GSE68719 were downloaded from the Gene Expression Omnibus database, which were used to validate the expression of selected DEmRNAs.
Results: A total of 857 DEmRNAs and 77 DElncRNAs were obtained between PD and normal controls. Natural killer cell-mediated cytotoxicity was a significantly enriched pathway in PD. ERBB2, HSPB1, and MYC were three hub proteins of PD-specific protein–protein interaction network. LOC105378701-TAL1, LOC102724104-CX3CR1, LOC105375056-TREML1/TREML4, LOC105379392-ANK1, and LOC101928100-KLRK1/KLRD1 interactions were identified DElncRNA nearby targeted DEmRNA pairs in PD. Gene expression results validated by GSE57475 and GSE68719 were consistent with our RNA-sequencing results, generally.
Conclusion: This present study identified key genes and lncRNAs associated with PD, which will provide new clues for exploring the pathogenesis and developing potential biomarkers of PD.
Keywords: RNA-sequencing, mRNA, bioinformatics analysis, protein–protein interaction network
Introduction
As a common neurodegenerative movement disorder, Parkinson’s disease (PD) is characterized by slowness of movement, rigidity, postural instability, and resting tremor.1 These clinical manifestations were resulted from progressive loss of dopamine producing neurons in the substantia nigra pars compacta and widespread intracellular aggregation of the protein alpha-synuclein, the principal component of the pathological hallmark of PD, Lewy bodies.2 Despite the increasing efforts for exploring the etiology of PD, the exact pathology of PD was not fully defined.
Long noncoding RNAs (lncRNAs) are non-protein-coding transcripts over 200 nucleotides bases long. Recently, accumulated evidences have emphasized the importance of lncRNAs in brain function and central nervous system (CNS) disorders.2–5 The functions of lncRNAs span from regulating brain evolution and neural development3 to mediating behavioral and cognitive processes.4,5 Moreover, lncRNAs were reported to regulate the transcription of nearby genes with cis-regulatory effects. Up to date, several lncRNAs such as NEAT1, SNHG1, MAPT-AS1, and HOTAIR have been demonstrated to play roles in PD.6–9 Yanxia Fan et al reported differentially expressed genes, ZFAND4, SRMS, UBL4B, PVALB, DIRAS1, PDP2, LRCH1, and MYL4 were potential biomarkers associated with progression rate of PD.10 The study of Jieshan Chi et al suggested that five significantly down-regulated mRNAs (MAPK8, CDC42, NDUFS1, COX4I1, and SDHC) and three significantly down-regulated miRNAs (miR-126-5p, miR-19-3p, and miR-29a-3p), were potentially useful diagnostic markers in clinic.11
In this present study, we identified the differentially expressed lncRNAs (DElncRNAs) and mRNAs (DEmRNAs) between PD and normal controls by RNA sequencing and bioinformatics analysis. Identification of cis nearby targeted DEmRNAs of DElncRNAs and functional annotation of DEmRNAs would facilitate the exploration of the biological functions of DElncRNAs in PD. This study will provide new clues for understanding the pathogenesis and developing potential biomarkers of PD.
Materials and methods
Patients and samples
Three patients with PD and three normal controls were enrolled in the present study from July 12, 2017, to August 29, 2017. PD was diagnosed based on MDS clinical diagnostic criteria.12 Patients with other long-term chronic disease and serious disease were excluded. The details of these patients were as follows: a 54-year-old male with 3 years of slow movement and jitter of left upper limb at Hoehn-Yahr stage 1.5; a 60-year-old male with >4 years of slow movement and progressive hand shaking at Hoehn-Yahr stage 2.5, and a 52-year-old male with >2 years of slow movement and hand shaking at Hoehn-Yahr stage 2.0, respectively. All these patients have no family history of PD. Three normal controls were 65-, 54-, and 53-year old healthy males. All individuals provided signed informed consent for use of their samples in this present study. The present study has been approved by the Ethics Committee of the First People’s Hospital of Nantong.
From each participant, a 2.5 mL peripheral whole blood was collected in PAXgene® RNA blood tubes (PreAnalytiX GmbH, Hombrechtikon, Switzerland) and stored at −80°C prior to processing.
RNA isolation and sequencing
With PAXgene blood RNA kit (PreAnalytiX GmbH, Hombrechtikon, Switzerland), RNA isolation was conducted on the manufacturer’s protocol. By using Nanodrop ND-2000 spectrophotometer (Thermo Fisher Scientific, Inc., Waltham, MA, USA), the concentration and purity of RNA were assessed. The integrity of RNA was assessed via a 2% agarose gel. Agilent 2100 bioanalyzer was used to obtain the RIN values. The criteria for cDNA library construction were as follows: 1) Total RNA >5 μg; 2) concentration of RNA ≥200 ng/mL; 3) OD 260/280 value 1.8–2.2.
Ribosomal RNA was removed with Ribo-Zero Magnetic kit (EpiCentre, Madison, WI, USA). Then, RNA was purified and fragmented into fragments with 140–160 nt. The first cDNA strand was synthesized via RNA fragments primed with random hexamer primers. The second cDNA strand was synthesized with dUTP instead of dTTP. End repair was conducted by using End Repair Enzyme mix (NEB, Ipswich, MA, USA). Subsequently, 3′ end adenylation and adapter ligation were performed. After digesting the second cDNA strand with UNG enzyme (Illumina, Inc., San Diego, CA, USA), PCR was performed for 15 cycles to amplify the libraries. Purification and recovery of libraries were performed by using commercial magnetic beads. Sequencing was performed on the Illumina Hiseq X-ten platform (Illumina, Inc.).
Quality control of raw sequence and mapping of clean reads
By using Base Calling version 0.11.4 (http://www.bioinformatics.babraham.ac.uk/projects/fastqc/),35 the FASTQ sequence data were obtained from the RNA-sequencing data. Reads with low quality (adaptor sequences, sequences with a quality score <20, and sequences with an N base rate of raw reads >10%) were removed with Cutadapt version 1.9.1 (https://cutadapt.readthedocs.io/en/stable/)36 to obtain the clean reads.
Identification of DEmRNAs and DElncRNAs in PD compared with normal controls
TopHat release 2.2.1 (http://tophat.cbcb.umd.edu/)37 was used to align the clean reads with the human reference genome, Ensemble GRCh38.p7 (ftp://ftp.ncbi.nlm.nih.gov/genomes/Homo_sapiens).38 With Cuffquant version 2.2.1 (http://cufflinks.cbcb.umd.edu/),39 expressions of mRNAs and lncRNAs were normalized and outputted. Fragments per Kilobase of exon per million fragments mapped (FPKM) was used to determine the transcription abundance of lncRNAs and mRNAs. With Cuffdiff version 2.2.1 (http://cufflinks.cbcb.umd.edu/),39 FPKM of lncRNAs and mRNAs were calculated. Both DEmRNAs and DElncRNAs were obtained with DESeq2 (http://bioconductor.org/packages/DESeq2/)40 in R version 3.3.3 with P-value <0.05. Hierarchical clustering analyses of DElncRNAs and DEmRNAs were conducted by using R package “pheatmap”.
Functional annotation of DEmRNAs between PD and normal control
Functional annotation, including Gene Ontology (GO) function and Kyoto Encyclopedia of Genes and Genomes (KEGG) pathway enrichment analyses of the DEmRNAs between PD and normal control, was performed using the GeneCoDis3 tool (http://genecodis.cnb.csic.es/analysis).41 False discovery rate (FDR) <0.05 was set as the cutoff for significance.
Protein–protein interaction (PPI) network construction
With the Biological General Repository for Interaction Datasets (BioGrid, http://www.uniprot.org/database/DB-0184),42 top 100 up- and downregulated DEmRNAs were scanned. PPI network was then constructed using Cytoscape software (version 3.3.0, http://www.cytoscape.org)43 in order to further explore the biological functions of the DEmRNAs.
Cis nearby targeted DEmRNAs of the DElncRNAs
To obtain the targeted DEmRNAs of DElncRNAs with cis-regulatory effects, DEmRNAs transcribed within a 100 kb window upstream or downstream of DElncRNAs were searched, which were defined as cis nearby targeted DEmRNAs of DElncRNAs.
Validation in the GEO dataset
GSE57475 and GSE68719 datasets were downloaded from the Gene Expression Omnibus (GEO; https://www.ncbi.nlm.nih.gov/geo/),44 which consisted of 49 patients with PD and 93 normal controls, and 29 patients with PD and 44 normal controls, respectively. The dataset GSE57475 examined the blood sample and GSE68719 examined brain tissue, which were all from USA. The expression patterns of selected DEmRNAs were validated with GSE57475 and GSE68719 datasets.
Results
RNA-sequencing data
Total RNA isolated from each blood sample met the criteria for cDNA library construction and RNA sequencing. After trimming of the raw reads, 6.7 × 10⁷ clean reads were obtained from each blood sample from patients with PD and normal controls. The mapping ratio was calculated following clean reads of each sample aligned to the human reference genome (GRCh38.p7). Mapping ratio of each sample was >84%.
DEmRNAs and DElncRNAs between PD and normal controls
A total of 857 DEmRNAs (304 upregulated and 553 downregulated DEmRNAs) and 77 DElncRNAs (38 upregulated and 39 downregulated DElncRNAs) between PD and normal controls were identified. The top ten up- and downregulated DElncRNAs and DEmRNAs between PD and normal controls are summarized in Tables 1 and 2, respectively. Hierarchical clustering analysis of DElncRNAs and top 100 DEmRNAs is displayed in Figure 1A and B, respectively. Furthermore, all these DElncRNAs were distributed in all chromosomes (chr.), with the exception of chr.15 and chr.16, and DEmRNAs were widely distributed in all chromosomes (Figure 1C).
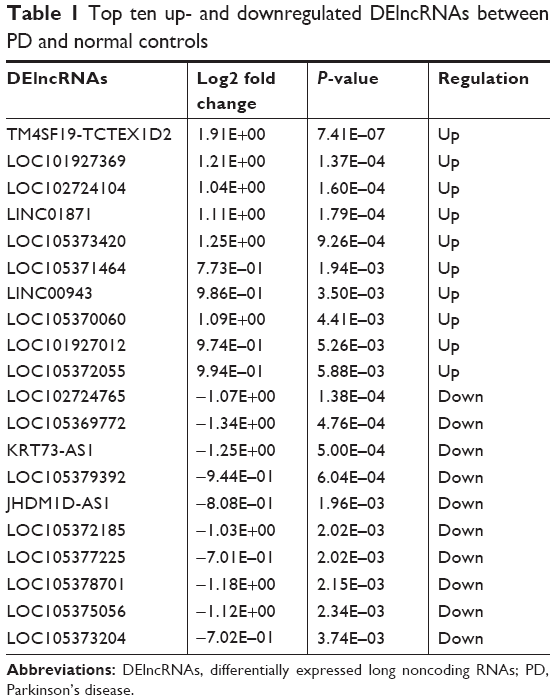 | Table 1 Top ten up- and downregulated DElncRNAs between PD and normal controls |
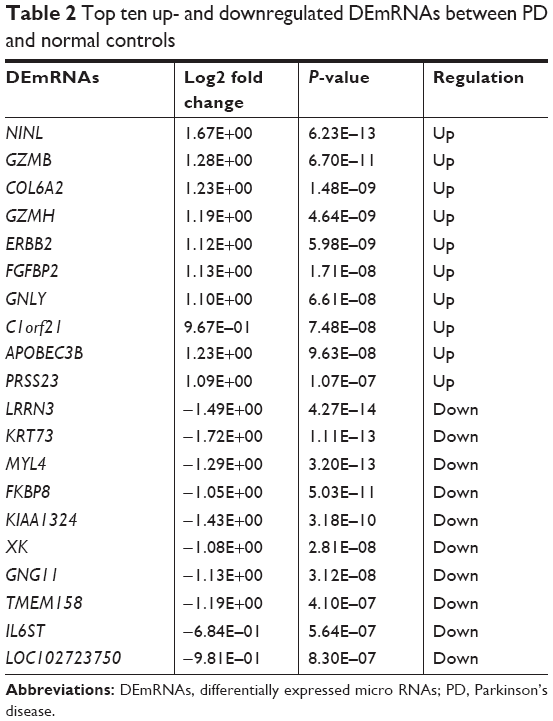 | Table 2 Top ten up- and downregulated DEmRNAs between PD and normal controls |
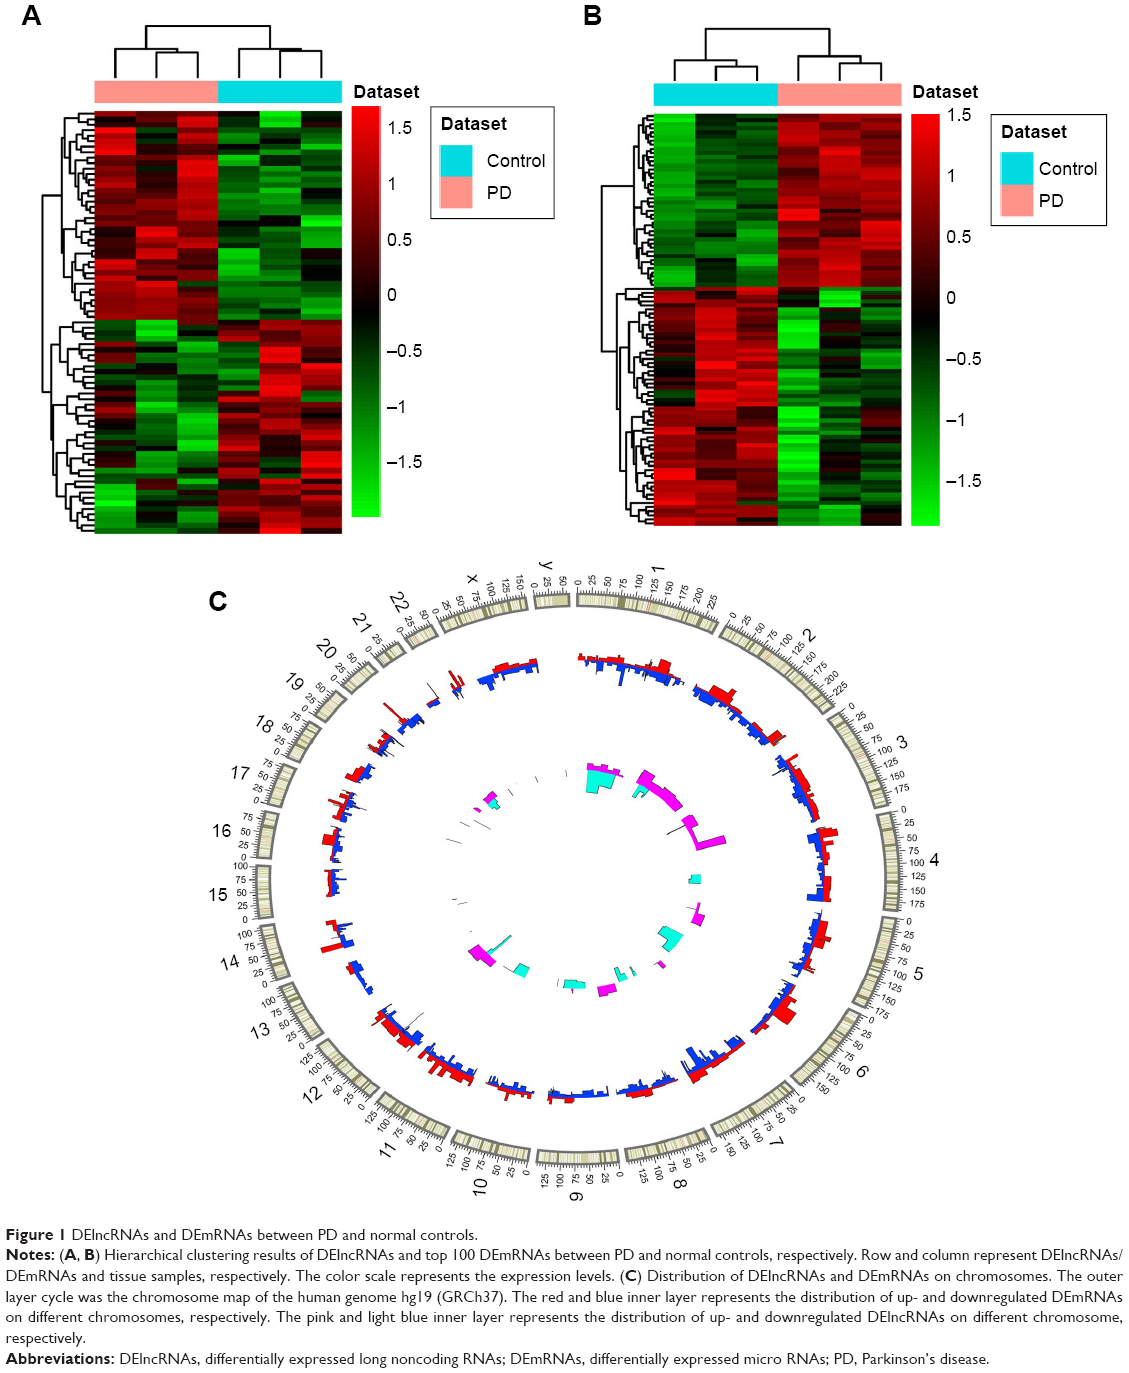 | Figure 1 DElncRNAs and DEmRNAs between PD and normal controls. |
Functional annotation
Blood coagulation (FDR =4.11E–11), platelet activation (FDR =2.55E–09), plasma membrane (FDR =1.48E–11), protein binding (FDR =2.40E–30), and cytoplasm (FDR =2.54E–36) are significantly enriched GO terms in PD (Figure 2A–C). Natural killer cell-mediated cytotoxicity (FDR =2.36E–08), pathways in cancer (FDR =6.82E–06), and protein processing in endoplasmic reticulum (FDR =1.54E–05) are three significantly enriched KEGG pathways in PD (Figure 2D).
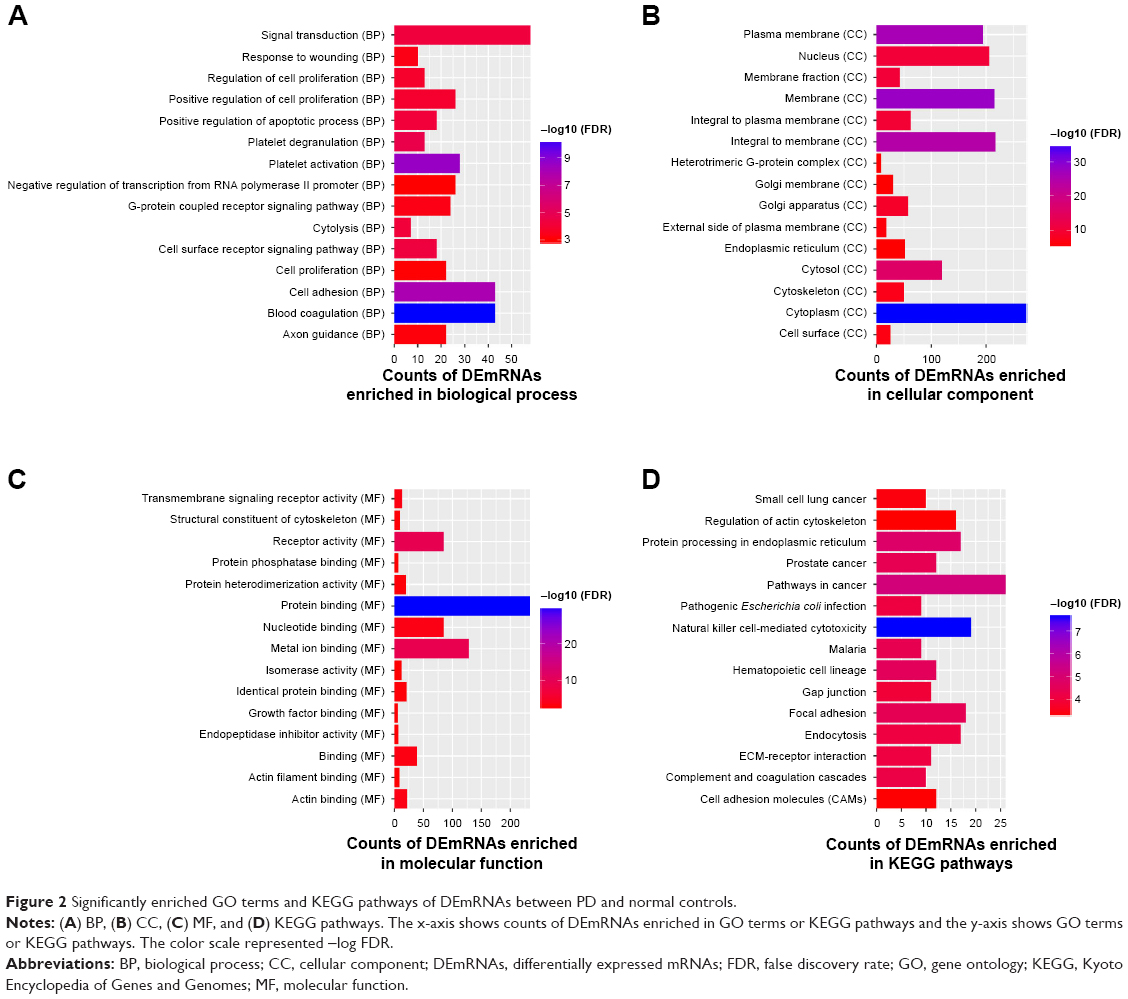 | Figure 2 Significantly enriched GO terms and KEGG pathways of DEmRNAs between PD and normal controls. |
PPI network
The PD-specific PPI network was consisted of 186 nodes and 194 edges. ERBB2 (degree =13), HSPB1 (degree =13), and MYC (degree =11) were three hub proteins of PD-specific PPI network (Figure 3).
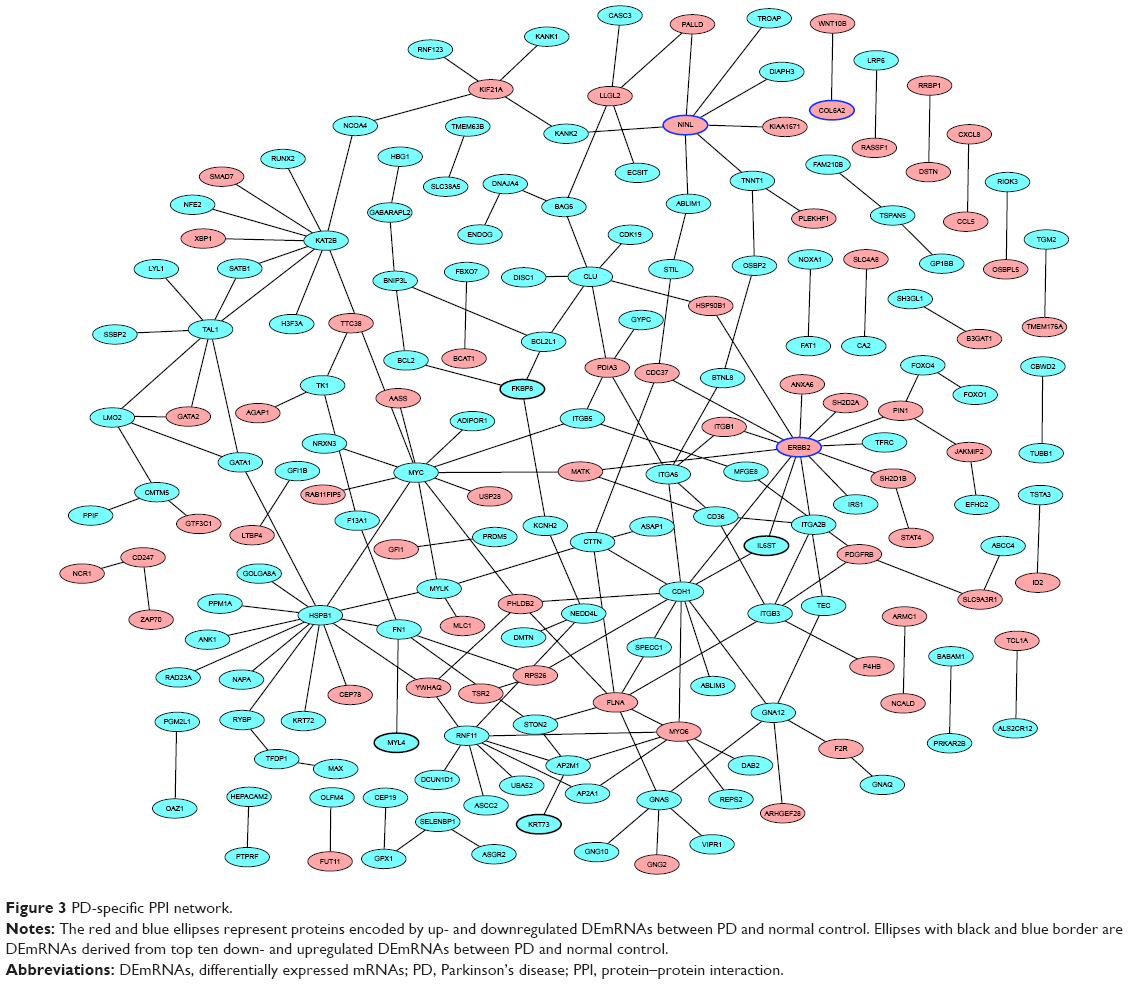 | Figure 3 PD-specific PPI network. |
Cis nearby targeted DEmRNAs of DElncRNAs
A total of 39 DElncRNAs nearby targeted DEmRNA pairs were obtained which was consisted of 28 DElncRNAs and 36 DEmRNAs. LOC105378701-TAL1, LOC102724104-CX3CR1, LOC105375056-TREML1/TREML4, LOC105379392-ANK1, and LOC101928100-KLRK1/KLRD1 interactions were identified DElncRNAs nearby targeted DEmRNA pairs in PD (Table 3).
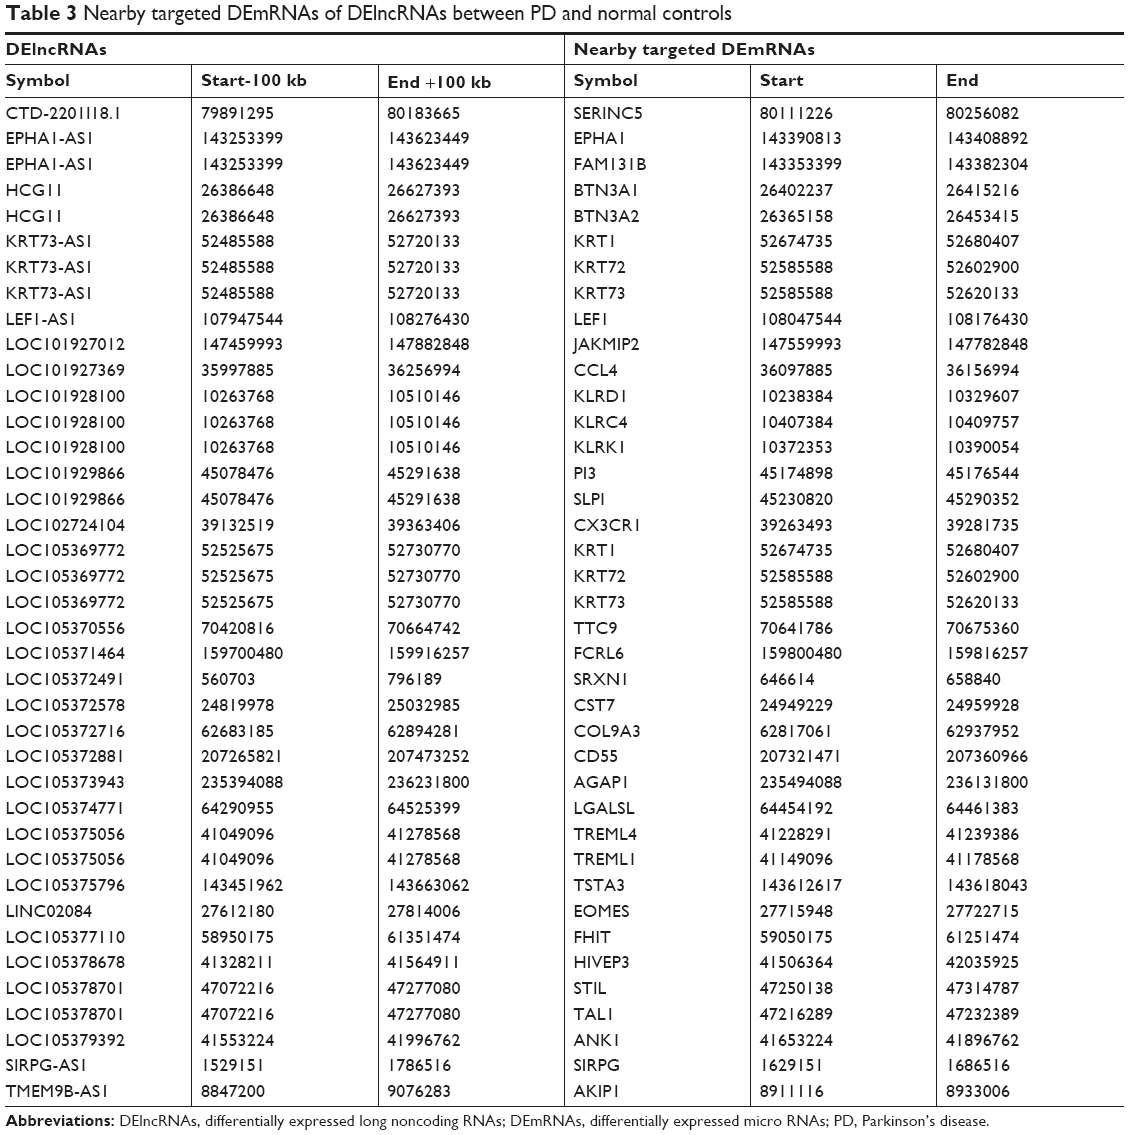 | Table 3 Nearby targeted DEmRNAs of DElncRNAs between PD and normal controls |
Validation in the GEO dataset
The expression patterns of six DEmRNAs including TAL bHLH transcription factor 1 (TAL1), triggering receptor expressed on myeloid cells like 1 (TREML1), triggering receptor expressed on myeloid cells like 4 (TREML4), erb-b2 receptor tyrosine kinase 2 (ERBB2), chemokine (C-X3-C) receptor 1 (CX3CR1) and ankyrin 1 (ANK1) were verified using GSE57475 dataset. As shown in Figure 4, TAL1, TREML1, TREML4, and ANK1 were downregulated while ERBB2 and CX3CR1 were upregulated in PD compared with normal controls, which were consistent with our RNA-sequencing results (Figure 4).
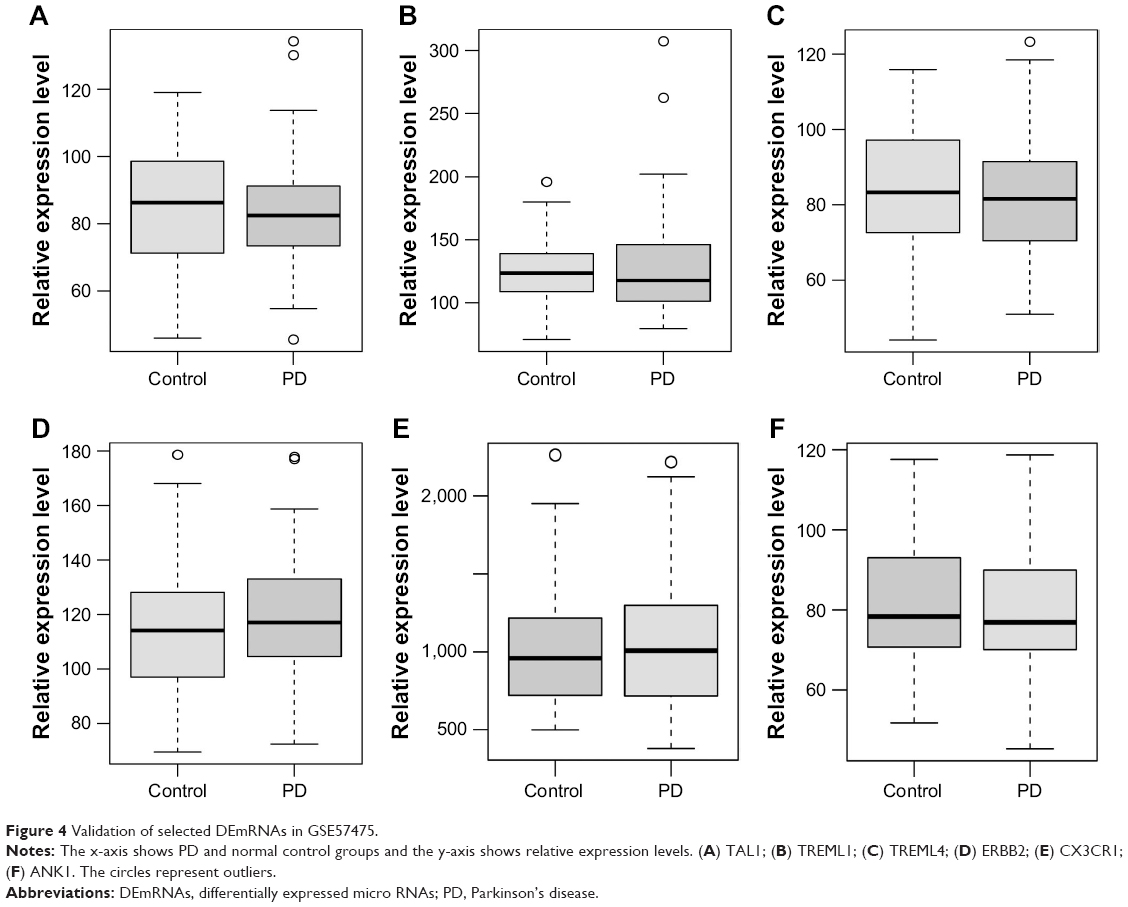 | Figure 4 Validation of selected DEmRNAs in GSE57475. |
In GSE68719 dataset, the expression patterns of ERBB2, CX3CR1, and ANK1 were similar to that in GSE57475, while for TAL1 and TREML1, it displayed the opposite. TREML4 was not found in GSE68719. The result may be due to the difference of the tissue types between GSE57475 and GSE68719. We further determined the expression of killer cell lectin like receptor D1 (KLRD1), a DEmRNA between PD and normal controls, and found that its expression status was consistent with our RNA-sequencing results (Figure 5).
 | Figure 5 Validation of selected DEmRNAs in GSE68719. |
Discussion
Increasing evidences have indicated that lncRNAs play important roles in the pathogenesis of PD.6–9 This present study identified abundant lncRNAs that were differentially expressed between PD and normal controls.
JHDM1D antisense 1 (JHDM1D-AS1) was an lncRNA that arises from the antisense strand of JHDM1D and was downregulated in PD in this present study. In in vitro and in vivo experiments, JHDM1D-AS1 was found to be upregulated in cancer cells and tumor tissues under nutrient starvation, which promotes tumorigenesis by upregulating angiogenesis and triggering inflammation.13 Accumulated evidence indicated that neuroinflammation plays key roles in the pathogenesis of neurodegenerative diseases.14,15 Angiogenesis has been found in various neurodegenerative diseases such as Alzheimer’s disease (AD)16 and PD1 which was speculated to make a contribution for neuroinflammation by failing to protect the parenchyma from peripheral immune cells and inflammatory or toxic factors in the peripheral circulation.1 Hence, we made a hypothesis that JHDM1D-AS1 might be involved with the process of PD by regulating angiogenesis and neuroinflammation. Further experiments are needed to explore the precise role of JHDM1D-AS1 in PD.
However, the biological functions of most identified DElncRNAs between PD and normal control remain unclear. Previous studies indicated that lncRNAs might regulate the expression of their nearby genes by cis-regulatory effects.17 To further research the functions of DElncRNAs in PD, we searched the DEmRNAs transcribed within a 100 kb window upstream or downstream of DElncRNAs which served as cis nearby targeted DEmRNAs of DElncRNAs.
In this present study, downregulated TAL1 was found in PD compared with normal controls, and interacted with seven DEmRNAs of PD. Microglia is essential for innate neuroimmune function and CNS homeostasis, and plays crucial roles in neurodegeneration and brain aging.18 TAL1 is a transcription factor that involves with microglial aging.19 Hence, TAL1 was speculated to play key roles in initiation of PD by regulating many key DEmRNAs between PD and normal controls.20 Additionally, TAL1 was identified to be a nearby targeted DEmRNA of LOC105378701, which suggested that LOC105378701 might involve with PD by regulating the expression of TAL1 with cis effect.
CX3CR1 is a specific receptor of fractalkine (also called CX3CL1) that is exclusively expressed in microglia in the CNS.21 Fractalkine/CX3CR1 signaling plays an inhibitory role in control of microglial inflammatory response.22 Knockout of CX3CR1 was found to exacerbate inflammation and neurodegeneration in a 1-methyl-4-phenyl-1,2,3,6-tetrahydropyridine neurotoxin model of PD.23 Sun et al demonstrated for the first time that CX3CR1 is involved in the neuroinflammatory process in 1-methyl-4-phenylpyridiniumion (MPP+) rat model of PD.24 Both the RNA-sequencing results and our gene expression validation results found that CX3CR1 was upregulated in PD compared with normal control, which emphasized the importance of CX3CR1 in PD. Further research is needed to explore its precise role in PD. Moreover, CX3CR1 was a nearby targeted gene of LOC102724104, which suggested that LOC102724104 might be a potential regulator of PD by regulating CX3CR1.
ERBB2, also known as human epidermal growth factor receptor 2 (HER2), a receptor tyrosine kinase, was originally identified based on its role in cancer research. Wang et al first suggested a link between PD and HER2 polymorphism, and they indicated that different signals or potency of the kinase activities resulting from the Ala1170Pro allele of HER2 may be associated with vulnerability to stress on dopaminergic neurons in PD.25 In this present study, ERBB2 was a hub protein of PD-specific PPI network. Moreover, ERBB2 was a nearby targeted gene of LOC105372578, which suggested that LOC105372578 might be a potential regulator of PD by regulating ERBB2.
AD is also a type of neurodegenerative disease. We identified three AD-regulated genes that were differentially expressed between PD and normal control as well.
ANK1 is a known susceptibility gene for type 2 diabetes which was recognized to own some similarities with AD.26 Aberrant methylation and expression of ANK1 were found in AD.27,28 Cortical-specific hypermethylation of ANK1 was robustly associated with AD-related neuropathology.28 Lunnon et al speculated that the brain-expressed ANK1 protein could be associated with pathology of AD by its function on compartmentalization of the plasma membrane.28
The triggering receptors expressed on myeloid (TREM) family is known to play a key role in modulating inflammation in the innate immune response.29 Both TREML1 and TREML4 were reported to be plausible risk genes of AD.30 Reliable expression of TREML1 was found in both cerebellum and temporal cortex of brain.30 Variant of TREM1 (rs6910730) was associated with increased AD pathology burden and increased rate of cognitive decline, independently.31 Moreover, TREML1 was reported to be involved with promoting vascular homeostasis and neuroinflammation that was speculated to be a potential mediator of neuronal protection and injury in AD and possibly other CNS diseases.30
To the best of our knowledge, we first found the downregulation of ANK1, TREML1, and TREML4 in PD compared with normal controls, which might involve with PD as well. Both TREML1 and TREML4 were nearby targeted genes of LOC105375056, and ANK1 was a nearby targeted gene of LOC105379392, which suggested that LOC105375056 and LOC105379392 and their interactions with TREML1/TREML4 or ANK1 might implicate in PD.
In addition, several studies of the familial PD genes had emphasized the importance of RNA metabolism, particularly mRNA translation, in the disease process. Bingwei Lu et al had indicated that several familial PD genes, including LRRK2, PINK1, Parkin, and eIF4G1, have been shown to interact with components of the translation initiation machinery or interact with modulators of the translation initiation process, such as miRNAs and the mTORC1 signaling pathway.32–34 In the future, the research on RNA metabolism in PD needs to be carried more.
According to the KEGG enrichment analysis, natural killer cell-mediated cytotoxicity was a significantly enriched pathway in PD. KLRD1 and killer cell lectin like receptor K1 (KLRK1) were the two DEmRNAs enriched in the pathway of natural killer cell-mediated cytotoxicity, and KLRD1 and KLRK1 were also the nearby targeted DEmRNAs of LOC101928100. These findings suggested the potential roles of LOC101928100 and its interactions with KLRK1/KLRD1 in PD.
Conclusion
Our data showed that an abundant of novel DElncRNAs may be associated with the pathology of PD. lncRNA interaction pairs of JHDM1D-AS1, LOC105378701-TAL1, LOC102724104-CX3CR1, LOC105375056-TREML1/TREML4, LOC105379392-ANK1, and LOC101928100-KLRK1/KLRD1 might involve with PD. Their detailed roles in PD need to be clarified in our future work.
Limitations
The sample size for RNA sequencing in this study was small. Although the validation based on GSE57475 and GSE68719 suggested that our RNA-sequencing results were generally convincing, studies with larger sample size are needed to confirm this conclusion.
Acknowledgments
We thank Beijing Yangshen Bioinformatic Technology for assistance in high-throughput sequencing and data analysis. This study was supported by Nantong people’s livelihood demonstration and promotion project in 2015 (MS32015033).
Disclosure
The authors report no conflicts of interest in this work.
References
Desai Bradaric B, Patel A, Schneider JA, Carvey PM, Hendey B. Evidence for angiogenesis in Parkinson’s disease, incidental Lewy body disease, and progressive supranuclear palsy. J Neural Transm. 2012;119(1):59–71. | ||
Majidinia M, Mihanfar A, Rahbarghazi R, Nourazarian A, Bagca B, Avci ÇB. The roles of non-coding RNAs in Parkinson’s disease. Mol Biol Rep. 2016;43(11):1193–1204. | ||
Qureshi IA, Mehler MF. Emerging roles of non-coding RNAs in brain evolution, development, plasticity and disease. Nat Rev Neurosci. 2012;13(8):528–541. | ||
Cao X, Yeo G, Muotri AR, Kuwabara T, Gage FH. Noncoding RNAs in the mammalian central nervous system. Annu Rev Neurosci. 2006;29:77–103. | ||
Soreq L, Guffanti A, Salomonis N, et al. Long non-coding RNA and alternative splicing modulations in Parkinson’s leukocytes identified by RNA sequencing. PLoS Comput Biol. 2014;10(3):e1003517. | ||
Yan W, Chen ZY, Chen JQ, Chen HM. LncRNA NEAT1 promotes autophagy in MPTP-induced Parkinson’s disease through stabilizing PINK1 protein. Biochem Biophys Res Commun. 2018;496(4):1019–1024. | ||
Chen Y, Lian YJ, Ma YQ, Wu CJ, Zheng YK, Xie NC. LncRNA SNHG1 promotes α-synuclein aggregation and toxicity by targeting miR-15b-5p to activate SIAH1 in human neuroblastoma SH-SY5Y cells. Neurotoxicology. 2018;68:212–221. | ||
Coupland KG, Kim WS, Halliday GM, Hallupp M, Dobson-Stone C, Kwok JB. Role of the long non-coding RNA MAPT-AS1 in regulation of microtubule associated protein tau (MAPT) expression in Parkinson’s disease. PLoS One. 2016;11(6):e0157924. | ||
Liu S, Cui B, Dai ZX, Shi PK, Wang ZH, Guo YY. Long non-coding RNA HOTAIR promotes Parkinson’s disease induced by MPTP through up-regulating the expression of LRRK2. Curr Neurovasc Res. 2016;13(2):115–120. | ||
Fan Y, Xiao S. Progression rate associated peripheral blood biomarkers of Parkinson’s disease. J Mol Neurosci. 2018;65(3):312–318. | ||
Chi J, Xie Q, Jia J, et al. Integrated analysis and identification of novel biomarkers in Parkinson’s disease. Front Aging Neurosci. 2018;10:178. | ||
Postuma RB, Berg D, Stern M, et al. MDS clinical diagnostic criteria for Parkinson’s disease. Mov Disord. 2015;30(12):1591–1601. | ||
Kondo A, Nonaka A, Shimamura T, et al. Long noncoding RNA JHDM1D-AS1 promotes tumor growth by regulating angiogenesis in response to nutrient starvation. Mol Cell Biol. 2017;37(18):e00125-17. | ||
Appel SH. Inflammation in Parkinson’s disease: cause or consequence? Mov Disord. 2012;27(9):1075–1077. | ||
Thome AD, Standaert DG, Harms AS. Fractalkine signaling regulates the inflammatory response in an α-Synuclein model of Parkinson disease. PLoS One. 2015;10(10):e0140566. | ||
Desai BS, Schneider JA, Li JL, Carvey PM, Hendey B. Evidence of angiogenic vessels in Alzheimer’s disease. J Neural Transm. 2009;116(5):587–597. | ||
Ruiz-Orera J, Messeguer X, Subirana JA, Alba MM. Long non-coding RNAs as a source of new peptides. Elife. 2014;3:e03523. | ||
Galatro TF, Holtman IR, Lerario AM, et al. Transcriptomic analysis of purified human cortical microglia reveals age-associated changes. Nat Neurosci. 2017;20(8):1162–1171. | ||
Wehrspaun CC, Haerty W, Ponting CP. Microglia recapitulate a hematopoietic master regulator network in the aging human frontal cortex. Neurobiol Aging. 2015;36(8):2443.e9–2443.e20. | ||
Diao H, Li X, Hu S, Liu Y. Gene expression profiling combined with bioinformatics analysis identify biomarkers for Parkinson disease. PLoS One. 2012;7(12):e52319. | ||
Hughes PM, Botham MS, Frentzel S, Mir A, Perry VH. Expression of fractalkine (CX3CL1) and its receptor, CX3CR1, during acute and chronic inflammation in the rodent CNS. Glia. 2002;37(4):314–327. | ||
Ransohoff RM, Cardona AE. The myeloid cells of the central nervous system parenchyma. Nature. 2010;468(7321):253–262. | ||
Cardona AE, Pioro EP, Sasse ME, et al. Control of microglial neurotoxicity by the fractalkine receptor. Nat Neurosci. 2006;9(7):917–924. | ||
Sun S, Tang HM, Feng Y, et al. New evidences for fractalkine/CX3CL1 involved in substantia nigral microglial activation and behavioral changes in a rat model of Parkinson’s disease. Neurobiol Aging. 2011;32(3):443–458. | ||
Wang V, Chuang TC, Kao MC, Shan DE, Soong BW, Shieh TM. Polymorphic Ala-allele carriers at residue 1170 of HER2 associated with Parkinson’s disease. J Neurol Sci. 2013;325(1–2):115–119. | ||
Jayaraman A, Pike CJ. Alzheimer’s disease and type 2 diabetes: multiple mechanisms contribute to interactions. Curr Diab Rep. 2014;14(4):476. | ||
De Jager PL, Srivastava G, Lunnon K, Burgess J, Schalkwyk LC. Alzheimer’s disease: early alterations in brain DNA methylation at ANK1, BIN1, RHBDF2 and other loci. Nat Neurosci. 2014;17(9):1156–1163. | ||
Lunnon K, Smith R, Hannon E, et al. Methylomic profiling implicates cortical deregulation of ANK1 in Alzheimer’s disease. Nat Neurosci. 2014;17(9):1164–1170. | ||
Ford JW, McVicar DW. TREM and TREM-like receptors in inflammation and disease. Curr Opin Immunol. 2009;21(1):38–46. | ||
Carrasquillo MM, Allen M, Burgess JD, et al. A candidate regulatory variant at the TREM gene cluster associates with decreased Alzheimer’s disease risk and increased TREML1 and TREM2 brain gene expression. Alzheimers Dement. 2017;13(6):663–673. | ||
Replogle JM, Chan G, White CC, et al. A TREM1 variant alters the accumulation of Alzheimer-related amyloid pathology. Ann Neurol. 2015;77(3):469–477. | ||
Lu B, Gehrke S, Wu Z. RNA metabolism in the pathogenesis of Parkinson’s disease. Brain Res. 2014;1584:105–115. | ||
Wu Z, Wang Y, Lim J. Ubiquitination of ABCE1 by NOT4 in response to mitochondrial damage links co-translational quality control to PINK1-directed mitophagy. Cell Metab. 2018;28(1):130.e7–144.e7. | ||
Gehrke S, Wu Z, Klinkenberg M, et al. PINK1 and Parkin control localized translation of respiratory chain component mRNAs on mitochondria outer membrane. Cell Metab. 2015;21(1):95–108. | ||
Langouet-Astrie C, Meinsen A, Grunwald E, Turner S, Enke R. RNA sequencing analysis of the developing chicken retina. Scientific Data. 2016;3:160117. | ||
Martin M. Cutadapt removes adapter sequences from high-throughput sequencing reads. EMBnet J. 2011;17(1). | ||
Kim D, Pertea G, Trapnell C, Pimentel H, Kelley R, Salzberg SL. TopHat2: accurate alignment of transcriptomes in the presence of insertions, deletions and gene fusions. Genome Biology. 2013;14(4):R36. | ||
Church DM, Schneider VA, Graves T, et al. Modernizing Reference Genome Assemblies. Plos Biology. 2011;9(7):e1001091. | ||
Trapnell C, Williams B, Pertea G, et al. Transcript assembly and quantification by RNA-Seq reveals unannotated transcripts and isoform switching during cell differentiation. Nature Biotechnology. 2010;28(5):511–515. | ||
Love MI, Huber W, Anders S. Moderated estimation of fold change and dispersion for RNA-seq data with DESeq2. Genome Biology. 2014;15(12):550. | ||
Tabasmadrid D, Nogalescadenas R, Pascualmontano A. GeneCodis3: a non-redundant and modular enrichment analysis tool for functional genomics. Nucleic Acids Research. 2012;40(Web Server issue):W478–W483. | ||
Stark C, Breitkreutz B, Reguly T, Boucher L, Breitkreutz A, Tyers M. BioGRID: a general repository for interaction datasets. Nucleic Acids Research. 2006;34(Database issue):535–539. | ||
Shannon P, Markiel A, Ozier O, et al. Cytoscape: a software environment for integrated models of biomolecular interaction networks. Genome Research. 2003;13(11):2498. | ||
Edgar R, Domrachev M, Lash A. Gene Expression Omnibus: NCBI gene expression and hybridization array data repository. Nucleic Acids Research. 2002;30(1):207–210. |
 © 2018 The Author(s). This work is published and licensed by Dove Medical Press Limited. The
full terms of this license are available at https://www.dovepress.com/terms
and incorporate the Creative Commons Attribution
- Non Commercial (unported, 3.0) License.
By accessing the work you hereby accept the Terms. Non-commercial uses of the work are permitted
without any further permission from Dove Medical Press Limited, provided the work is properly
attributed. For permission for commercial use of this work, please see paragraphs 4.2 and 5 of our Terms.
© 2018 The Author(s). This work is published and licensed by Dove Medical Press Limited. The
full terms of this license are available at https://www.dovepress.com/terms
and incorporate the Creative Commons Attribution
- Non Commercial (unported, 3.0) License.
By accessing the work you hereby accept the Terms. Non-commercial uses of the work are permitted
without any further permission from Dove Medical Press Limited, provided the work is properly
attributed. For permission for commercial use of this work, please see paragraphs 4.2 and 5 of our Terms.