Back to Journals » Clinical Optometry » Volume 6
A twelve quarter quantitative analysis of ophthalmic drugs prescription-writing by optometrists in the United States
Authors Gonzalez A ![]() , Lakhani R, Bennett N, De Paz C
, Lakhani R, Bennett N, De Paz C
Received 13 November 2013
Accepted for publication 12 December 2013
Published 3 March 2014 Volume 2014:6 Pages 5—10
DOI https://doi.org/10.2147/OPTO.S57497
Checked for plagiarism Yes
Review by Single anonymous peer review
Peer reviewer comments 2
Agustin L Gonzalez, Rakesh Lakhani, Nikki Bennett, Clarissa De Paz
School of Optometry, InterAmerican University of Puerto Rico, Bayamon, Puerto Rico
Abstract: The traditional role of optometry has been the performance of refractions with the intent to correct vision disorders. In the US, optometry accounts for over two thirds of eye care-related visits. Optometrists have had the privilege of prescribing medications for many years and have been known to manage eye diseases. With no quantitative data known about optometrists’ involvement in managing diseases of the eye, this study describes the trend of ophthalmic drug prescription-writing by optometrists in the US over a 12 quarter period (comprising a 3 year period).
Keywords: prescription pattern, optometry, pharmaceutical utilization, ophthalmic medications
Introduction
Aside from their traditional role in providing refractions with the intent to correct vision disorders, optometrists in the US have become the primary providers of all vision-related service. Optometric services account for over two thirds of primary eye care visits in the United States (US). Practicing in more than 7,000 communities across the country, optometrists have become a prominent part of the health care system in the US.1
For many years, optometrists practicing in states where they are granted the authority of prescribing medications have been known to manage eye disease; they have also been known to provide care for chronic eye diseases in the field of ophthalmology and other medical specialties. Some studies have shown that collaboration within optometry and ophthalmology improves a patient’s functional vision outcome and also reduces the cost of specialty care.2
In 2010, there were 34,200 optometrists providing care in the US; however it is worth noting that not all practicing optometrists treat or manage eye diseases.3 In the US, each state has its own board of optometry regulating various factors that influence the allowed prescription drugs used by the optometric population in the specific geographical area.
With the distribution, didactic knowledge and the equipment intrinsically used for visual function testing, licensed optometrists have been known to manage eye diseases but little is known about the extent to which optometrists are managing diseases of the eye. There has been suspicion that the tendency of optometrists in the US to treat eye diseases has been on the rise throughout the years. Similarly, the reported use of prescription ophthalmic drugs has significantly increased over the years.4
Some authors have suggested the use of pharmaceutical utilization audits as a way to evaluate or develop health policy or even to assess a particular groups’ competency in their therapeutic area.5–8 In such pharmaceutical utilization audits are an indirect way to measure optometrists’ involvement in managing eye conditions that require the use of prescription medications. To date, there is no literature available that describes the use of prescription medications and the trend of such use by optometrist in the United sates. In this study the authors looked at the trend of ophthalmic drug prescription-writing by optometrists in the US over a 12 quarter period (comprising a 3 year period).
Methodology
We analyzed twelve quarters worth of US optometry prescription data from the fourth quarter of 2010 to the third quarter of 2013. Data were obtained from a recompilation of total prescriptions written by optometrists in the US as reported to IMS. IMS is a consulting company that monitors prescription drug data of physicians by specialty.
Total data was pooled in increments totaling four quarters thus comprising a 1-year reporting period. Data were limited to branded and generic medications (except for anti infectives which is only branded medication data) and grouped into six categories. The six categories were: steroids; allergy; combination anti-infective and steroid; branded anti-infective; antiviral; and nonsteroidal anti-inflammatory drugs (NSAIDs).
Data analyzed for 2011 was the total number of prescriptions in the fourth quarter of 2010, first quarter 2011, second quarter of 2011, and third quarter of 2011. Data analyzed for 2012 were the total number of prescriptions in the fourth quarter of 2011, first quarter of 2012, second quarter of 2012, and third quarter of 2012. Data analyzed for 2013 were the total number of prescriptions in the fourth quarter of 2012, first quarter of 2013, second quarter of 2013, and third quarter of 2013.
We then tabulated the total of prescriptions during the time period as described and reported a total number. Data analyzed were interpreted and compared as a year to year running total, based on the total amount of prescriptions written, and interpreted in a more directional manner. In no way do the authors believe these numbers reflect absolute values of total prescriptions written by optometrists.
Results
We tabulated the total amount of prescriptions written by the reported time period and report the total numbers. Steroid prescriptions written totaled 936,267 in 2011, another 1,039,497 in 2012, and 1,136,704 in 2013. This shows an 11.03% increase from 2011 to 2012 and a 9.35% increase from 2012 to 2013 (Figure 1).
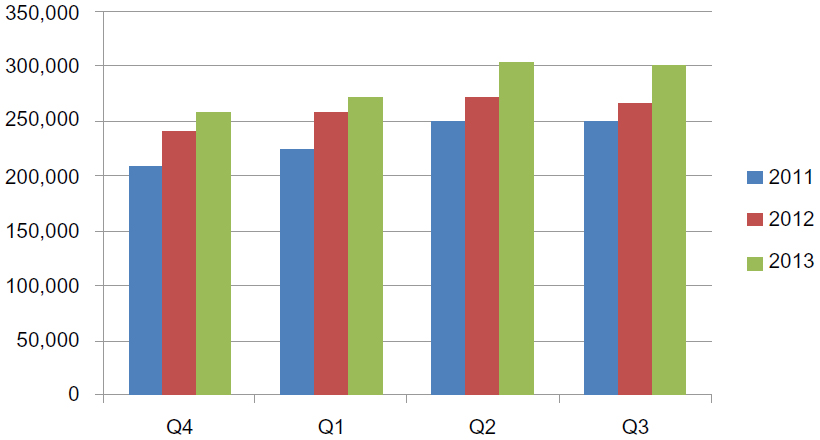 | Figure 1 Total prescriptions, steroids, by quarter (Q). |
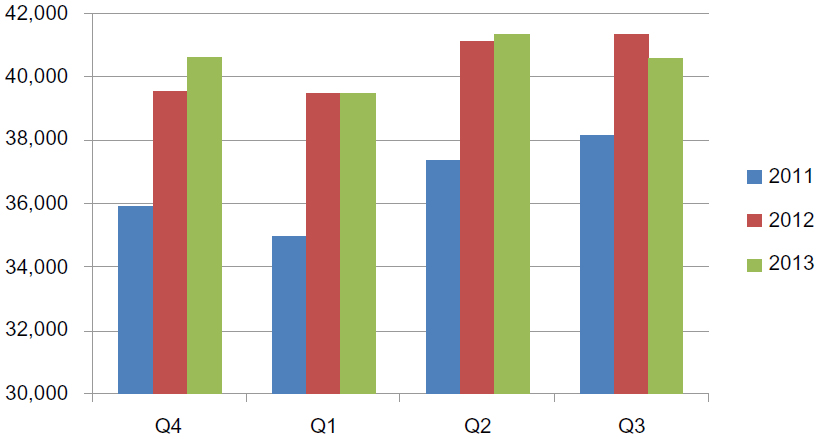
In the prescription only allergy market, there were 1,338,840 prescriptions written in 2011; in 2012, there were 1,351,612. Thus far in 2013, there have been 1,379,520 written. There was a 0.95% increase from 2011 to 2012. From 2012 to 2013, there was a 2.06% increase in allergy prescriptions (Figure 2).
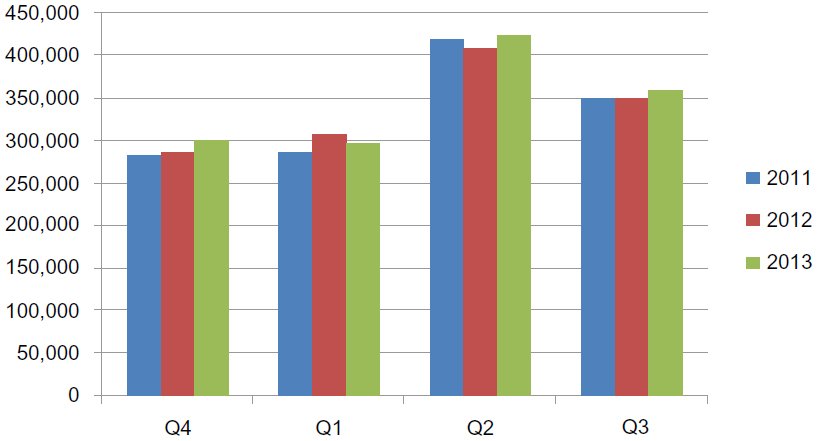 | Figure 2 Total prescriptions, allergy, by quarter (Q). |
Prescriptions for combination drops consisting of both an antibiotic and a steroid totaled 816,332 in 2011. In 2012 there were 884,435 prescriptions written, while in 2013 there were 887,237. From 2011 to 2012, there was an 8.34% increase. From 2012 to 2013, there was a 0.32% increase (Figure 3).
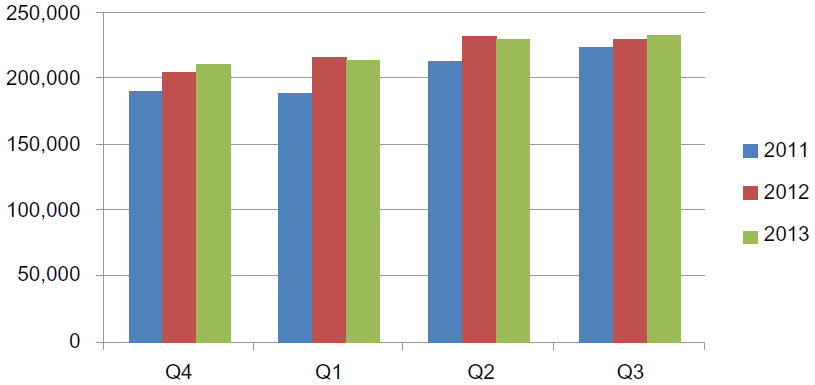 | Figure 3 Total prescriptions, combination antibiotic plus steroid, by quarter (Q). |
The branded anti-infective market reported 623,440 prescriptions written in 2011, 516,907 in 2012, and 426,431 in 2013. The data reveals a 17.09% decrease from 2011 to 2012 and a 17.50% decrease from 2012 to 2013 (Figure 4).
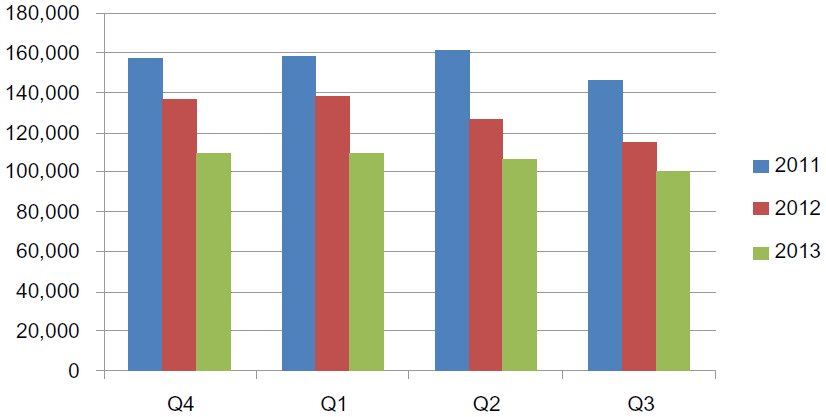 | Figure 4 Total prescriptions, branded anti-infective, by quarter (Q). |
Within the antiviral market, there were 28,636 prescriptions written in 2011. In 2012, there were 31,873, and 36,230 in 2013. This pattern represents an 11.30% increase from 2011 to 2012 and a 13.67% increase from 2012 to 2013 (Figure 5).
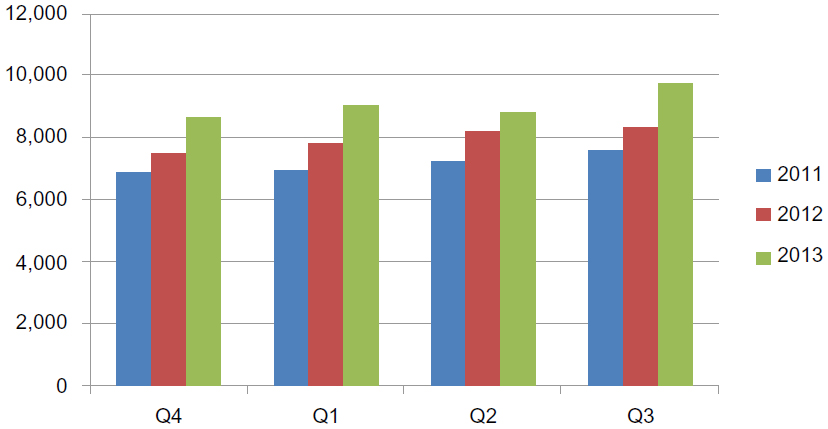 | Figure 5 Total prescriptions, antiviral, by quarter (Q). |
In 2011 the NSAID market reported 146,338 prescriptions written. In 2012, there were 161,511 written, and 2013 has shown 162,058 thus far. This represents a 10.37% increase from 2011 to 2012 and a 0.34% increase from 2012 to 2013 (Figure 6).
 | Figure 6 Total prescriptions, NSAIDs by quarter (Q). |
The total number of prescriptions written by optometrists therefore totaled 3,889,853 for 2011. For 2012, there were 3,985,835 prescriptions written. Lastly, 2013 showed a total of 4,028,180 prescriptions written. There was a 2.47% increase from 2011 to 2012. From 2012 to 2013, there was a 1.06% increase in the total number of optometric prescriptions written (Figure 7).
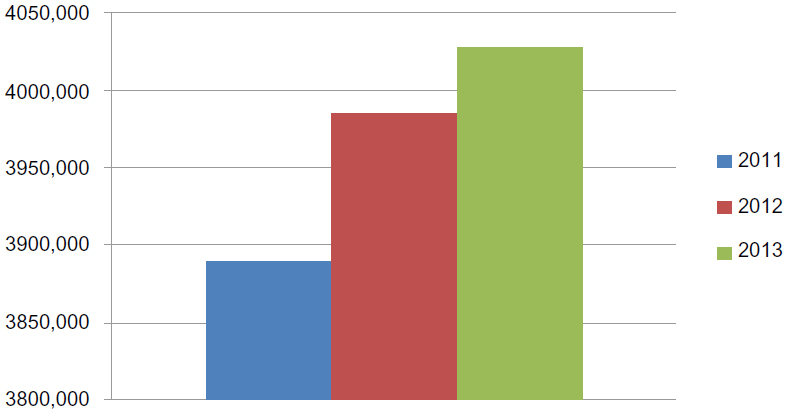 | Figure 7 Total prescriptions by year. |
Conclusion
It could be argued that much of the debate about the role optometrists play in disease management is not whether optometrists are performing this clinical work, but rather about the health care impact of such management. As noted, it has been suggested that prescription drug audits could be an indirect way of evaluating professional involvement in pharmaceutical management of eye diseases. It is worth noting that study limitations do not account for changes in optometric manpower and services in the US over the period measured, nor seasonal variations in the incidence of eye diseases. The authors believe that these data should be interpreted in a directional manner and that in no way do the data reflect absolute values. When looking at total volume of prescriptions attributed to optometrists in the US, for the twelve quarter data from 2010 to 2013 and interpreted in a directional manner, there is a positive trend in the total number of prescriptions used for therapeutic purposes written by optometrists in the US.
As presented, the analysis indicates a positive growth trend in the usage of prescribed ophthalmic drugs in most single category evaluated. As such the data suggest optometrists’ more comfortable attitude in this medical aspect of the profession.
The data suggest the trend of prescription-writing by optometrists is increasing, as has been previously reported.4 In our study there was an overall increase in year-to-year trend in the amount of medications prescribed by optometrists during the period studied. To periodically document these audits will give the profession of optometry an important tool in describing the role in health delivery by optometrists in the US.
The one segment that has shown a decrease in total prescriptions has been the branded anti-infective area. This could point to the possibility of there being an increased availability in unbranded, generic, topical antibiotics. This could possibly signal a higher adoption of unbranded or generic medications by this group but no data were gathered on that segment. This is one study limitation.
The information presented is useful to better understand customary prescribing patterns currently adopted by optometrists. We interpret the trend as an indication that optometrists in the US have a more comfortable attitude towards prescribing ophthalmic drugs for the treatment of eye diseases.
These data can be used in evaluating optometrists’ involvement in pharmacological therapy and may be useful in determining management paradigms adopted by this group to treat specific conditions. In addition, it may be beneficial to provide guidance to create health care policies related to eye care and provide a new perspective of the role that medical optometric care represents to the health care market.
Information from pharmaceutical utilization audits has the potential to increase our knowledge of eye disease management by optometrists and can be used to compare, evaluate, and guide health care workers and administrators in optimizing eye care for patients. The authors believe that the data signal optometry’s unique shift, indicating that the profession is expanding and becoming more comprehensive in providing both refractive and medical eye care.
This study may become a precedent for the development of prospective inferential studies to better understand the management paradigms of this profession, influencing the public perception of optometry as well as creating a better understanding of the role of optometric medical care in the health care system.
Disclosure
Agustin L Gonzalez is a consultant for Bausch and Allergan. The other authors report no conflict of interest in this work.
References
American Optometric Association. Care of the Patient with Age-Related Macular Degeneration. St Louis: American Optometric Association; 1994. Available from: http://www.aoa.org/documents/CPG-6.pdf. Accessed October 25, 2012. | |
O’Connor PM, Harper CA, Brunton CL, Clews SJ, Haymes SA, Keeffe JE. Shared care for chronic eye diseases: perspectives of ophthalmologists, optometrists and patients. Med J Aust. 2012;196(10):646–650. | |
Occupational Outlook Handbook, 2012–2013 Edition, Optometrists [webpage on the internet]. Washington: Bureau of Labor Statistics, US Department of Labor; 2012. Available from: http://www.bls.gov/ooh/healthcare/optometrists.htm. Accessed November 11, 2013. | |
Gonzalez A, poster American Academy of Optometry, San Francisco, A Three Year Quantitative Analysis of Prescription Drug Writing by Optometrist. Poster presented at: American Academy of Optometry meeting; November 6, 2010; San Francisco, CA. | |
Hogerzeil HV. Promoting rational prescribing: an international perspective. Br J Clin Pharmacol. 1995;39(1):1–6. | |
Tunis SR, Stryer DB, Clancy CM. Practical clinical trials: increasing the value of clinical research for decision making in clinical and health policy. JAMA. 2003;290(12):1624–1632. | |
World Health Organization. How to Investigate Drug use in Health Facilities: Selected Drug use Indicators. Geneva: World Health Organization; 1993. | |
Biswas NR, Jindal S, Siddiquei MM, Maini R. Patterns of prescription and drug use in ophthalmology in a tertiary hospital in Delhi. Br J Clin Pharmacol. 2001;51(3):267–269. |
 © 2014 The Author(s). This work is published and licensed by Dove Medical Press Limited. The
full terms of this license are available at https://www.dovepress.com/terms
and incorporate the Creative Commons Attribution
- Non Commercial (unported, 3.0) License.
By accessing the work you hereby accept the Terms. Non-commercial uses of the work are permitted
without any further permission from Dove Medical Press Limited, provided the work is properly
attributed. For permission for commercial use of this work, please see paragraphs 4.2 and 5 of our Terms.
© 2014 The Author(s). This work is published and licensed by Dove Medical Press Limited. The
full terms of this license are available at https://www.dovepress.com/terms
and incorporate the Creative Commons Attribution
- Non Commercial (unported, 3.0) License.
By accessing the work you hereby accept the Terms. Non-commercial uses of the work are permitted
without any further permission from Dove Medical Press Limited, provided the work is properly
attributed. For permission for commercial use of this work, please see paragraphs 4.2 and 5 of our Terms.