Back to Journals » Cancer Management and Research » Volume 11
A tumor map generated from three-dimensional visualization of image fusion for the assessment of microwave ablation of hepatocellular carcinoma: a preliminary study
Authors An C ![]() , Li X, Liang P
, Li X, Liang P ![]() , Yu J
, Yu J ![]() , Cheng Z
, Cheng Z ![]() , Han Z, Liu F, Dong L
, Han Z, Liu F, Dong L
Received 20 November 2018
Accepted for publication 23 January 2019
Published 15 February 2019 Volume 2019:11 Pages 1569—1578
DOI https://doi.org/10.2147/CMAR.S195354
Checked for plagiarism Yes
Review by Single anonymous peer review
Peer reviewer comments 4
Editor who approved publication: Dr Antonella D'Anneo
Chao An,* Xin Li,* Ping Liang, Jie Yu, Zhigang Cheng, Zhiyu Han, Fangyi Liu, Linan Dong
Department of Interventional Ultrasound, Chinese PLA General Hospital, Beijing, 100853, China
*These authors contributed equally to this work
Purpose: This study aimed to investigate the clinical value of a tumor map for assessing the ablative effect after ultrasound-guided percutaneous microwave ablation (US-PMWA) for hepatocellular carcinoma (HCC).
Methods: The medical records of 68 patients (49 male and 19 female, 59.9±12.7 years) with HCC who underwent US-PMWA from May 2013 to May 2017 were reviewed. A tumor map was generated from the fusion of three-dimensional (3D) visualization images based on the preoperative target tumor and postoperative ablation area, to evaluate whether the ablation area covering the tumor has reached a 5 mm ablative margin (AM). The lesions were divided into two groups according to the tumor maps: group A (failed to achieve AM) and group B (achieved AM). The cumulative local tumor progression (LTP) rates of both groups were statistically analyzed using the log-rank test.
Results: Success rate of tumor map generation was 100% (68/68), and no residual tumors were found. MWA-related 3D images, which included target tumor volume, ablation area volume, and residual liver ratio, were compared between groups A and B (P=0.295, P=0.772, and P=0.527, respectively). Technique effectiveness rate (91.7% vs 100%) was achieved in the two groups, showing no significant statistical differences (P=0.672). The 3-, 6-, 9-, and 12-month LTP rate was 8.3%, 16.7%, 20.8%, and 34%, respectively, for group A and 0%, 2.8%, 2.8%, and 2.8%, respectively, for group B, showing significant statistical differences (P<0.001) between the two groups.
Conclusion: The novel technology of tumor map generated from 3D visualization of image fusion is feasible and useful in evaluating the ablative effect of US-PMWA for HCC.
Keywords: three-dimensional visualization, tumor map, image fusion, microwave ablation, hepatocellular carcinoma
Introduction
Hepatocellular carcinoma (HCC) is the third most lethal malignancy worldwide, with a high incidence in China.1 Although liver transplantation and hepatic resection are the preferred treatment strategies for patients with HCC,2 image-guided percutaneous microwave ablation (PMWA) has been established as a frequent and acceptable therapeutic method for patients in the early stages of HCC, as defined by the Barcelona Clinic Liver Cancer staging system.3 This treatment technique has been associated with many theoretical advantages, such as higher intra-tumoral temperature, larger ablation volume, and less operation time, compared with radiofrequency ablation (RFA). However, local tumor recurrence (LTR) rates of HCC remain high in patients who undergo MWA. Wang et al2,4 reported that the 3-year recurrence rate after MWA was 46.8%, while the reasons for such a high recurrence rate remain unknown and warrant effective solutions. Several previous studies have reported that the ablative margin (AM) is closely associated with local tumor progression (LTP).5–7 AM refers to the 5- to 10-mm-wide tissue region that exceeds the tumor area, which should ideally be destroyed during tumor ablation. Since AM is one of the most significant factors for predicting LTP after MWA, methods for accurately assessing AM are of high importance.
Many methods to evaluate AM have recently emerged following thermal ablation techniques for HCC. The traditional assessment method frequently used by radiologists is the use of side-by-side routine axial images (contrast-enhanced ultrasound [CEUS]/computed tomography [CT]/magnetic resonance imaging [MRI]).8–10 This method has many limitations such as a somewhat subjective distinction between the index tumor region and the surrounding hepatic parenchyma of the ablation area, not having the necessary resolution to quantitatively evaluate AM, and the target area between pre- and postoperation being located on different slices owing to respiratory movement.11 Thus, in order to improve the accuracy of AM evaluation, image fusion techniques have been increasingly introduced. Image fusion is primarily conducted using US, CT, or MRI. Since MRI is more sensitive, Wang et al12 assessed AM after RFA using MR–MR image fusion for HCC and reported satisfactory results. Moreover, Makino et al13 developed a novel technique called the extracted-overlay function in CT/MRI-ultrasonography fusion imaging for RFA. This involves extracting the tumor region with a virtual AM from the CT/MRI image and superimposing it on an US image. This method has proven to be useful for treatment planning and guidance with RFA. Tang et al14 reported on the three-dimensional (3D) reconstruction of the tumor and ablation area using CT images, in order to assess the ablative effect. However, there is a lack of accurate quantitative evaluation of these methods, even though advances have been made in 3D image fusion methods.15–18
Currently, regardless of the method of evaluation, a convincing assessment capability cannot be achieved. In this study, the ablative effect was observed by flattening 3D images onto a 2D map, and quantifying the differences in the overlapping range of the ablation area. This study aims to investigate a novel technology that can accurately evaluate the ablative effect of ultrasound-guided percutaneous microwave ablation (US-PMWA) for HCC.
Materials and methods
Study design and patient selection
This single-center, retrospective study was approved by the Ethics Committee of the Chinese PLA General Hospital (Beijing, China) and was conducted in accordance with the principles of the Declaration of Helsinki. The medical records of all patients with HCC who underwent US-PMWA from May 2013 to May 2017 were reviewed and data confidentiality can be confirmed. Because of the retrospective nature of the study, patient consent for inclusion was waived. The inclusion criteria were as follows: 1) those with a single HCC during initial MWA treatment; 2) the distance between the tumor boundary and important tissues being equal to or larger than 5 mm; 3) pre- and post-procedure enhanced MRI imaging data available; 4) image acquisition time limited to 4 weeks preoperatively and 1 week postoperatively; and 5) those who did not undergo surgery or other ablation treatments. The exclusion criteria were as follows: 1) had serious medical comorbidities, including heart, lung, and renal function dysfunction; 2) preoperative or postoperative image data missing; 3) do not have the same type of pre- and postoperative images; 4) tumor abutting important tissues or organ (ie, gastrointestinal tract, gallbladder, major blood vessels).
During the study period, 378 patients consecutively underwent US-PMWA, and as indicated in Figure 1, a total of 310 patients were excluded because they met the exclusion criteria. As a result, 68 patients with 68 tumors (mean age: 59.9±12.7 years; range: 29–78 years) met the inclusion criteria and were included in this study. Tumor map is a novel method of assessment of the ablation effect, which can distinguish whether the ablation area covering the tumor has reached a 5 mm safe boundary, and the process is detailed in the following section. According to the assessment of the 5 mm safe boundary using tumor map, the 68 patients were divided into two groups as follows: 1) patients with an ablation area completely covering the tumor but failing to achieve the 5 mm safe boundary (group A), and 2) patients with an ablation area completely covering the tumor and successfully achieving the 5 mm safe boundary (group B). HCC was diagnosed according to guidelines of the European Association for the Study of Liver.19 The final confirmed results were based on histological evidence of needle biopsy specimens.
 | Figure 1 Flow diagram shows exclusion criteria in ablative effect of patients with HCC after US-PMWA assessed by tumor map. < class="tabtext">Abbreviations: HCC, hepatocellular carcinoma, US-PMWA, ultrasound-guided percutaneous microwave ablation. |
Processing of 3D visualization image fusion
A desktop computer (Lenovo) with an Intel Core i5 processor was used to perform the 3D visualization of image segmentation and registration based on MRI data (2.5 mm thick slices) before and after US-PMWA. All selected MR images were converted into DICOM format, which was obtained from the online medical image database. Figure 2 shows a flowchart of the procedure used for 3D visualization of image fusion and tumor map generation. The images obtained were segmented using 3D visualization software that was based on MITK (Hokai company, Zhuhai, China) and had quick segmentation characteristics (segmentation time within 2 minutes). HCC was detected using MRI arterial phase, and the regions of interest (ROI) of the tumors were sketched in red and deleted areas around the interest region were sketched in blue. The segmentation procedure of the ablation areas used in the delay phase was similar to that described earlier, and image registration was created using the previously mentioned software. The 3D images were created in three orthogonal views (axial, coronal, and sagittal), which were processed for image translation and rotation. The registration process was initialized through automatic position matching of the center of gravity of the lesions with their non-linear volumes, and was based on appropriate landmarks, such as the branching of vessels. In order to acquire results of high precision, the registration images were manually adjusted. Next, the post-interventional image was shown in ROI as a colored overlay onto the pre-interventional image and could also be moved by mouse interactions in order to achieve a better correlation between both images. Finally, the resulting registration matrix was applied to the coagulation mask (Figure 3).
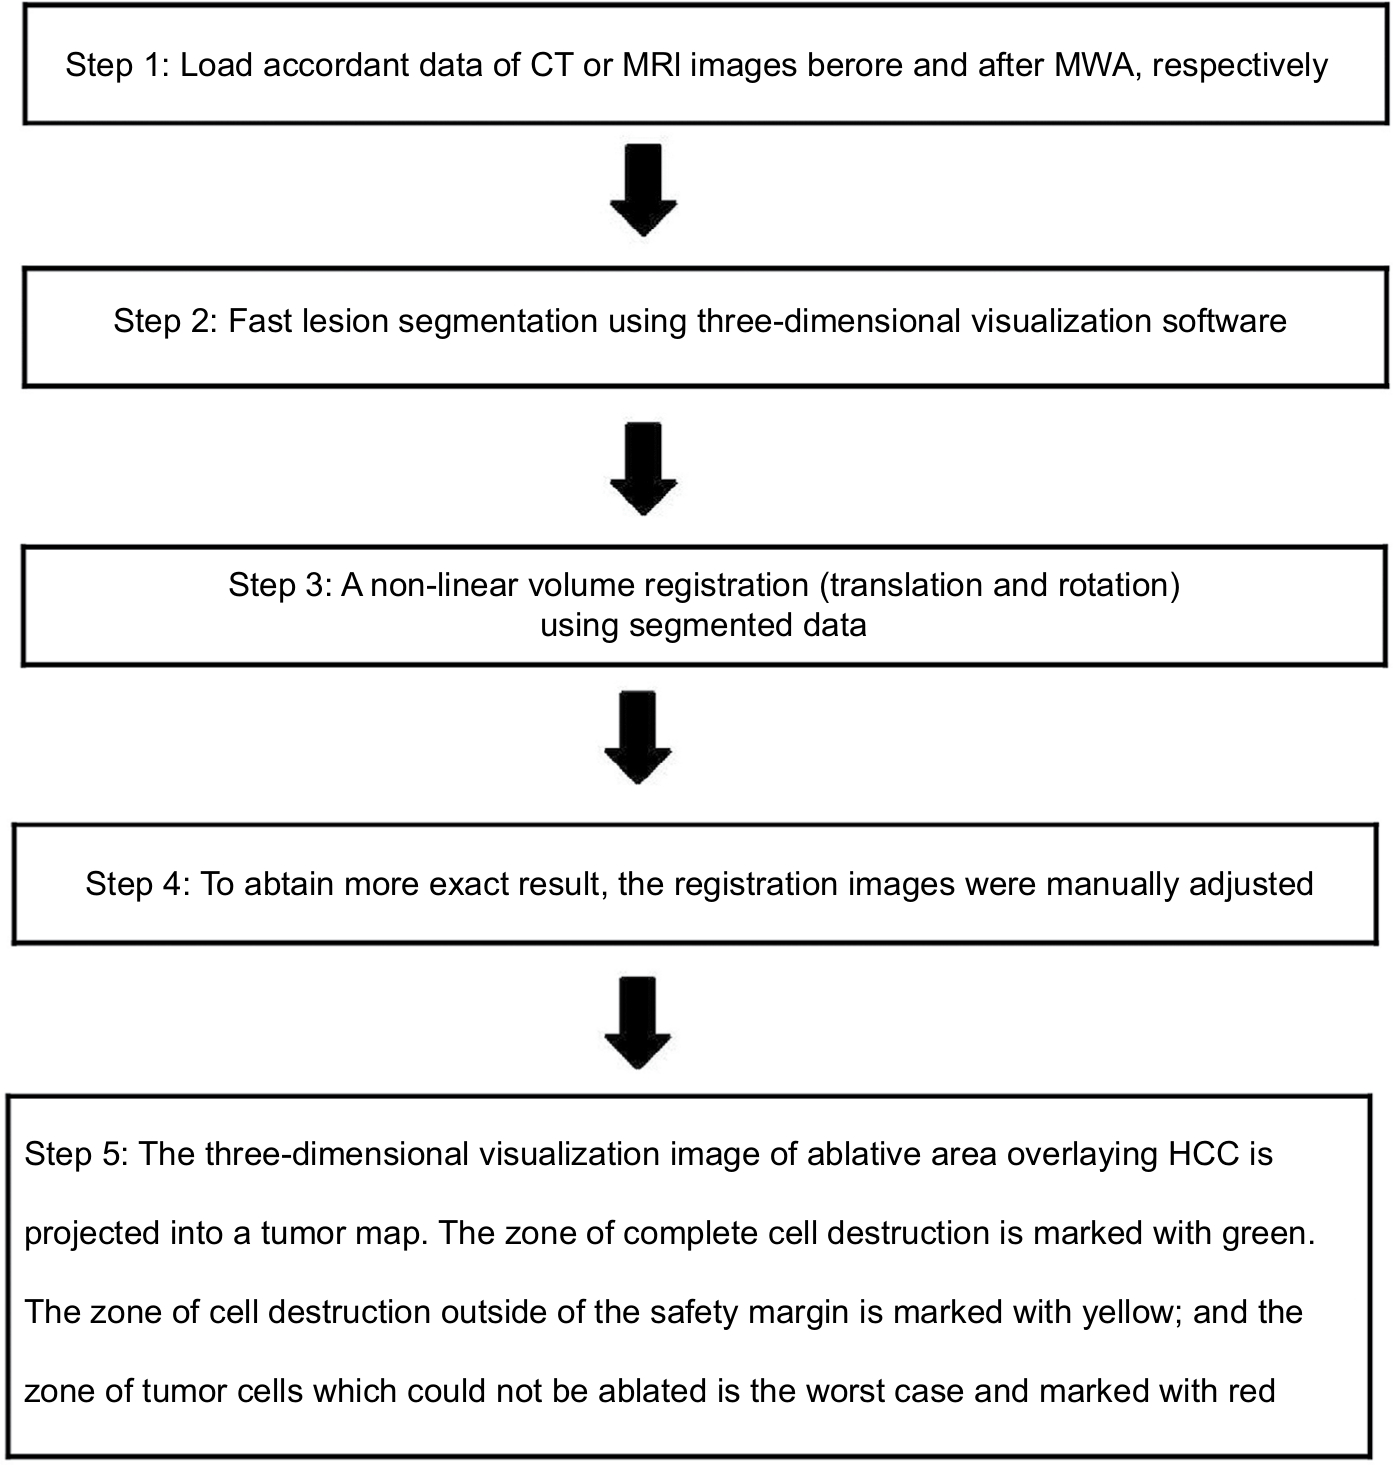 | Figure 2 Flowchart shows procedure for three-dimensional visualization of image fusion and tumor map generation. Abbreviations: MWA, microwave ablation; HCC, hepatocellular carcinoma; CT, computed tomography; MRI, magnetic resonance imaging. |
 | Figure 3 Images in a 58-year-old-woman who underwent US-PMWA for hepatocellular carcinoma (HCC) (2.8 cm × 2.5 cm × 2.0 cm) assisted by 3D visualization of operative planning system. Notes: (A) Preoperative contrast-enhanced MRI showed the HCC with peripheral nodular hyper-enhancement in artery phase in right lobe accompanied with two feeding arteries (red arrows). (B) The HCC lesion was sketched as region of interest (ROI) in the tumor with red color and areas around the interest region were deleted. (C) Three-dimensional (3D) visualization of operative planning system showed the location and relationship with the tumor and the surrounding organs, and quantized the volume of liver and HCC (liver: 1,396.94 mL; HCC: 5.22 mL). (D) In the MRI, 3 days after ablation, ablation zone was demonstrated clearly in delay phase. (E) 3D visualization of operative planning system showed the location and relationship with the ablation zone and the surrounding organs, and quantized the volume of liver and ablation zone (liver: 1,291.32 mL; HCC: 36.00 mL). (F) Screen shots show the procedure for 3D visualization of imaging registration before and after ablation. The junction between the portal vein and the hepatic right vein was selected as an appropriate landmark (circle cross indicate). (G) The post-ablation 3D image (green color) was overlayed onto the pre-ablation 3D image (red color). (H) A spherical parameterization of the surface was used in 3D visualization of operative planning system and subsequently flattened onto a 2D map. (I) A traffic light color scheme (red, green, yellow) was used to emphasize ablation state in tumor map. Abbreviations: US-PMWA, ultrasound-guided percutaneous microwave ablation; MRI, magnetic resonance imaging. |
US-guided MWA procedure
A KY2000 MW ablation system (Kangyou Medical Instruments, Nanjing, China) consisting of two independent MW generators, two flexible coaxial cables, and two water-pumping machines, which could drive two 15-G cooled-shaft antennae simultaneously, was used. Before treatment, all patients were scanned using contrast-enhanced CT, MRI, and US, and an appropriate puncture route was chosen using US. After local anesthesia with 1% lidocaine, US-guided biopsy was performed in 2–3 separate punctures using an automatic biopsy gun with an 18-G cutting needle. Subsequently, the antenna was inserted percutaneously into the tumor and placed at designated sites under US guidance. One antenna was inserted into the center of the tumors that were <1.7 cm, and multiple antennae were inserted into tumors that were 1.7 cm or larger. Two antennae were used simultaneously during MW ablation, in order to achieve a larger ablation zone. A power output of 50 W for 10 minutes was routinely used during MWA. After all punctures, intravenous anesthesia with a combination of propofol (Diprivan; Zeneca Pharmaceuticals, Wilmington, DE, USA) and ketamine (Shuang he Pharmaceuticals, Beijing, China) was administered via the peripheral vein. If heat-generated hyperechoic water vapor did not completely encompass the entire tumor, prolonged microwave emission was applied until the desired temperature was reached. When the tumor was located not >5 mm from the skin surface or adjacent to the bowel, gallbladder, or other important tissues, hydrodissection was performed. In addition, that microwave needle tract needed to be ablated during needle withdrawal. For tumors with subcutaneous invasion, an ice bag was placed on the skin to avoid scalding during MW ablation.
Assessment of treatment effect using a tumor map
In this study, the 3D surface of the tumor was projected onto a 2D map, in order to reduce the high amount of interaction. A spherical parameterization of the surface was used and subsequently flattened onto a 2D map (Figure 3). In order to assess the ablative effect, 3D coagulation zones in the spatial extent of the tumor were identified, and a traffic light color scheme was used to emphasize the ablation state as follows: 1) the zone of complete cell destruction was marked green and corresponded to the optimal ablation result within the intentional safety margin (>5 mm); 2) the zone of cell destruction outside of the safety margin (>5 mm) was marked yellow and is considered critical because the safety margin is not sufficiently large to completely prevent potential cancer recurrence; and 3) the zone of the tumor cells that could not be ablated represented the worst case and was marked red, which is an established signal color in medical applications. In this zone, the ablation strategy had failed, and thus, a second ablation of the tumor was probably unavoidable.
Follow-up after MWA
All patients were required to undergo follow-up 1 month after the initial MWA procedure and then roughly at 3- to 6-month intervals. Thereafter, follow-up visits encompassed several evaluations, including routine physical examination; laboratory tests such as total bilirubin, serum albumin, prothrombin time, and tumor marker levels; and contrast-enhanced imaging including CT, MRI, or positron emission tomography-CT. CEUS images were obtained within 3 days of performing the MWA procedure, to observe residual tumors. CEUS was performed using the Sequoia 512 system (Acuson, Mountain View, CA, USA) with a multifrequency transducer (4V1, 2.0–4.5 MHz). US contrast agent used was SonoVue (Bracco), a second-generation contrast agent. A dose of 1.2 mL was injected intravenously via the cubital vein, and was immediately followed with 5 mL of normal saline flush. Contrast-specific software was used. The mechanical index was 0.12–0.18. Technique effectiveness was defined as the absence of the enhancement of any areas of the mass at the follow-up contrast-enhanced image examination performed 1 month after MWA, which was decided by the consensus of the aforementioned two diagnostic radiologists. Overall survival (OS) was defined as the time from the first MWA procedure until the time of death or last follow-up. Recurrence-free survival (RFS) was defined as the time from complete ablation after US-PMWA until the date that HCC recurrence was diagnosed using radiology. LTP was defined as the appearance of an irregular, nodular, scattered, or eccentric pattern of peripheral enhancement around the ablation zone, after MWA. Follow-up was terminated at reoccurrence, death, or at the final visit of the patient. Complications were classified by outcome, according to the Society of Interventional Radiology Classification System for complications.20
Results
Baseline characteristics
The mean maximum tumor diameter was 27.8±7.2 mm. Success rate of tumor map generation was 100% (68/68) and no residual tumors were detected. Sixty-eight HCC tumors and corresponding ablation areas were segmented for 59.4±11.2 seconds and 40.3±9.1 seconds, respectively, which showed no statistical differences (P=0.589). The median image registration time cost was 121.3 seconds and registration error was 1.7±0.3 mm. According to assessment through tumor map, 24 patients with 24 HCCs (six female, 18 male; average age: 61.6±11.2 years) in group A and 44 patients with 44 HCCs (13 female, 31 male; average age: 57.6±10.2 years) in group B were reviewed. Characteristics of the patients and tumors are presented in Table 1. MWA-related 3D images including target tumor volume, ablation area volume, and residual liver ratio were compared between the two groups (P=0.295, P=0.772, and P=0.527, respectively). The number of MWA sessions in group A was similar to that of group B (P=1.000).
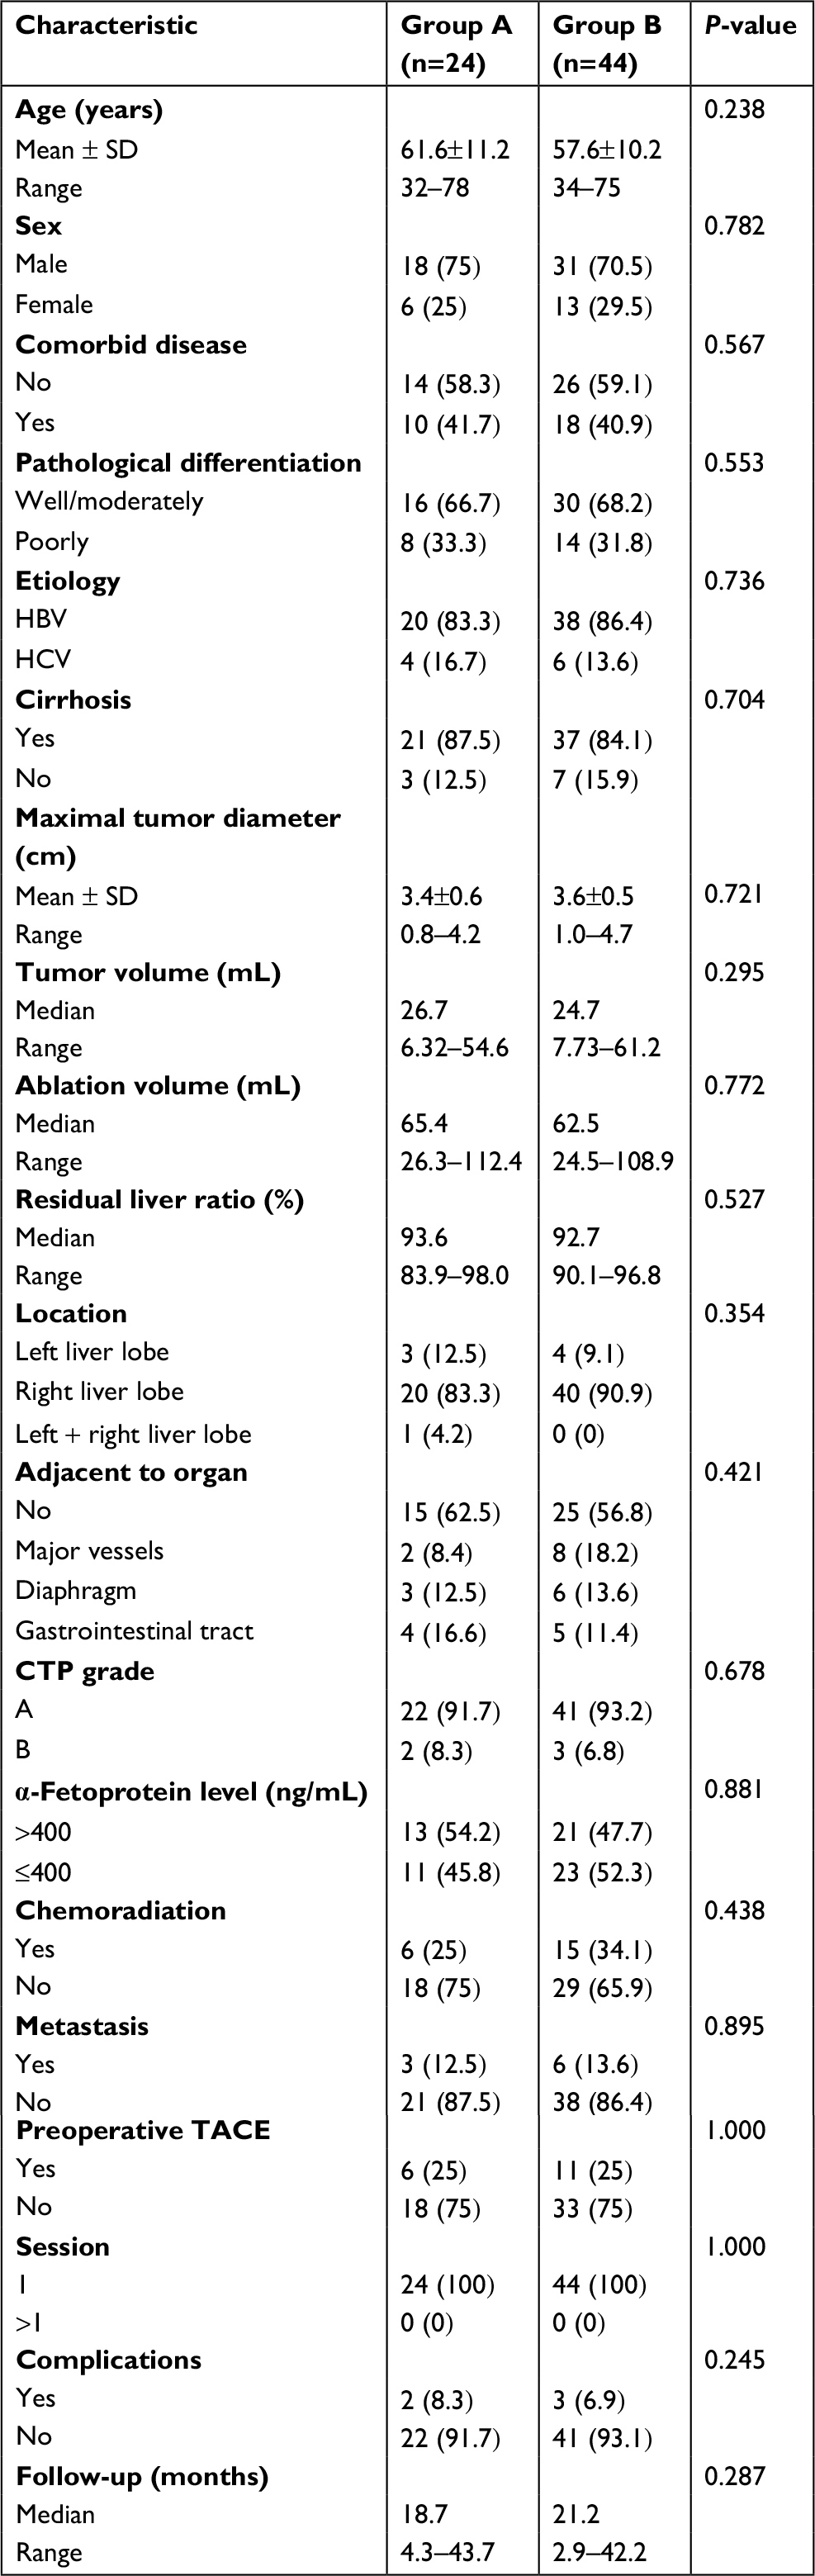 | Table 1 Baseline patient characteristics between group A and group B Notes: Except where indicated, data are numbers of patients. Data in parentheses are percentages and were calculated by using the total number of patients in each group as the denominator. Group A = failed to achieve 5 mm safety boundary, Group B = achieved 5 mm safety boundary. Abbreviations: TACE, transarterial chemoembolization; HBV, hepatitis B virus; HCV, hepatitis C virus; CTP, Child-Turcotte-Pugh. |
Mid-term oncologic outcome after US-PMWA
The median follow-up period was 21 months (range 3–44 months). The median survival period was 18.7 months (4.3–43.7 months) for group A and 21.2 months (2.9–42.2 months) for group B. On the basis of follow-up imaging, the technique effectiveness rate (91.7% vs 100%) achieved in two groups showed no significant statistical difference (P=0.672). Seven (29.2%, 7/24) patients died in group A, while 13 (29.5%, 13/44) patients died in group B. Twelve (50%, 12/24) LTP lesions were discovered in group A, while four (9.1%, 4/44) were discovered in group B. The 1-, 2-, and 3-year OS rates achieved in group A were 77.8%, 54.9%, and 54.9%, respectively, and for group B were 82.6%, 76.4%, and 58.2%, respectively (Figure 4A), showing no significant statistical differences (P=0.615) between the groups. The 1-, 2-, and 3-year RFS rates of group A were 79.2%, 71.2%, and 36.9%, while for group B they were 80.9%, 52.8%, and 45.3%, respectively (Figure 4B), showing no significant statistical difference (P=0.704) between the groups. The 3-, 6-, 9-, and 12-month LTP rates of group A were 8.3%, 16.7%, 20.8%, and 34%, respectively, while for group B they were 0%, 2.8%, 2.8%, and 2.8%, respectively (Figure 4C), showing significant statistical difference (P<0.001) between the groups. All P-values were obtained from a log-rank test performed for the entire curves.
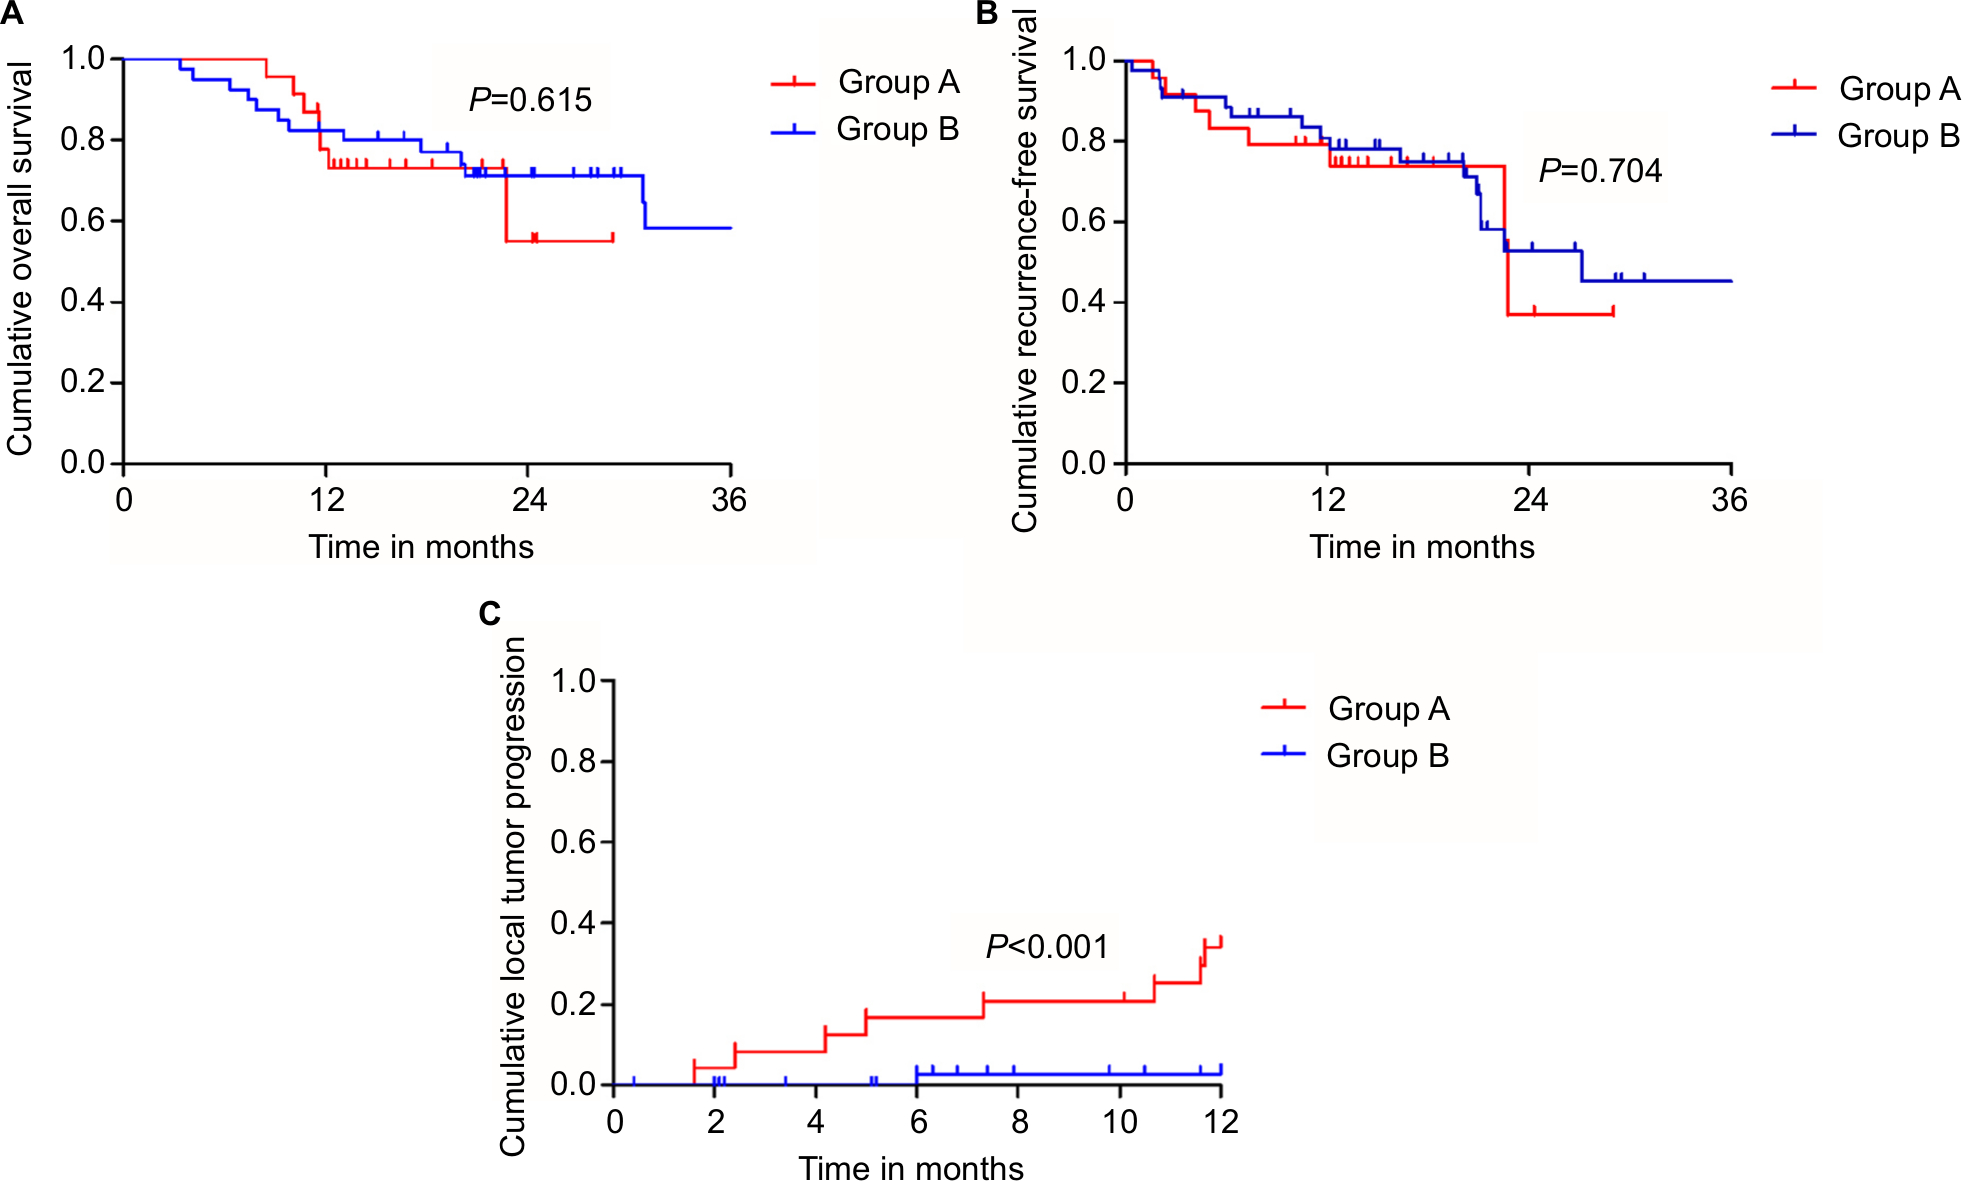 | Figure 4 Kaplan–Meier curves comparing recurrence and overall survival from different groups. Notes: (A) The 1-, 2-, and 3-year overall survival rates of group A and group B were 77.8%, 54.9%, 54.9% and 82.6%, 76.4%, 58.2%, respectively, showing no significant statistical difference (P=0.615). (B) The 1-, 2-, and 3-year recurrence-free survival rates of group A and group B were 79.2%, 71.2%, 36.9% and 80.9%, 52.8%, 45.3%, respectively, showing no significant statistical difference (P=0.704). (C) The 3-, 6-, 9-, and 12-month LTP rates of group A and group B were 8.3%, 16.7%, 20.8%, 34% and 0%, 2.8%, 2.8%, 2.8%, respectively, showing significant statistical difference (P<0.001). Abbreviation: LTP, local tumor progression. |
Complications
No death in the two groups was directly related to the treatment. Two major complications (8.3%, 2/24 patients) occurred in group A after 24 MWA sessions, including one patient who had skin burn and one patient who had seeding on the right abdominal wall. Three major complications (6.9%, 3/44 patients) occurred in patients of group B after 44 sessions, including one hemoglobinuria and two ascites. These patients had hypertension and diabetes. The major complication rates for the two groups were comparable (P=0.245).
Univariate and multivariate analyses
Univariate and multivariate logistic regression analyses were performed to identify predictors influencing the LTP of patients with HCC, who underwent US-PMWA. The univariate analysis showed statistically significant differences in terms of LTP rates, depending on if it was adjacent to major vessels (χ2=4.832; P=0.035), maximal tumor diameter (χ2=11.346; P=0.007), and tumor map (χ2=6.436; P<0.001) (Table 2). The multivariate analysis showed that the factors that significantly affected the LTP rate were maximal tumor diameter (HR =0.923; P=0.006) and tumor map (HR =0.716; P=0.003) (Table 3).
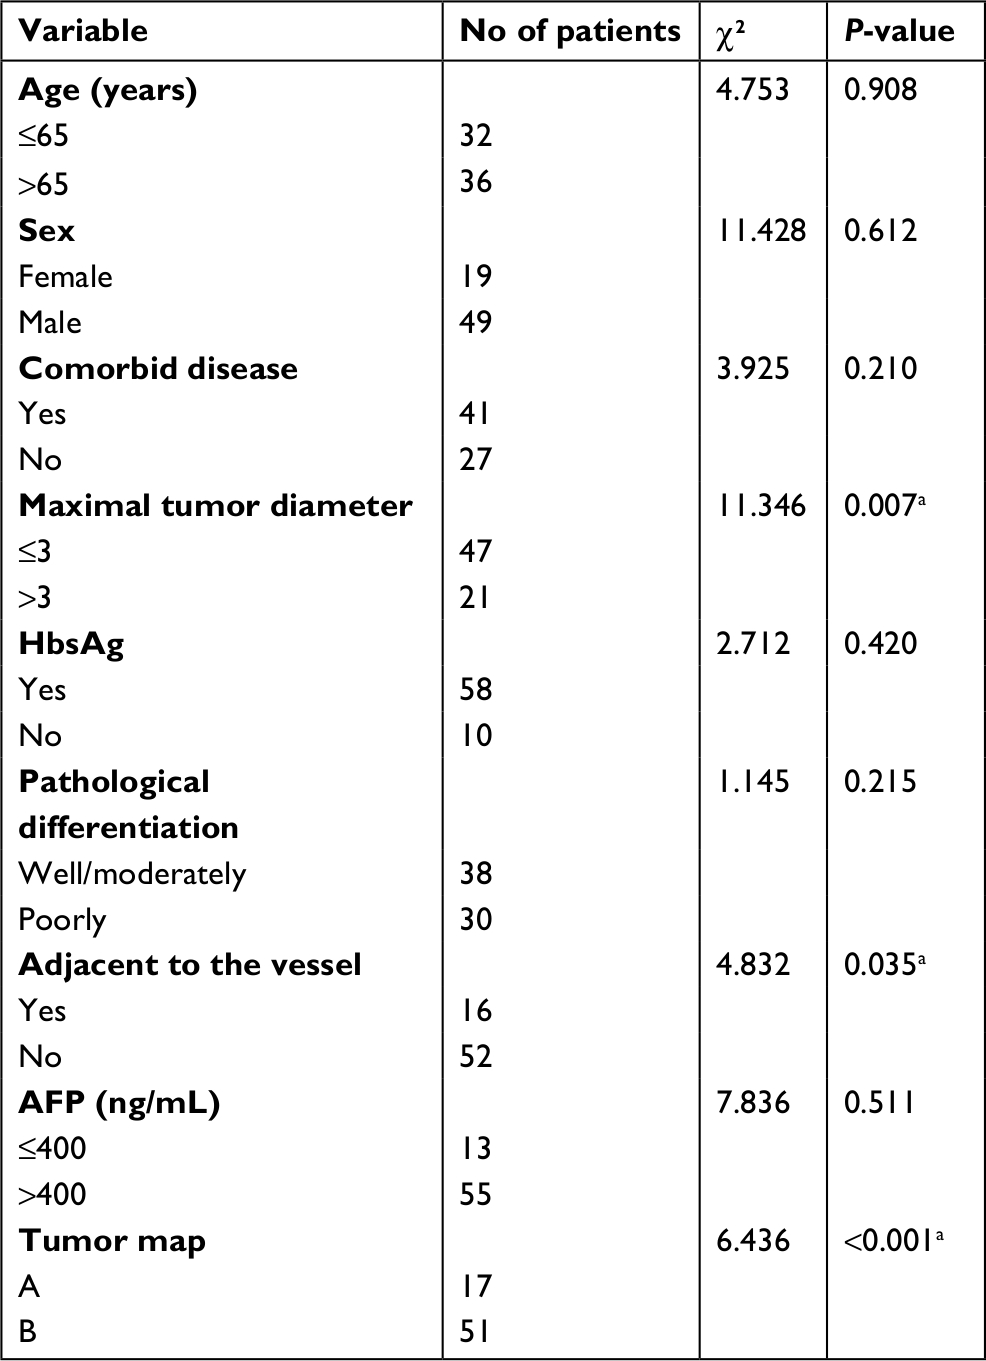 | Table 2 Univariate analysis of prognostic factors for LTP Note: aUnivariate Kaplan–Meier analysis. Abbreviation: LTP, local tumor progression; HbsAg, hepatitis B surface antigen; AFP, α-fetoprotein. |
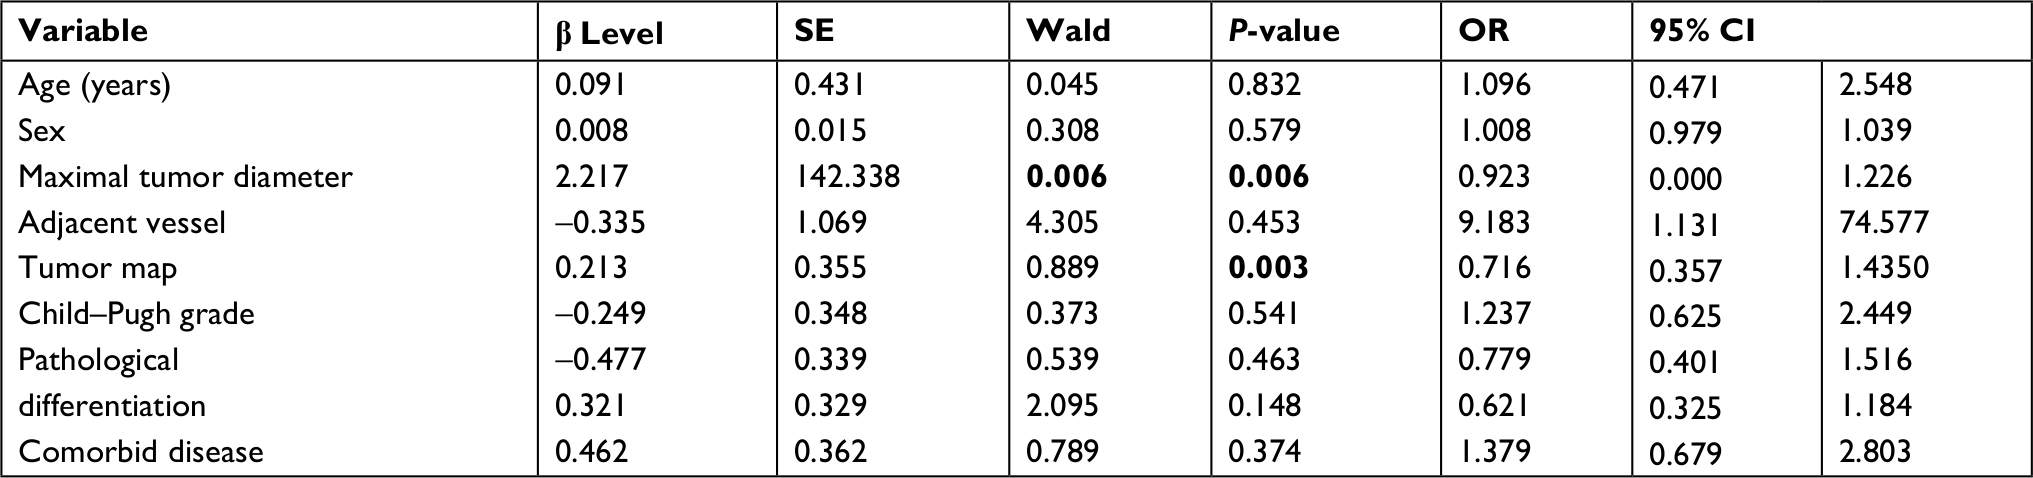 | Table 3 Multivariate analysis of prognostic factors with Cox proportional hazards model Note: Bold values indicate statistical significance. Abbreviation: SE, standard error. |
Discussion
Nowadays, MWA is being used frequently, particularly for patients with solid malignancies,21–24 and is considered to be a minimally invasive treatment for early HCC. A previous study reported that the 5-year survival rate of patients with HCC after MWA can range between 43.1% and 60%.25 Compared with RFA, MWA has many advantages in areas where RF energy is limited.26,27 Microwave energy can rapidly form larger areas of necrosis owing to faster heating and higher temperatures. Moreover, MWA treatment results in a well demarcated ablation zone.28 The therapeutic effects of MWA are satisfactory if the healthy tissue surrounding the ablated lesion, with a sufficient safety boundary (at least 5 mm), can be preserved. Therefore, the status of the safety boundary is very important. In our therapeutic strategy for HCC, in order to prevent LTP, we stipulated that the ablation area should encompass at least 5 mm of normal hepatic parenchyma, beyond the tumor margin. However, this could only be accomplished in 64.7% (44/68) of patients in our study, and failure was mainly attributed to the irregular shape of the tumor that required an elliptic ablative field. Another reason was that the tumor was adjacent to a large blood vessel, and the effects of this remain controversial.29
In the present study, a novel visualization and interaction technique was proposed as software-based support for assessing the ablative effect of MWA with the following characteristics. First, the target areas can be rapidly segmented based on a semi-automatic segmentation algorithm that requires user interaction only to select few reference pixels, to outline target area edges. Second, the MRI image realignment before and after MWA was based on the B-splines free-form deformation algorithm that accommodates non-linear volumes rather than simpler rigid registration algorithms that require additional manual adjustments, which can be compensated only if translation and rotation shifts occur between pre- and post-MWA acquisitions. Finally, this technique allows for the immediate detection of residual tumor tissue on the tumor map by the physician without the need for any interaction. A numeric index for quantitative analysis and assessment of the MWA treatment can also be calculated.
The importance of the tumor map has been attributed to its segmentation and registration functions. Compared with previous studies on the objective evaluation of MWA using various image fusion methods, our tumor map was simpler and more quantitative owing to the following two advantages: first, the 3D surface of the tumor or the ablation area is represented on a 2D map30 using a spherical parameterization of the surface and subsequent flattening, and second, a traffic light color scheme has been used to emphasize and quantitatively describe the ablation status and differences in the ablative effect within the entire tumor. Using these functions, the tumor map indicated that out of the 24 patients who were included into the failed AM group, LTP was seen in 12, which corresponds to an incidence rate of 50%, while among the 44 patients included into AM group, only 9.1% were found to have LTP in this study. The follow-up results showed that there was significant statistical difference in the LTR rate between the two groups. This result indicates the accuracy and feasibility of tumor map in assessing AM.
In this study, univariate analysis revealed that AM and the area adjacent to the vessels were prognostic factors for LTP. Although the effect of AM on LTP has been previously reported, the effect of the area adjacent to the vessel on LTR rate remains at the research stage. Dou et al31 reported outcomes of MWA of HCC adjacent to large vessels and concluded that MWA is an effective and safe treatment for early-stage HCC adjacent to large vessels. The Cox hazards model also indicated that tumor map was a predictor of LTR. Several reasons may explain this result. The radiologist may often be aware that a large AM is impossible to achieve before treatment. Further, there are differences in temperature distribution within and around the HCC nodule, and this phenomenon appears to be related to differences in vascularization between HCC and surrounding cirrhotic hepatic tissue.
Our study has several limitations. First, this new registration technique can only use MRI data with 2.5 mm thick slices; thicker slices may reduce the quality of the segmentation image. Second, as only a single tumor and a single treatment were included in this study, the suitability of using this technique on multiple operation processes remains unknown. Third, we did not histopathologically validate the safety margin of the ablated zone. Thus, a prospective trial that compares standard procedures with MWA is required to validate the clinical usefulness of this assessment technique.
Conclusion
The presented methods support the physician by interactively achieving a reliable therapy. However, the accuracy of ablation verification mainly depends on the robustness of the segmentation process and the precision of the registration of pre- and post-interventional image data. A tumor map generated using 3D visualization of image fusion is feasible and useful for evaluating the ablative effect of PMWA of HCC.
Acknowledgments
This work was supported by the National Key R&D Program of China (No. 2017YFC0112000), three grants 81430039, 81627803 and 81801723 from the National Scientific Foundation Committee of China; 2017FC-CXYY-3005 from the Clinical Research Support Foundation of the Chinese PLA General Hospital.
Disclosure
The authors report no conflicts of interest in this work.
References
Zuo T-T, Zheng R-S, Zhang S-W, Zeng H-M, Chen W-Q. Incidence and mortality of liver cancer in China in 2011. Chin J Cancer. 2015;34(3):508–513. | ||
Moris D, Vernadakis S, Papalampros A, et al. The effect of guidelines in surgical decision making: the paradigm of hepatocellular carcinoma. J BUON. 2016;21(6):1332–1336. | ||
Wang T, Lu X-J, Chi J-C, et al. Microwave ablation of hepatocellular carcinoma as first-line treatment: long term outcomes and prognostic factors in 221 patients. Sci Rep. 2016;6(1):327–328. | ||
Wang YM, Qian GJ, Xu Y, Wang N, Sheng YH. [Efficacy of microwave ablation in treatment of hepatocellular carcinoma within the Milan criteria: a report of 696 cases]. Zhonghua Gan Zang Bing Za Zhi. 2017;25(5):344–348. Chinese. | ||
Lin Y-H, Chiou Y-Y, Chou Y-H, et al. Radiofrequency ablation for recurrent hepatocellular carcinoma in postresectional patients. Eur J Gastroenterol Hepatol. 2011;23(12):1239–1244. | ||
Velez E, Goldberg SN, Kumar G, et al. Hepatic thermal ablation: effect of device and heating parameters on local tissue reactions and distant tumor growth. Radiology. 2016;281(3):782–792. | ||
Wang X, Sofocleous CT, Erinjeri JP, et al. Margin size is an independent predictor of local tumor progression after ablation of colon cancer liver metastases. Cardiovasc Intervent Radiol. 2013;36(1):166–175. | ||
de Baere T, Tselikas L, Yevich S, et al. The role of image-guided therapy in the management of colorectal cancer metastatic disease. Eur J Cancer. 2017;75:231–242. | ||
Koda M, Tokunaga S, Miyoshi K, et al. Assessment of ablative margin by unenhanced magnetic resonance imaging after radiofrequency ablation for hepatocellular carcinoma. Eur J Radiol. 2012;81(10):2730–2736. | ||
Tsuda M, Rikimaru H, Majima K, et al. Time-related changes of radiofrequency ablation lesion in the normal rabbit liver: findings of magnetic resonance imaging and histopathology. Invest Radiol. 2003;38(8):525–531. | ||
Makino Y, Imai Y, Igura T, et al. Comparative evaluation of three-dimensional Gd-EOB-DTPA-enhanced MR fusion imaging with CT fusion imaging in the assessment of treatment effect of radiofrequency ablation of hepatocellular carcinoma. Abdom Imaging. 2015;40(1):102–111. | ||
Wang X-L, Li K, Zz S, Huang ZP, Wang P, Zheng RQ. Assessment of radiofrequency ablation margin by MRI-MRI image fusion in hepatocellular carcinoma. World J Gastroenterol. 2015;21(17):5345–5351. | ||
Makino Y, Imai Y, Igura T, et al. Feasibility of extracted-overlay fusion imaging for intraoperative treatment evaluation of radiofrequency ablation for hepatocellular carcinoma. Liver Cancer. 2016;5(4):269–279. | ||
Tang H, Tang Y, Hong J, Chen T, Mai C, Jiang P. A measure to assess the ablative margin using 3D-CT image fusion after radiofrequency ablation of hepatocellular carcinoma. HPB (Oxford). 2015;17(4):318–325. | ||
Li K, Su Z-Z, Xu E-J, Ju J-X, Meng X-C, Zheng R-Q. Improvement of ablative margins by the intraoperative use of CEUS-CT/MR image fusion in hepatocellular carcinoma. BMC Cancer. 2016;16(1):277. | ||
Li K, Su Z, Xu E, Huang Q, Zeng Q, Zheng R. Evaluation of the ablation margin of hepatocellular carcinoma using CEUS-CT/MR image fusion in a phantom model and in patients. BMC Cancer. 2017;17(1):61. | ||
Tomonari A, Tsuji K, Yamazaki H, et al. Feasibility of fused imaging for the evaluation of radiofrequency ablative margin for hepatocellular carcinoma. Hepatol Res. 2013;43(7):728–734. | ||
Makino Y, Imai Y, Igura T, et al. Utility of computed tomography fusion imaging for the evaluation of the ablative margin of radiofrequency ablation for hepatocellular carcinoma and the correlation to local tumor progression. Hepatol Res. 2013;43(9):950–958. | ||
Sherman M, Bruix J, Porayko M, Tran T; AASLD Practice Guidelines Committee. Screening for hepatocellular carcinoma: the rationale for the American Association for the study of liver diseases recommendations. Hepatology. 2012;56(3):793–796. | ||
Ahmed M, Solbiati L, Brace CL, et al. Image-guided tumor ablation: standardization of terminology and reporting criteria – a 10-year update. Radiology. 2014;273(1):241–260. | ||
Zhang XG, Zhang Z-L, Hu S-Y, Wang Y-L. Ultrasound-guided ablative therapy for hepatic malignancies: a comparison of the therapeutic effects of microwave and radiofrequency ablation. Acta Chir Belg. 2014;114(1):40–45. | ||
Qc W, Cheng W, Zhang L, Sun YX, Xing CH. Use of percutaneous sonographically guided microwave ablation therapy to treat inoperable malignant liver tumors. West Indian Med J. 2015;64:76–80. | ||
Liang P, Yu J, Lu MD, et al. Practice guidelines for ultrasound-guided percutaneous microwave ablation for hepatic malignancy. World J Gastroenterol. 2013;19(33):5430–5438. | ||
Ding J, Zhou Y, Wang Y, Jing X, Wang F, Wang Y. Percutaneous microwave ablation of exophytic tumors in hepatocellular carcinoma patients: safe or not. Liver Int. 2017;37(9):1365–1372. | ||
Yu J , Liang P . Status and advancement of microwave ablation in China. Int J Hyperthermia. 2017;33(3):278–287. | ||
Lin Z-Y, Li G-L, Chen J, Chen Z-W, Chen Y-P, Lin S-Z. Effect of heat sink on the recurrence of small malignant hepatic tumors after radiofrequency ablation. J Can Res Ther. 2016;12(7):153–C158. | ||
Tanaka T, Westphal S, Isfort P, et al. Microwave ablation compared with radiofrequency ablation for breast tissue in an ex vivo bovine udder model. Cardiovasc Intervent Radiol. 2012;35(4):914–920. | ||
Carrafiello G, Laganà D, Mangini M, et al. Microwave tumors ablation: principles, clinical applications and review of preliminary experiences. Int J Surg. 2008;6(Suppl 1):S65–S69. | ||
Huang S, Yu J, Liang P, et al. Percutaneous microwave ablation for hepatocellular carcinoma adjacent to large vessels: a long-term follow-up. Eur J Radiol. 2014;83(3):552–558. | ||
Rieder C, Weihusen A, Schumann C, Zidowitz S, Peitgen H-O. Visual support for interactive Post-Interventional assessment of radiofrequency ablation therapy. Computer Graphics Forum. 2010;29(3):1093–1102. | ||
Dou JP, Yu J, Yang XH, et al. Outcomes of microwave ablation for hepatocellular carcinoma adjacent to large vessels: a propensity score analysis. Oncotarget. 2017;8(17):28758–28768. |
 © 2019 The Author(s). This work is published and licensed by Dove Medical Press Limited. The
full terms of this license are available at https://www.dovepress.com/terms
and incorporate the Creative Commons Attribution
- Non Commercial (unported, 3.0) License.
By accessing the work you hereby accept the Terms. Non-commercial uses of the work are permitted
without any further permission from Dove Medical Press Limited, provided the work is properly
attributed. For permission for commercial use of this work, please see paragraphs 4.2 and 5 of our Terms.
© 2019 The Author(s). This work is published and licensed by Dove Medical Press Limited. The
full terms of this license are available at https://www.dovepress.com/terms
and incorporate the Creative Commons Attribution
- Non Commercial (unported, 3.0) License.
By accessing the work you hereby accept the Terms. Non-commercial uses of the work are permitted
without any further permission from Dove Medical Press Limited, provided the work is properly
attributed. For permission for commercial use of this work, please see paragraphs 4.2 and 5 of our Terms.