Back to Journals » ClinicoEconomics and Outcomes Research » Volume 10
A single blind, multicenter, randomized controlled trial to evaluate the effectiveness and cost of a novel nutraceutical (LopiGLIK®) lowering cardiovascular disease risk
Authors Manfrin A ![]() , Trimarco V, Manzi MV
, Trimarco V, Manzi MV ![]() , Rozza F
, Rozza F ![]() , Izzo R
, Izzo R ![]()
Received 9 May 2018
Accepted for publication 4 September 2018
Published 8 October 2018 Volume 2018:10 Pages 601—609
DOI https://doi.org/10.2147/CEOR.S172838
Checked for plagiarism Yes
Review by Single anonymous peer review
Peer reviewer comments 2
Editor who approved publication: Professor Samer Hamidi
Andrea Manfrin,1 Valentina Trimarco,2,3 Maria Virginia Manzi,2,4 Francesco Rozza,2,4 Raffaele Izzo2,5
1Sussex Pharmacy, School of Life Sciences, University of Sussex, Falmer, Brighton, UK; 2Hypertension Research Centre, University of Naples Federico II, Naples, Italy; 3Department of Neurosciences, Federico II University, Naples, Italy; 4Department of Advanced Biomedical Sciences, Federico II University, Naples, Italy; 5Department of Translational Medical Science Sciences, Federico II University, Naples, Italy
Context: Cardiovascular disease (CVD) costs the economy €210 billion per year in Europe. There is an association between low-density lipoprotein cholesterol (LDL-C) and CVD risk.
Objective: To evaluate the cost and effectiveness of LopiGLIK® (LOPI) in lowering LDL-C and CVD risk.
Design: Single blind multicenter randomized controlled trial; patients were divided into two groups, subjected to centralized randomization.
Setting: Four Italian regions.
Participants: Thirty-one physicians enrolled 573 adult patients with mild hypercholesterolemia between January 2016 and January 2018.
Intervention: Patients were treated for 16 weeks either with LOPI (intervention) or Armolipid Plus® (AP; control).
Outcome measures: Primary outcome: percentage of patients who achieved LDL-C <130 mg/dL. Secondary outcomes: reduction of HbA1c, survival analysis and HR linked to 38.67 mg/dL reduction of LDL-C and 1% reduction of HbA1c. Costs were assessed per unit and cure.
Results: Three hundred and seventy patients treated with LOPI and 203 treated with AP were randomized and completed the study. At baseline 8.9% (n=18) patients treated with AP and 9.5% (n=35) treated with LOPI had LDL-C levels <130 mg/dL (P=0.815). At the 16-week follow-up, 41.4% (n=84) of patients treated with AP and 67.6% (n=250) with LOPI achieved LDL-C levels <130 mg/dL (P<0.001). LOPI patients were three times more likely to achieve LDL-C levels <130 mg/dL; adjusted OR 2.97 (95% CI; 2.08–4.24; P<0.001), number needed to treat was four (95% CI; 5.60–2.90; P<0.001). Survival analysis demonstrated the superiority of LOPI vs AP relative to 38.67 mg/dL LDL-C reduction (P<0.002); HR was 0.761 (95% CI; 0.62–0.94; P<0.001). Both products reduced the HbA1c without a significant difference between them (P=0.156). Survival analysis and HR (0.91; 95% CI; 0.70–1.18) estimated for 1% HbA1c reduction, showed differences between LOPI and AP, which were not significant (P=0.411; P=0.464). The cost of LOPI was €2.11 (unit), €211 (cure), and AP €3.77 and €377, respectively.
Conclusion: LOPI appeared more effective and less expensive than AP in lowering LDL-C and CVD risk.
Trial registration: NCT02898805, September 8, 2016.
Keywords: hypercholesterolemia, nutraceuticals, effectiveness, cardiovascular risk reduction
Introduction
The WHO confirmed that cardiovascular disease (CVD) is the number one cause of death globally; 17.7 million people died in 2015, representing 31% of all global deaths.1 Statistics published in 2017 suggest that CVD is the major cause of mortality in Europe as a whole being responsible for over 3.9 million deaths a year, equivalent to 45% of all deaths.2 CVD is thus a major cause of economic and human cost for Europe.3 The latest estimates depict overall costs of CVD in Europe as €210 billion a year, where 53% (€111 billion) is due to direct health care costs, 26% (€54 billion) to productivity losses, and 21% (45€ billion) to the informal care of people with CVD. Ischemic heart disease (IHD) was estimated to cost the economy €59 billion yearly and stroke €45 billion per year. The Centre for Economic and Business Research report in 2014 provided useful information regarding the economic costs of CVD from 2014 to 2020 in six European economies (including Italy), predicting that health care costs from CVD will increase further across all economies until the end of the decade.3 Reviewing the evidence base for modifiable risk factors, the INTERHART study, conducted in 52 countries, found abnormal lipid levels to be the highest attributable risk (49%) of a myocardial infarction.4 The Framingham Heart Study demonstrated that men and women were 1.5 times more likely to develop clinically significant coronary heart disease (CHD) if their low-density lipoprotein cholesterol (LDL-C) was >160 mg/dL compared to a reference population with LDL-C <130 mg/dL.5 The epidemiologic investigations have validated LDL-C as an independent predictor of CVD risk.6 In the Atherosclerosis Risk in Communities (ARIC) study, the risk of a CHD event was elevated by ~40% for every 39 mg/dL incremental increase in LDL-C.7
The Cholesterol Treatment Trialists’ (CTT) collaboration has demonstrated that lowering LDL-C reduces the risk of major vascular events (heart attacks, stroke or coronary revascularization procedures) by approximately one fifth (20%) for each 38.67 mg/dL (38.67 mg/dL =1 mmol/L) reduction of LDL-C achieved.8
During the past decades many studies have been published on cholesterol-lowering medications, and more recently the current international guidelines for the management of dyslipidemia suggest that nutraceuticals (NUTs) can be used either as alternatives or in addition to lipid-lowering medications.9
The Italian Society of Diabetology and the Italian Society for the Study of Arteriosclerosis (SISA) suggested that the cholesterol-lowering effect of some NUTs is not only consistent, but it is also supported by a good level of scientific evidence.10 In fact, a recent systematic review and meta-analysis of randomized controlled trials, including 14 trials (1,670 subjects in the NUTs arm and 1,489 subjects in the control arm), showed that the a combination of NUTs, similar to the ones used in this study, was associated with significant reductions of plasma total cholesterol (26.15 mg/dL), LDL-C (23.85 mg/dL), triglycerides (13.83 mg/dL), and glucose levels (2.59 mg/dL), and a modest but significant increase of plasma high-density lipoprotein cholesterol levels (2.53 mg/dL).11
NUT are forms of compounds with biological activity commonly used to improve health in dosages exceeding those usually obtainable from food.12 In light of published evidence, it is advisable to suggest strategies and action plans using NUTs that could help to reduce the hazard/risk of CVD events and their associated costs to the health care system and society as well.
Aim
This study aimed to evaluate the comparative effectiveness and cost of a novel NUT product LopiGLIK® (LOPI) which contains berberine (531 mg), red yeast rice powder (220 mg; 3.3 mg monacolin K), Morus alba (200 mg), vs Armolipid Plus® (AP) (available since 2006) which contains policosanol (10 mg), red yeast rice (200 mg; 3 mg monacolin K), berberine (500 mg), astaxanthin (0.5 mg), folic acid (200 mcg), and coenzyme Q10 (2 mg). AP has a documented lipid-lowering effect in lowering LDL-C and CVD risk.13–15
The key research questions were: is LOPI more effective than AP in:
- Reducing the LDL-C levels to <130 mg/dL?
- Reducing the HR of CVD linked to 38.67 mg/dL reduction of LDL-C levels?
- Reducing the HbA1C levels by 1%?
- Reducing the HR of CVD linked to 1% reduction of HbA1c levels?
It was also relevant to assess the cost of NUTs for the duration of the treatment.
Methods
Study design
This was an experimental study, conducted using a multicenter, randomized, controlled, single blind trial design assessing the effectiveness and cost of LOPI vs AP (Figure 1).
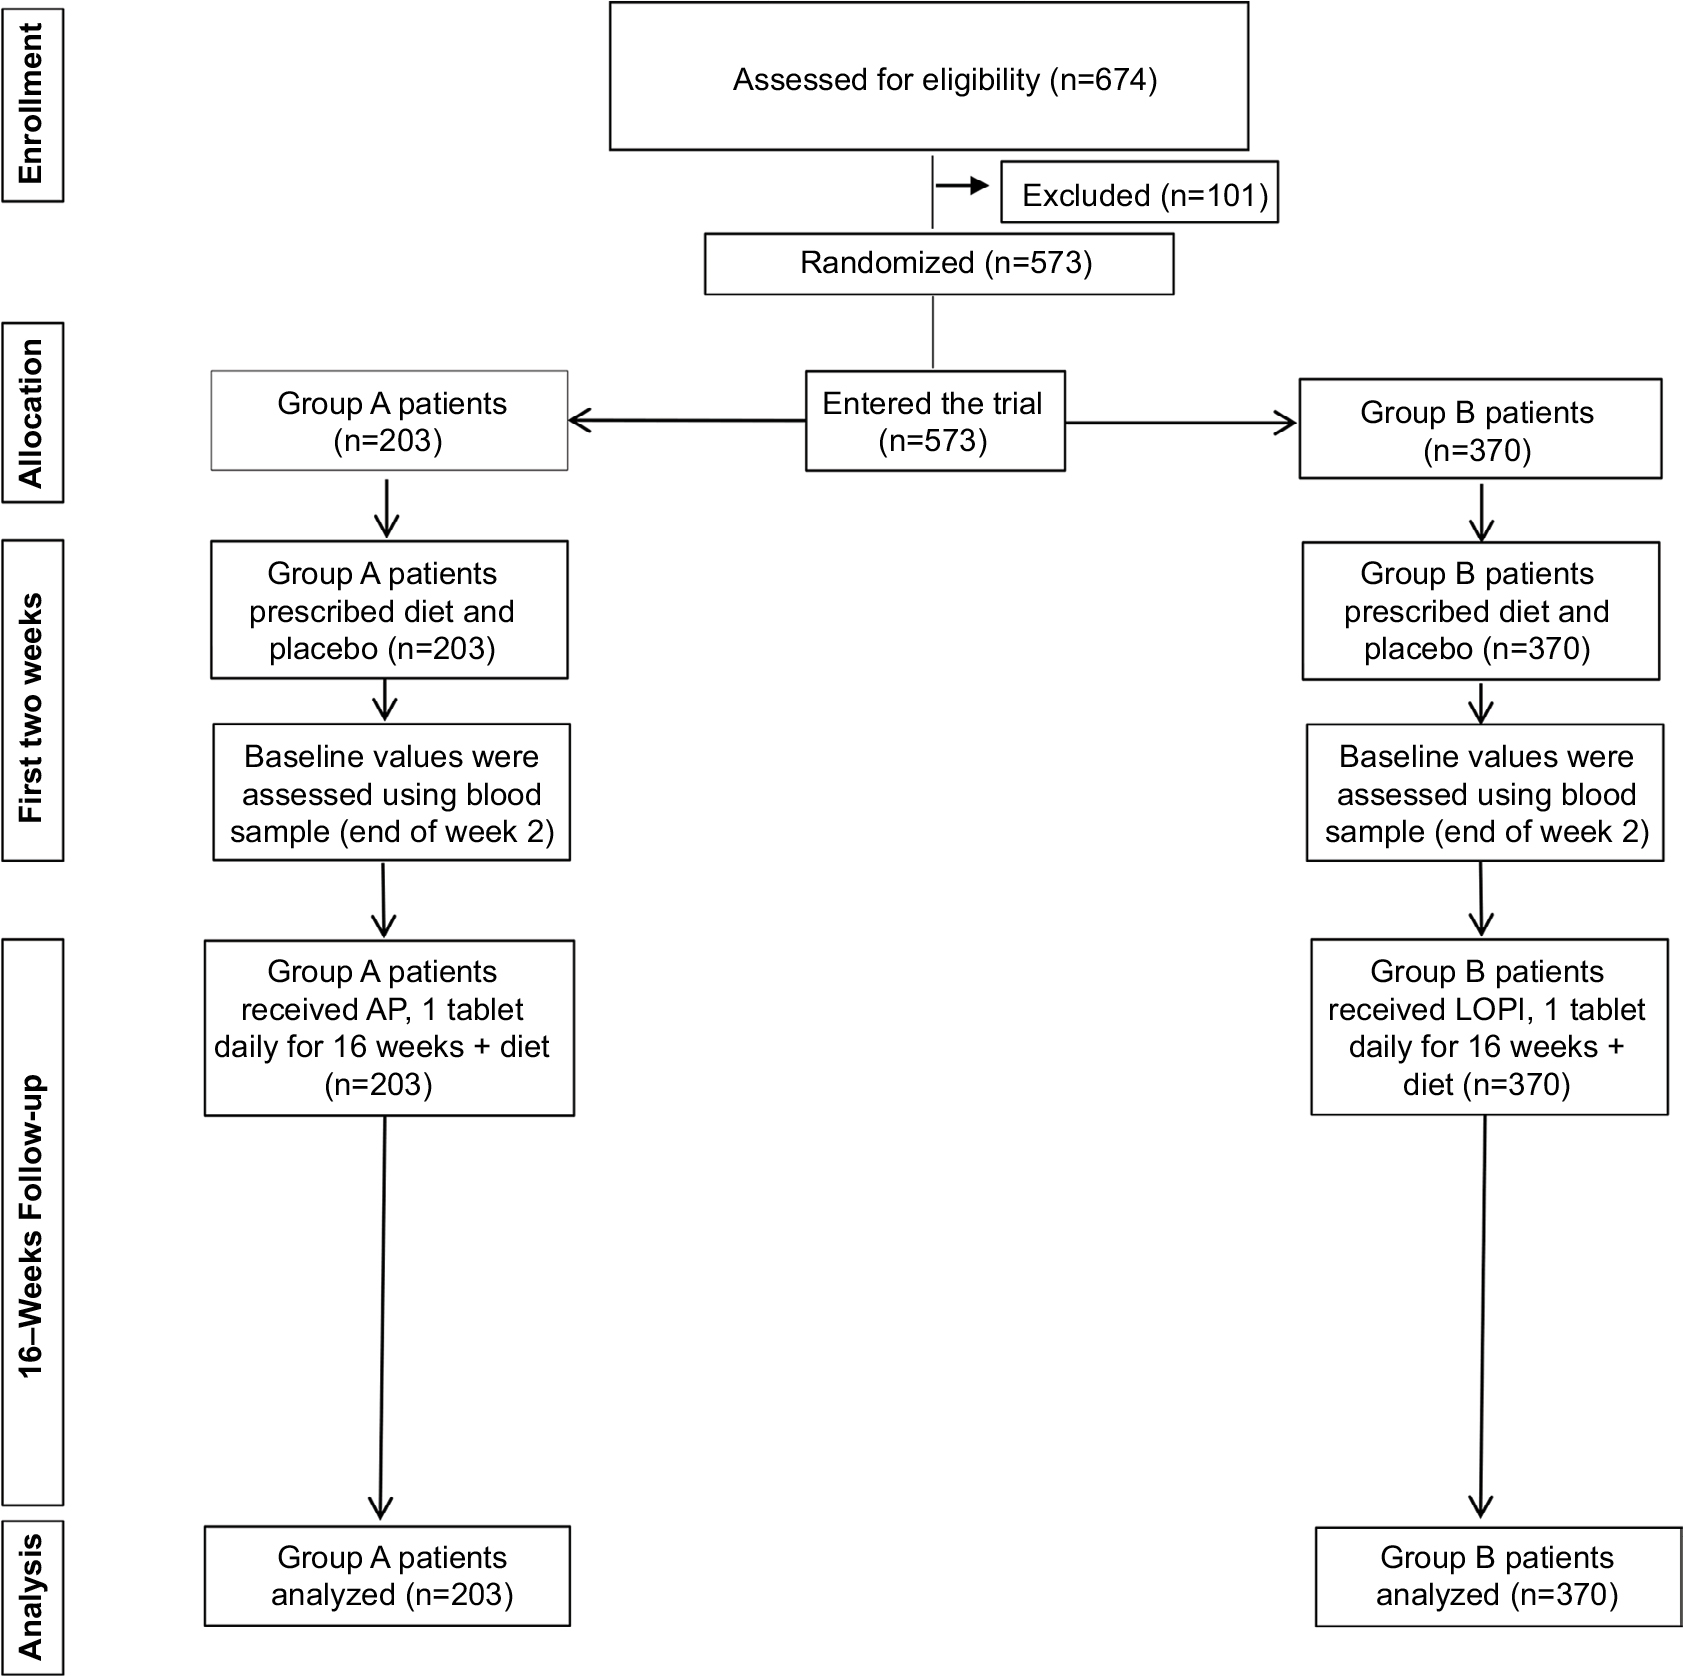 | Figure 1 CONSORT flow diagram showing the flow of patients through the study. Abbreviations: AP, Armolipid Plus®; LOPI, LopiGLIK®. |
Study timeline
The study was conducted between January 2016 and January 2018.
Intervention
Both products aimed to lower LDL-C levels. The AP-treated patients represented the control group, with LOPI-treated patients being the intervention group.
Outcome measures
Primary outcome
- Percentage of patients who achieved LDL-C <130 mg/dL.
LDL-C levels were assessed at baseline and after 16 weeks, using a threshold of LDL-C <130 mg/dL.5
Secondary outcome measures
- Survival analysis and HR linked to 38.67 mg/dL reduction of LDL-C levels;16
- HbA1c levels assessed at baseline and after 16 weeks;
- survival analysis and HR linked to 1% reduction of HbA1c levels;17,18
- the cost of treatment for each product was calculated according to the primary outcome.
Study participants
Inclusion criteria
- Age: 18–75 years of age;
- sex: all;
- healthy volunteers;
- total cholesterol <300 mg/dL;
- total cholesterol >200 mg/dL;
- cardiovascular risk <20% (according to 2016 European Guidelines on cardiovascular disease prevention).19
Exclusion criteria
- Pregnancy;
- documented intolerance to one or more components of LOPI/AP;
- previous cardiovascular events;
- familial severe dyslipidemia;
- familial high cardiovascular risk;
- hepatic or muscular disorders;
- subjects receiving any lipid-lowering drugs or NUT with lipid-lowering effect.
Patients were recruited by cardiovascular specialists and/or general practitioners; each physician was asked to recruit the first 25 consecutive adult outpatients, according to the protocol approved by the Ethics Committee of the Federico II University of Naples. The subjects were enrolled in a ratio of 50/50% male/female ±10% comparable for age, in order to obtain a proper comparison between groups with similar demographic characteristics.
Randomization, allocation, and blinding
Patients were divided into two groups (A =AP and B =LOPI) and subjected to centralized randomization at the Hypertension Outpatient Clinic at the Federico II University of Naples (Italy). The patient was the unit of randomization and intervention. During the first 2 weeks, both groups followed a prescribed diet and assumed a placebo. At the end of the 2-week period and at the end of the study, blood glucose, HbA1c, fasting insulin, transaminase levels, and creatine phosphokinase were assessed under fasting conditions. During the following 16 weeks, patients in group A took one AP tablet daily immediately after a meal, and patients in group B took one LOPI tablet daily immediately after a meal. Patients followed the prescribed diet up until the end of the study. AP and LOPI tablets were provided free of charge by AkademyPharma.
Data collection
Thirty-one physicians working in different settings (hospital, university, general practice) collected data from patients in four regions, Basilicata, Campania, Emilia Romagna, and Toscana.
Interim analysis
An interim analysis was published elsewhere.20
Data analysis
The percentage of missing values was 4.6%, data were missing at random and a multiple imputation technique was applied for replacing missing data.21
Each variable was analyzed using the Kolmogorov–Smirnov test to check for normality; data were not normally distributed. Differences between groups (AP and LOPI) were assessed using Mann–Whitney U test for continuous variables, and Wilcoxon sign rank test was used for within-group comparison. Chi square test for independence was used for categorical variables. The procedures were performed according to McCrum-Gardner (2008).22
Analysis of the primary outcome
The primary outcome, reduction of LDL-C levels, was analyzed using a semi-parametric technique called general estimating equations (GEE), as suggested by Velentgas et al.23 Binary logistic analysis was used, dichotomizing the primary outcome into reduced (LDL-C level <130 mg/dL) and not-reduced (LDL-C level ≥130 mg/dL). The GEE model was used without adjustment, and then adjusted using the LDL-C values obtained at baseline. The relative risk (RR), the relative risk reduction (RRR), the absolute risk reduction (ARR), and the number needed to treat (NNT) were calculated using a bespoke Excel model. The results of the model were compared to the results obtained using two online calculators: 1) Centre for Evidence-Based Medicine of Toronto which also provided significance levels (P-value) and 95% CIs,24 2) BMJ EBM toolbox statistical calculator.25
Analysis of the secondary outcomes
The survival analysis was conducted using the Kaplan–Meier curve, with the log-rank (Mantel–Cox) option, aiming to estimate the survival curve, using 38.67 mg/dL of LDL-C reduction and 1% reduction of HbA1c as events of interest (censored data). The HR (also called instantaneous risk) which in our specific case could be considered equivalent to the RR of each outcome, was calculated using the Cox proportional hazards regression analysis for LDL-C and for the HbA1c adopting the same threshold of 38.67 mg/dL and 1% HbA1c respectively.
A therapy or medication is deemed to be cost effective when the outcome is worth the cost relative to competing alternatives. In our case, due to economic and time constraints, it was not possible to collect direct medical costs, non-direct medical costs, and all indirect costs, but we assumed that these costs were similar. The only available cost during the study was the cost of the two NUTs, which were sold at the same price: €21.90 for a box of 20 tablets. The number of tablets needed for each patient for the entire duration of the study (16 weeks) was 112; the cost per patient was €122.64.
Both products were available from community pharmacies as over-the-counter medications but were neither paid for nor reimbursed by the Italian National Health Service.
The primary outcome was used for the calculation of the cost per unit and per cure, and the cost was based only on the price of the NUT. Bang and Zhao (2012) suggested that the cost per unit and per cure conveys an intuitive meaning and interpretation that even lay persons can understand, but they added that this approach could be less relevant to health economics and decision-makers.26
Product safety
A previous study assessed the safety and tolerability profiles of the two products concluding that they were similar.12 In this trial, safety was assessed by a specific questionnaire and clinical examination at each visit and by laboratory tests at the end of the run-in period and at the end of the study.
All analyses were conducted using the intention-to-treat approach and P<0.05 was considered statistically significant. Data analysis was performed using SPSS IBM version 24 and Excel for MS Office 2016.
Results
The number of patients randomized was 573; 370 received LOPI and 203 AP, resulting in a 2:1 randomization ratio (Figure 1). A post hoc power calculation was conducted using G*Power version 3.1.93 (Allgemeine Psychologie und Arbeitspsychologie, Dusseldorf, Germany); the power attained by the study was >99% with an effect size (Cohen’s d) of 0.53, using a difference between the mean (mean rank) of 13 and alpha 0.05 (single-tailed, directional).
Baseline characteristics
The number of female patients was 113 (55.7%) in the AP group and 207 (55.9%) in the LOPI group. Nineteen different items were assessed at baseline and only one, the level of HbA1c, presented a statistically significant difference (Table 1).
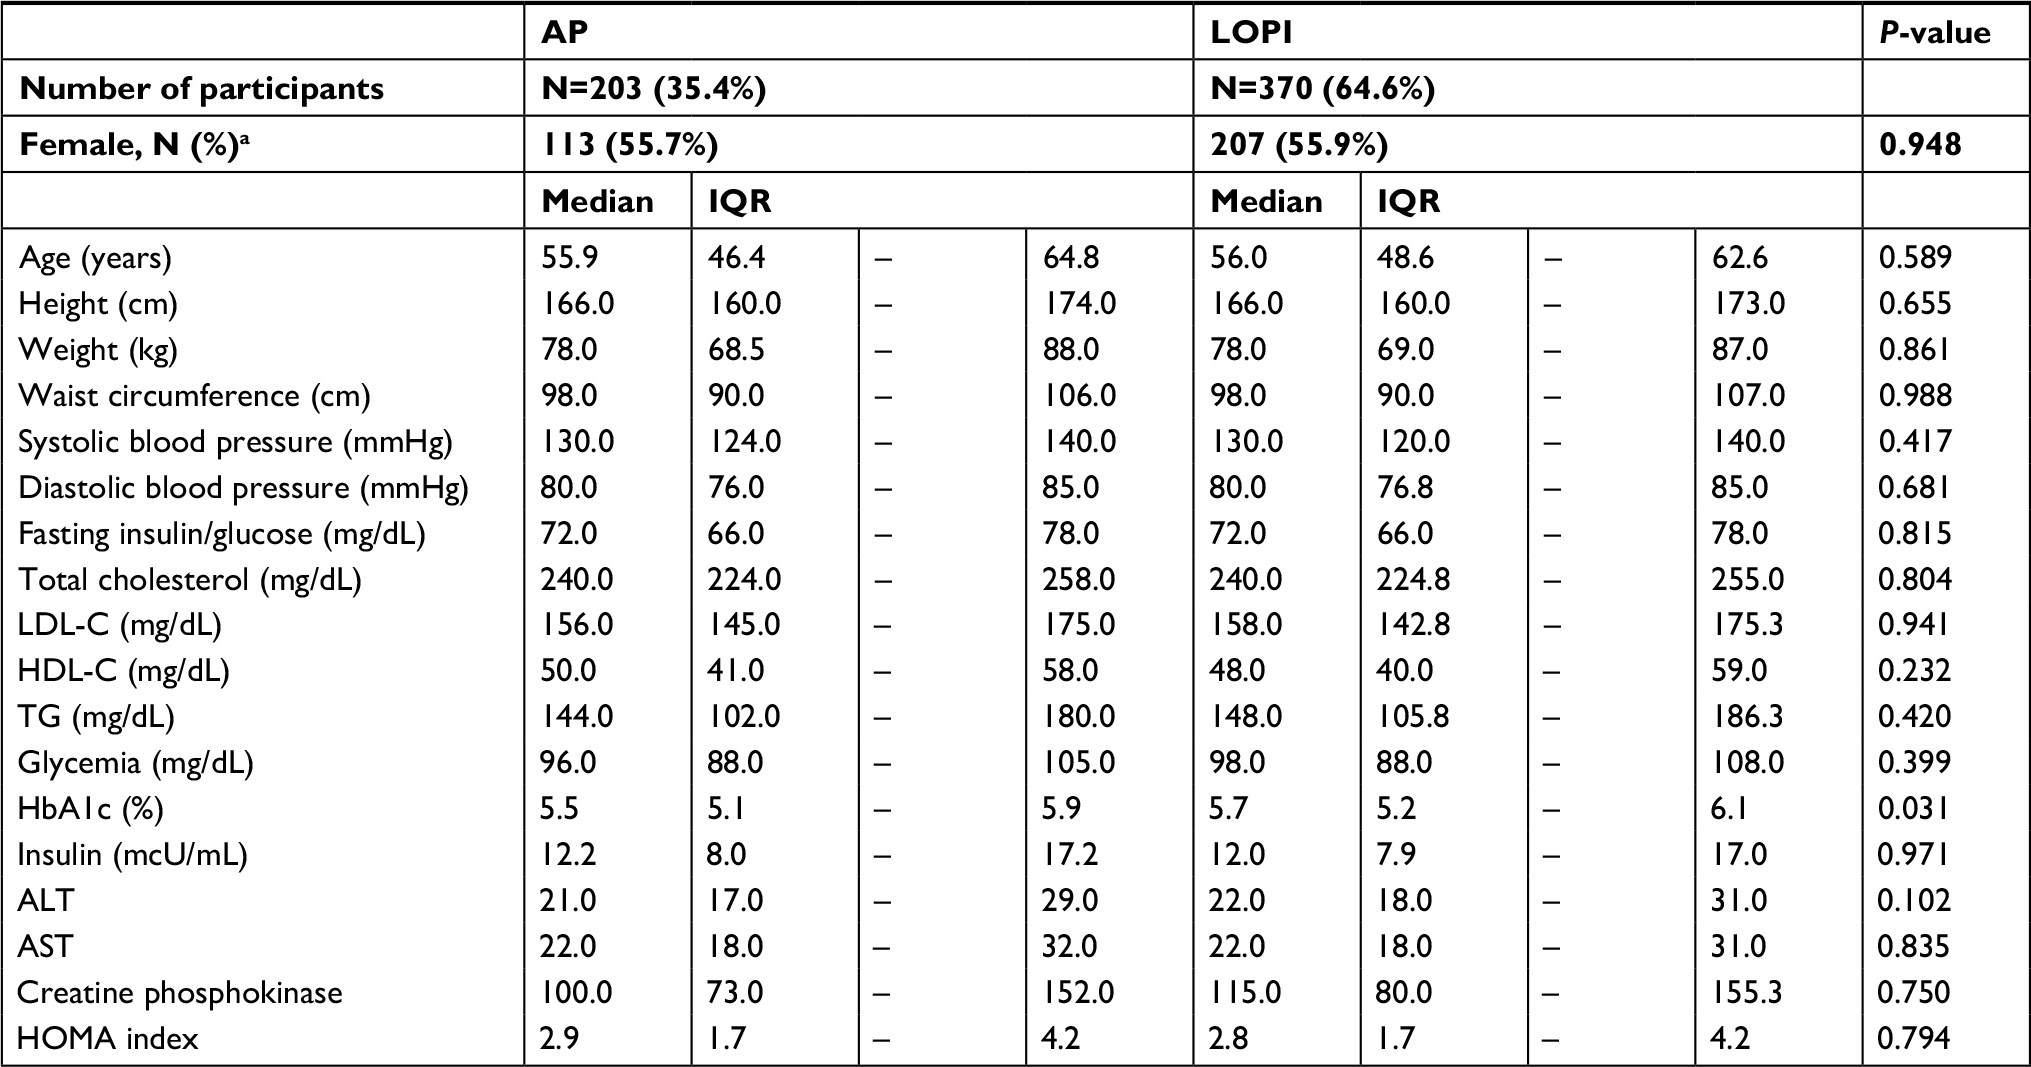 | Table 1 Baseline characteristics Abbreviations: AP, Armolipid Plus®; HDL-C, high-density lipoprotein cholesterol; HOMA, homeostatic model assessment; LDL-C, low-density lipoprotein cholesterol; TG, triglycerides; LOPI, LopiGLIK®. Notes: Mann–Whitney U test, median, interquartile range (IQR); achi-square test; fasting insulin/glucose (mg/dL) = ratio; glycemia (mg/dL) = fasting blood sugar. |
Primary outcome
Percentage of patients who achieved LDL-C <130 mg/dL
The percentage of patients with LDL-C <130 mg/dL at baseline was 8.9% (18/203) in the AP group and 9.5% (35/370) in the LOPI group (P=0.815). At the end of the study 41.4% (84/203) of patients treated with AP and 67.6% (250/370) with LOPI achieved an LDL-C <130 mg/dL; this difference was statistically significant (P<0.001). The GEE analysis showed that patients in the LOPI group were almost three times more likely to achieve the target LDL-C levels (<130 mg/dL). The unadjusted OR for the LOPI group was 2.95 (95% CI 2.07–4.20; P<0.001), the adjusted OR was 2.97 (95% CI 2.08–4.24; P<0.001). The percentage increase in patients with LDL-C levels <130 mg/dL was 63% higher in the LOPI compared to the AP group. The evidence-based medicine (EBM) analysis showed that RR was 1.63 (95% CI; 1.40–2.00), the RRR was 63.30% (95% CI; 36.60–95.20), the ARR was 26.20% (95% CI; 17.90–34.50), and the NNT was 4 (95% CI; 5.60–2.90; P<0.001).
Secondary outcomes
Survival analysis and HR of CVD linked to 38.67 mg/dL reduction of LDL-C levels
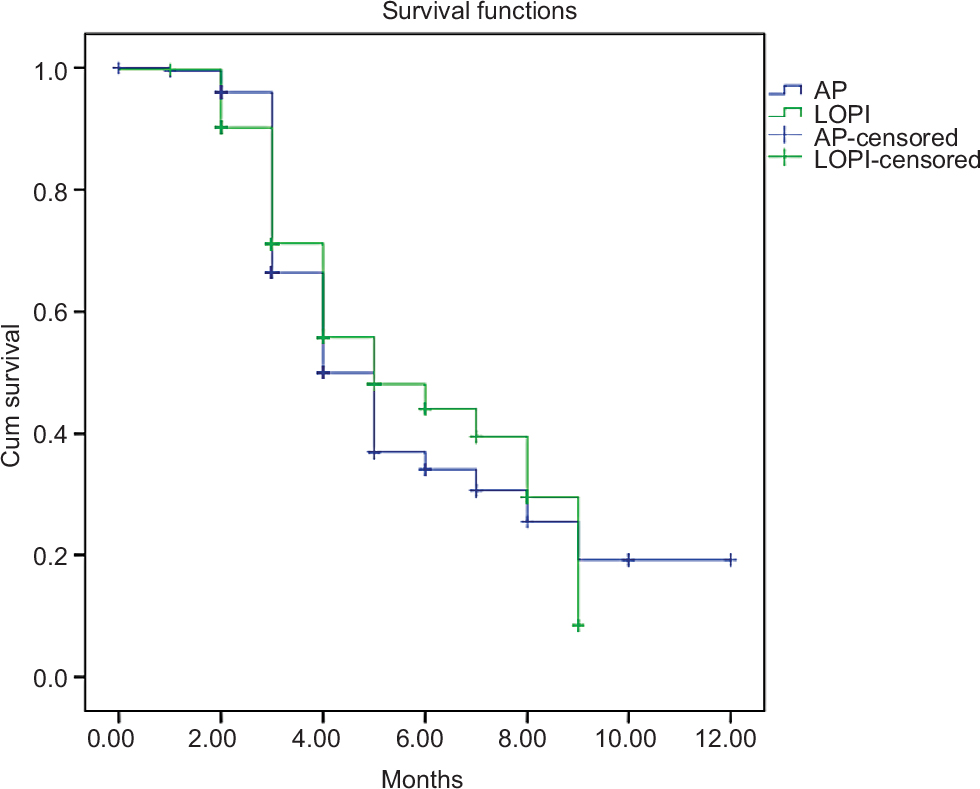
The percentage of patients who achieved a 38.67 mg/dL reduction of LDL-C levels was 25.6% (52/203) in the AP group and 42.2% (156/370) in the LOPI group; this difference was statistically significant (P<0.001). The Kaplan–Meier survival curve (Figure 2) depicts the superiority of LOPI compared to AP and the application of the log-rank test (Mantel–Cox) demonstrated a statistically significant difference between the two products (P<0.002).
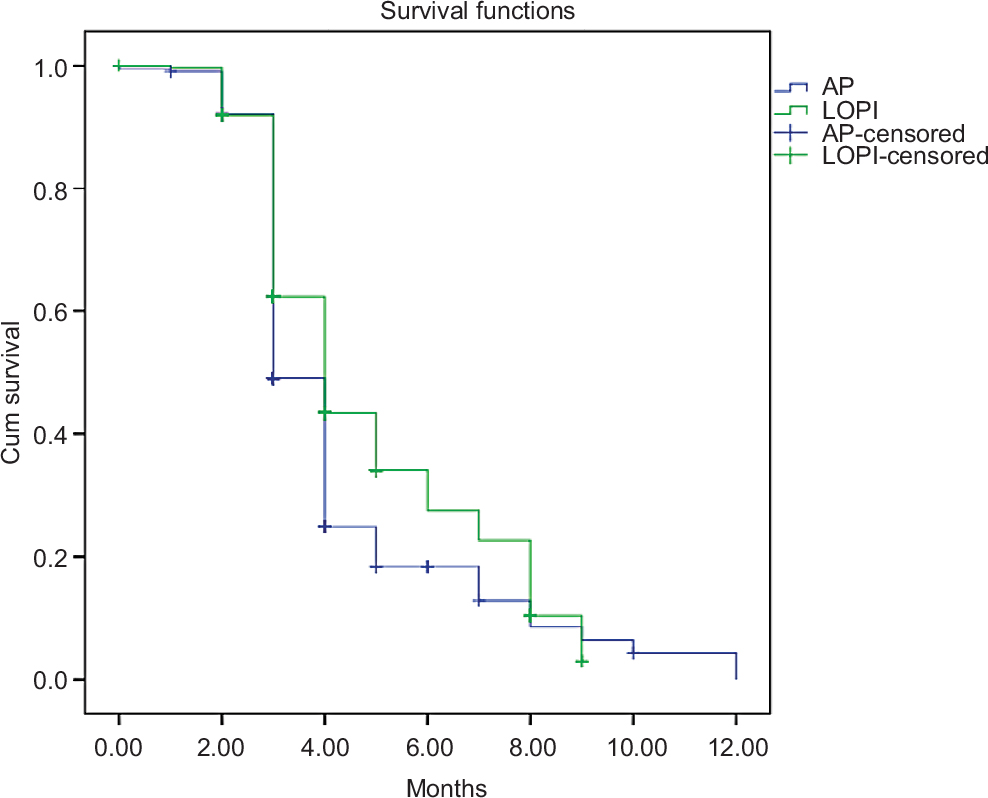 | Figure 2 Kaplan–Meier curve showing effect of LOPI and AP on 38.67 mg/dL LDL-C reduction. Abbreviations: AP, Armolipid Plus®; LDL-C, high-density lipoprotein cholesterol; LOPI, LopiGLIK®. |
The HR was 0.761 (95% CI; 0.62–0.94), meaning that patients in the LOPI group reduced their risk of LDL-C being >38.67mg/dL by 23.9% compared to the AP group (P<0.011).
HbA1c levels assessed at baseline and after 16 weeks
Both treatments produced a statistically significant reduction at 16 weeks (P<0.001) as shown in Table 2, but a statistically significant difference between the two groups was not found at the end of the study (P=0.156). A 1% reduction of HbA1c was achieved in the AP group by 54.7% (111/203) of the patient population, in the LOPI group this value was achieved by 57.8% (214/370); this difference was not statistically significant (P=0.466).
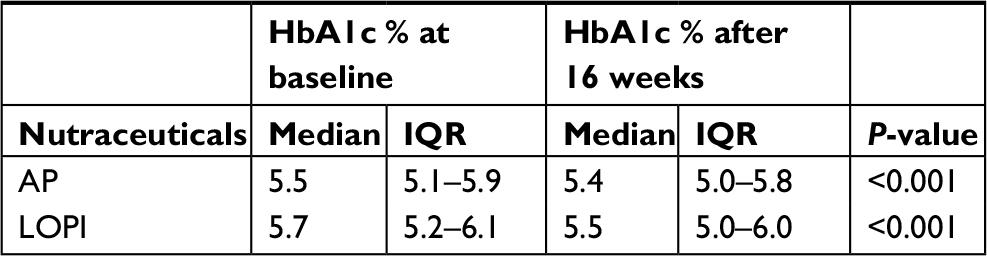 | Table 2 HbA1c levels at baseline and at 16 weeks according to each nutraceutical Notes: Wilcoxon sign rank test. Median/IQR. Abbreviations: AP, Armolipid Plus®; IQR, interquartile range; LDL-C, high-density lipoprotein cholesterol; LOPI, LopiGLIK®. |
Survival analysis and HR of CVD linked to 1% reduction of HbA1c levels
The Kaplan–Meier survival curve (Figure 3) has shown a difference between LOPI and AP groups, which was not statistically significant (P=0.411).
 | Figure 3 Kaplan–Meier curve showing effect of LOPI and AP on 1% reduction of HbA1c. Abbreviations: AP, Armolipid Plus®; LOPI, LopiGLIK®. |
Cox proportional hazards regression analysis provided an HR of 91% or 0.91 (95% CI, 0.70–1.18), meaning that the patients in the LOPI group reduced by 9% their risk of having their HbA1c 1% higher compared to the other group; this result was not statistically significant (P=0.464).
Costs
The cost per unit of intervention was €2.11 (€122.64/58.1%) for LOPI, and €3.77 (€122.64/41.4%) for AP. The cost per cure was €211 for LOPI and €377 for AP; 58.1% and 32.5% were the differences between the percentages of people who had LDL-C <130 mg/dL at baseline and at the end of the study for each product.
Safety
Ten side effects were recorded: three in the LOPI group (0.8%) and seven in the AP group (3.4%) (P=0.041). The subjects in the LOPI group reported myalgia (two cases) and constipation (one case), while those in the AP group complained of myalgia (two cases), diarrhea (two cases), nausea (two cases), and itch (one case).
Discussion
Reduction of LDL-C and HbA1c
The results of this single blind, multicenter, randomized controlled trial confirm the efficacy of NUTs in lowering plasma lipid levels. AP and LOPI had an important effect on the primary outcome: reduction of LDL-C levels <130 mg/dL. At baseline there was no statistical difference between the percentages of patients in the two groups with LDL-C <130 mg/dL. At the end of the study, a strong statistical difference was found between the two groups of patients (P<0.001). The percentage of patients who achieved LDL-C levels <130 mg/dL was 26% higher in the LOPI group. The effectiveness analysis showed evidence of the superiority of LOPI compared to AP. LOPI patients were three times more likely to achieve LDL-C levels <130 mg/dL; NNT was 4.
It has been suggested that the superior effectiveness of LOPI could be linked to the presence of Morus alba, which may contribute to the enhanced cholesterol-lowering action.12 At the end of the study, there was a statistically significant reduction in the HbA1c levels in both groups. LOPI showed a greater difference between the median HbA1c levels at baseline and at the end of the study (5.7%–5.5%=0.2%) compared to AP (5.5%–5.4%=0.1%). Both products achieved a 1% HbA1c reduction, but the difference between groups (AP vs LOPI) was not statistically significant.
Clinical and economic implication of 38.67 mg/dL LDL-C reduction and 1% HbA1c reduction on CVD risk
The survival analysis and the HR linked to 38.67 mg/dL LDL-C reduction demonstrated the superiority of LOPI vs AP. A statistically significant difference was found with LOPI reducing the risk of increased LDL-C >38.67 mg/dL by 24% compared to AP.
The results of very large, systematic literature review and meta-analysis including 312,175 patients from 49 trials suggested that the RR for major vascular event per 38.67 mg/dL reduction of LDL-C was 0.77 (95% CI; 0.71–0.84; P<0.001).16 In our study, the reduction of 38.67 mg/dL provided an HR (instantaneous risk reduction) of 0.76 (95% CI; 0.62–0.94; P<0.011) in the LOPI group. A series of studies conducted between 1980 and 2010, one in the US27 and in Canada,28 eight in Europe,29–36 estimated that 19%–46% of the total reduction in the rate of CHD mortality was explained by the reduction in total cholesterol levels. As previously mentioned, it has been demonstrated that for each 38.67 mg/dL reduction of LDL-C achieved, the risk of CVD is reduced by 20%.8 The EUROASPIRE III health economic project demonstrated that prevention is cost-effective.37 Therefore, reducing the risk means reducing the costs. Some observational studies have suggested that higher HbA1c levels were associated with CVD and death.38–40 It has been demonstrated that every 1% increment of HbA1c was positively associated with the risk of total CVD (HR: 1.2, 95% CI; 1.08–1.34) and the risk of death (HR: 1.12, 95% CI; 1.03–1.26).41 In our study, LOPI reduced the HR by 9% (HR =0.91) compared to AP, but this reduction was not statistically significant.
Costs
While the two products had the same retail price, the cost per unit of intervention and per cure of LOPI was 44% lower than AP; for this reason, we can assume that LOPI provides better value for money. Cost of treatments are a hot topic today, because public/private payers and providers are always looking for the best medication or treatment in clinical and economic terms.
Safety
Both products have shown similar safety profiles.
Strengths and limitations
This study aimed to assess the difference between two NUT products, it was appropriately powered, and conducted in four Italian regions. The patient was the unit of randomization and the unit of intervention, but the randomization was 2:1 and not 1:1 which is considered the best randomization ratio. In fact, some differences may arise between equal or unequal randomization. Equal randomization (1:1) is statistically the most efficient method because, for any given total sample size the most power to detect a difference is achieved with equal group size. Unequal randomization (2:1 as in our case) can be justified by practical reasons such as to minimize the exposure to a new treatment or for cost implications because 1:1 is usually a more expensive option. Nevertheless, the power achieved in our study was very high. The length of treatment during the study (16 weeks) could also be a source of bias because many studies are conducted for longer periods of time. A short study providing a short follow-up, could increase or decrease possible changes in the primary and secondary outcomes. It was not possible to conduct a health economic evaluation because direct medical costs, direct non-medical costs, and all the costs incurred by the patients were not gathered during the study. Furthermore, it was deemed too expensive and time consuming to build an economic model using secondary data. NUTs is a new growing area of interest in Italy and in the rest of Europe, and to the best of our knowledge, there have been no health economic studies conducted in Italy in this regard, which could have informed our model.
The results of this study support the conclusion of other studies that suggest NUTs can be used as alternatives to lipid-lowering medications.9,11
Our results are in line with the SISA guidelines, which suggest that the cholesterol-lowering effect of some NUTs is consistent, and it is supported by scientific evidence.10
This study provides evidence of the clinical superiority of LOPI compared to AP in lowering LDL-C and CVD risk, showing better value for money as well.
Conclusion
The European Cardiovascular Disease Statistics 20172 and the economic costs of CVD from 2014 to 2020 in six European economies3 have suggested that the cost of CVDs are going to increase in Europe. Therefore, a NUT that lowers the CVD risk and is potentially value for money, could be an asset for patients, practitioners, health care system and the society as well.
This study has also uncovered a new need: health economic evaluation in the area of NUTs.
Availability of data and materials
Data supporting the conclusions of this article can be found in the repository of Hypertension Research Centre of Federico University II of Naples.
Consent for publication
Written consent for publishing the results was obtained from the participants before their enrollment in the study.
Ethics approval and consent to participate
This study was conducted according to the principles expressed in the Declaration of Helsinki and approved by the Ethics Committee of the University of Napoli Federico II with reference number 53_2015. Written informed consent for participation in the trial was obtained from patients before their enrollment in the study.
Acknowledgments
The authors are grateful to the Italian general practitioners, hospital consultants, and patients for their participation in this study, and to Professor Bugewa Apampa for editing the manuscript. This trial was funded by AkademyPharma. Trial protocol: https://clinicaltrials.gov/ct2/show/NCT02898805.
Disclosure
The authors report no conflicts of interest in this work.
References
World Health Organization. Cardiovascular diseases (CVDs) [webpage on the Internet]; 2015. Available from: http://www.who.int/mediacentre/factsheets/fs317/en/. Accessed April 3, 2018. | ||
Wilkins E, Wilson L, Wickramasinghe K. European Cardiovascular Disease Statistics 2017 edition. Brussels: European Heart Network; 2017. | ||
Bernik S, Davis C. Centre for Economic and Business Research (cebr). The economic costs of CVD from 2014-2020 in six European economies; 2014. Available from: http://www.sanita24.ilsole24ore.com/pdf2010/Sanita2/_Oggetti_Correlati/Documenti/Dibattiti-e-Idee/3Cebr%20-%20The%20economic%20cost%20of%20cardiovascular%20disease%20from%202014-2020%20in%20six%20European%20economies.pdf?uuid=AbV1x4QK. Accessed March 15, 2018. | ||
Yusuf S, Hawken S, Ounpuu S, et al. Effect of potentially modifiable risk factors associated with myocardial infarction in 52 countries (the INTERHEART study): case-control study. Lancet. 2004;364(9438):937–952. | ||
Wilson PW, D’Agostino RB, Levy D. Prediction of coronary heart disease using risk factor categories Circulation. 1998;97:1837–1847. | ||
Wadhera RK, Steen DL, Khan I, Giugliano RP, Foody JM. A review of low-density lipoprotein cholesterol, treatment strategies, and its impact on cardiovascular disease morbidity and mortality. J Clin Lipidol. 2016;10(3):472–489. | ||
Sharrett AR, Ballantyne CM, Coady SA, et al. Coronary heart disease prediction from lipoprotein cholesterol levels, triglycerides, lipoprotein(a), apolipoproteins A-I and B, and HDL density subfractions: The Atherosclerosis Risk in Communities (ARIC) Study. Circulation. 2001;104(10):1108–1113. | ||
Clinical Trials Service Unit Epidemiological Studies Unit. CTT: Cholesterol Treatment Trialists’ Collaboration. Nuffield Department of Population and Health. unit. Available from: https://www.ctsu.ox.ac.uk/research/ctt. Accessed March 14. 2018. | ||
Catapano AL, Graham I, de Backer G, et al. 2016 ESC/EAS Guidelines for the Management of Dyslipidaemias. Eur Heart J. 2016;37(39):2999–3058. | ||
Pirro M, Vetrani C, Bianchi C, Mannarino MR, Bernini F, Rivellese AA. Joint position statement on “Nutraceuticals for the treatment of hypercholesterolemia” of the Italian Society of Diabetology (SID) and of the Italian Society for the Study of Arteriosclerosis (SISA). Nutr Metab Cardiovasc Dis. 2017;27(1):2–17. | ||
Pirro M, Mannarino MR, Bianconi V, et al. The effects of a nutraceutical combination on plasma lipids and glucose: A systematic review and meta-analysis of randomized controlled trials. Pharmacol Res. 2016;110:76–88. | ||
Trimarco V, Izzo R, Stabile E, et al. Effects of a new combination of nutraceuticals with Morus alba on lipid profile, insulin sensitivity and endotelial function in dyslipidemic subjects. A cross-over, randomized, double-blind trial. High Blood Press Cardiovasc Prev. 2015;22(2):149–154. | ||
Ruscica M, Gomaraschi M, Mombelli G, et al. Nutraceutical approach to moderate cardiometabolic risk: results of a randomized, double-blind and crossover study with Armolipid Plus. J Clin Lipidol. 2014;8(1):61e8–68. | ||
Millán J, Cicero AF, Torres F, Anguera A. Effects of a nutraceutical combination containing berberine (BRB), policosanol, and red yeast rice (RYR), on lipid profile in hypercholesterolemic patients: A meta-analysis of randomised controlled trials. Clin Investig Arterioscler. 2016;28(4):178–187. | ||
Barrios V, Escobar C, Cicero AF, et al. A nutraceutical approach (Armolipid Plus) to reduce total and LDL cholesterol in individuals with mild to moderate dyslipidemia: Review of the clinical evidence. Atheroscler Suppl. 2017;24:1–15. | ||
Silverman MG, Ference BA, Im K, et al. Association Between Lowering LDL-C and Cardiovascular Risk Reduction Among Different Therapeutic Interventions: A Systematic Review and Meta-analysis. JAMA. 2016;316(12):1289. | ||
Khaw KT, Wareham N, Bingham S, Luben R, Welch A, Day N. Association of hemoglobin A1c with cardiovascular disease and mortality in adults: the European prospective investigation into cancer in Norfolk. Ann Intern Med. 2004;141(6):413–420. | ||
Chen Y-Y, Lin Y-J, Chong E, et al. The Impact of Diabetes Mellitus and Corresponding HbA1c Levels on the Future Risks of Cardiovascular Disease and Mortality: A Representative Cohort Study in Taiwan. PLoS One. 20152015;10(4):e0123116. | ||
Lüscher TF. Prevention is better than cure: the new ESC Guidelines. Eur Heart J. 2016;37(29):2291–2293. | ||
Trimarco V, Battistoni A, Tocci G, et al. Single blind, multicentre, randomized, controlled trial testing the effects of a novel nutraceutical compound on plasma lipid and cardiovascular risk factors: results of the interim analysis. Nutr Metab Cardiovasc Dis. 2017;27(10):850–857. | ||
Sterne JA, White IR, Carlin JB, et al. Multiple imputation for missing data in epidemiological and clinical research: potential and pitfalls. BMJ. 2009;338(1):b2393–b2393. | ||
Mccrum-Gardner E. Which is the correct statistical test to use? Br J Oral Maxillofac Surg. 2008;46(1):38–41. | ||
Velentgas P, Dreyer NA, Nourjah P. Developing a Protocol for Observational Comparative Effectiveness Research: A User’s Guide. AHRQ Publication No. 12(13)-EHC099. Rockville, MD: Agency for Healthcare Research and Quality; 2013:135–144. Available from: https://www.ncbi.nlm.nih.gov/books/NBK126190/pdf/Bookshelf_NBK126190.pdf. Accessed December 12, 2015. | ||
The Canadian Institute of Health research (CIHR). Centre for Evidence-Based Medicine Toronto. KT Clearinghouse. Available from: https://ebm-tools.knowledgetranslation.net/calculator. Accessed February 23, 2018. | ||
BMJ Clinical Evidence. Available from: http://clinicalevidence.bmj.com/x/set/static/cms/statistics-calculator.html. Accessed February 23, 2018. | ||
Bang H, Zhao H. Average cost-effectiveness ratio with censored data. J Biopharm Stat. 2012;22(2):401–415. | ||
Ford ES, Ajani UA, Croft JB, et al. Explaining the decrease in U.S. deaths from coronary disease, 1980-2000. N Engl J Med. 2007;356(23):2388–2398. | ||
Wijeysundera HC, Machado M, Farahati F, et al. Association of temporal trends in risk factors and treatment uptake with coronary heart disease mortality, 1994-2005. JAMA. 2010;303(18):1841–1847. | ||
Björck L, Rosengren A, Bennett K, Lappas G, Capewell S. Modelling the decreasing coronary heart disease mortality in Sweden between 1986 and 2002. Eur Heart J. 2009;30(9):1046–1056. | ||
Bandosz P, O’Flaherty M, Drygas W, et al. Decline in mortality from coronary heart disease in Poland after socioeconomic transformation: modelling study. BMJ. 2012;344:d8136. | ||
Flores-Mateo G, Grau M, O’Flaherty M, et al. Analyzing the coronary heart disease mortality decline in a Mediterranean population: Spain 1988-2005. Rev Esp Cardiol. 2011;64(11):988–996. | ||
Hughes J, Kee F, O’Flaherty M, et al. Modelling coronary heart disease mortality in Northern Ireland between 1987 and 2007: broader lessons for prevention. Eur J Prev Cardiol. 2013;20(2):310–321. | ||
Aspelund T, Gudnason V, Magnusdottir BT, et al. Analysing the large decline in coronary heart disease mortality in the Icelandic population aged 25-74 between the years 1981 and 2006. PLoS One. 2010;5(11): e13957. | ||
Palmieri L, Bennett K, Giampaoli S, Capewell S. Explaining the decrease in coronary heart disease mortality in Italy between 1980 and 2000. Am J Public Health. 2010;100(4):684–692. | ||
Hotchkiss JW, Davies CA, Dundas R, et al. Explaining trends in Scottish coronary heart disease mortality between 2000 and 2010 using IMPACTSEC model: retrospective analysis using routine data. BMJ. 2014;348:g1088. | ||
Bajekal M, Scholes S, Love H, et al. Analysing recent socioeconomic trends in coronary heart disease mortality in England, 2000-2007: a population modelling study. PLoS Med. 2012;9(6):e1001237. | ||
de Smedt D, Kotseva K, de Bacquer D, et al. Cost-effectiveness of optimizing prevention in patients with coronary heart disease: the EUROASPIRE III health economics project. Eur Heart J. 2012;33(22):2865–2872. | ||
Eeg-Olofsson K, Cederholm J, Nilsson PM, et al. New aspects of HbA1c as a risk factor for cardiovascular diseases in type 2 diabetes: an observational study from the Swedish National Diabetes Register (NDR). J Intern Med. 2010;268(5):471–482. | ||
Selvin E, Steffes MW, Zhu H, et al. Glycated hemoglobin, diabetes, and cardiovascular risk in nondiabetic adults. N Engl J Med. 2010;362(9):800–811. | ||
Oh HG, Rhee EJ, Kim TW, et al. Higher glycated hemoglobin level is associated with increased risk for ischemic stroke in non-diabetic Korean male adults. Diabetes Metab J. 2011;35(5):551–557. | ||
Chen YY, Lin YJ, Chong E, et al. The impact of diabetes mellitus and corresponding HbA1c levels on the future risks of cardiovascular disease and mortality: a representative cohort study in Taiwan. PLoS One. 2015;10(4):e0123116. |
 © 2018 The Author(s). This work is published and licensed by Dove Medical Press Limited. The
full terms of this license are available at https://www.dovepress.com/terms
and incorporate the Creative Commons Attribution
- Non Commercial (unported, 3.0) License.
By accessing the work you hereby accept the Terms. Non-commercial uses of the work are permitted
without any further permission from Dove Medical Press Limited, provided the work is properly
attributed. For permission for commercial use of this work, please see paragraphs 4.2 and 5 of our Terms.
© 2018 The Author(s). This work is published and licensed by Dove Medical Press Limited. The
full terms of this license are available at https://www.dovepress.com/terms
and incorporate the Creative Commons Attribution
- Non Commercial (unported, 3.0) License.
By accessing the work you hereby accept the Terms. Non-commercial uses of the work are permitted
without any further permission from Dove Medical Press Limited, provided the work is properly
attributed. For permission for commercial use of this work, please see paragraphs 4.2 and 5 of our Terms.