Back to Journals » Therapeutics and Clinical Risk Management » Volume 14
A restrictive dose of crystalloids in patients during laparoscopic cholecystectomy is safe and cost-effective: prospective, two-arm parallel, randomized controlled trial
Authors Belavić M ![]() , Sotošek Tokmadžić V, Brozović Krijan A, Kvaternik I
, Sotošek Tokmadžić V, Brozović Krijan A, Kvaternik I ![]() , Matijaš K, Strikić N, Žunić J
, Matijaš K, Strikić N, Žunić J
Received 25 December 2017
Accepted for publication 16 March 2018
Published 19 April 2018 Volume 2018:14 Pages 741—751
DOI https://doi.org/10.2147/TCRM.S160778
Checked for plagiarism Yes
Review by Single anonymous peer review
Peer reviewer comments 2
Editor who approved publication: Professor Garry Walsh
Matija Belavić,1 Vlatka Sotošek Tokmadžić,2 Antonija Brozović Krijan,1 Ines Kvaternik,1 Kristina Matijaš,1 Nedjeljko Strikić,3,4 Josip Žunić1,4
1Department of Anesthesiology, Reanimatology, and Intensive Medicine, Karlovac General Hospital, Karlovac, Croatia; 2Department of Anesthesiology, Reanimatology, and Intensive Care, Faculty of Medicine, University of Rijeka, Rijeka, Croatia; 3Department of Abdominal Surgery, Karlovac General Hospital, Karlovac, Croatia; 4Department of Nursing Science, Karlovac University of Applied Sciences, Karlovac, Croatia
Purpose: There are no evidence-based guidelines for volume replacement during surgical procedures such as laparoscopic cholecystectomy. However, the administration of a restrictive volume of crystalloids could be more cost-effective and safe. This trial aimed to determine the effectiveness and safety of a restrictive regimen of crystalloids in patients during laparoscopic cholecystectomy by analyzing its cost-effectiveness and 1-year morbidity rate.
Patients and methods: In this randomized, prospective study, patients were assigned to one of three groups based on the volume of fluid administered: the restrictive group received 1 mL/kg/hr, the low liberal group received 5 mL/kg/hr, and the high liberal group received 15 mL/kg/hr of Ringer’s solution intraoperatively. There were 40 patients in each group. Each patient’s hemodynamic parameters and laboratory values (arterial blood gas and lactate levels) were measured together with their consumption of crystalloids, volatile anesthetics, and analgesics.
Results: Analysis of the hemodynamic and laboratory parameters revealed no signs of global hypoperfusion in any of the groups analyzed. There was no significant difference in the duration of surgery and anesthesia, but the consumption of crystalloids, volatile anesthetics, and opioids was significantly lower in the restrictive group, compared with the low and high liberal groups. Although there was no significant difference in the 1-year morbidity among the groups, heart failure was observed in one patient in the high liberal group in the early postoperative period.
Conclusion: Restrictive fluid therapy during laparoscopic cholecystectomy is justified, safe, and more cost-effective than other options.
Keywords: cholecystectomy, laparoscopic, crystalloid solutions, fluid therapy, hemodynamics, cost–benefit analysis, morbidity, mortality
Corrigendum for this paper has been published.
Introduction
The maintenance of adequate tissue perfusion is the objective of intravenous fluid therapy. The optimal type, volume, and dosage of perioperative intravenous fluids have been extensively studied, yet no consensus on perioperative fluid management has been reached.1 Crystalloids are recommended for elective surgical procedures whereas colloids are recommended for patients with acute bleeding.2,3 Traditional fluid therapy consists of significantly higher doses of intravenous fluids than the clinical losses that occur because of tissue trauma or surgery. This practice can lead to hypervolemia and tissue edema,3 which can cause cardiopulmonary complications, anastomotic insufficiency, longer hospital stays, mechanical ventilation, endothelial glycocalyx damage, and higher mortality rates.4 Hypervolemia must be avoided during elective surgical procedures as it breaks down the integrity of the endothelial glycocalyx, causing interstitial edema with poor outcomes.2,3
Patients who receive a lower volume of intravenous fluids during and after colorectal surgery have fewer postoperative complications.3 In addition, lower volumes lead to an earlier return of bowel motion and flatulence, earlier resumption of enteral nutrition, and shorter hospital stays after major colorectal surgery.3,5 In contrast, patients undergoing laparoscopic cholecystectomy who receive restrictive fluid replacement have higher rates of postoperative nausea and vomiting.6
We hypothesized that a restrictive dose of Ringer’s solution7 will not adversely affect the patients’ global hemodynamics during laparoscopic cholecystectomy and will be safer and more cost-effective than other options.
Patients and methods
This prospective, two-arm, parallel, randomized study was conducted from March 23, 2015 to November 30, 2017. It was approved by the Ethics Committee of Karlovac General Hospital, Croatia, on March 16, 2015 (protocol no 01-12-24/1) and was registered in the German Clinical Trials Register (DRKS) under the unique identification number DRKS00007904.
The study included patients with gallstones who were scheduled for laparoscopic cholecystectomy. All patients provided written informed consent before participating in the study. The study was conducted according to the guidelines set forth by the World Medical Association, as outlined in the Declaration of Helsinki: Ethical Principles for Medical Research Involving Human Subjects.
Inclusion and exclusion criteria
This study included 120 patients of American Society of Anesthesiology (ASA) classes I and II who were scheduled for laparoscopic cholecystectomy. Patients younger than 18 or older than 75 years of age, those with local and systemic inflammatory or immune diseases, and those with severe functional organ impairment or hematologic or malignant diseases were excluded. A flowchart indicating the final sample, including the number of excluded patients and the reasons for exclusion, is presented in Figure 1. There were no statistically significant differences in age, sex, or body mass index among the patient groups.
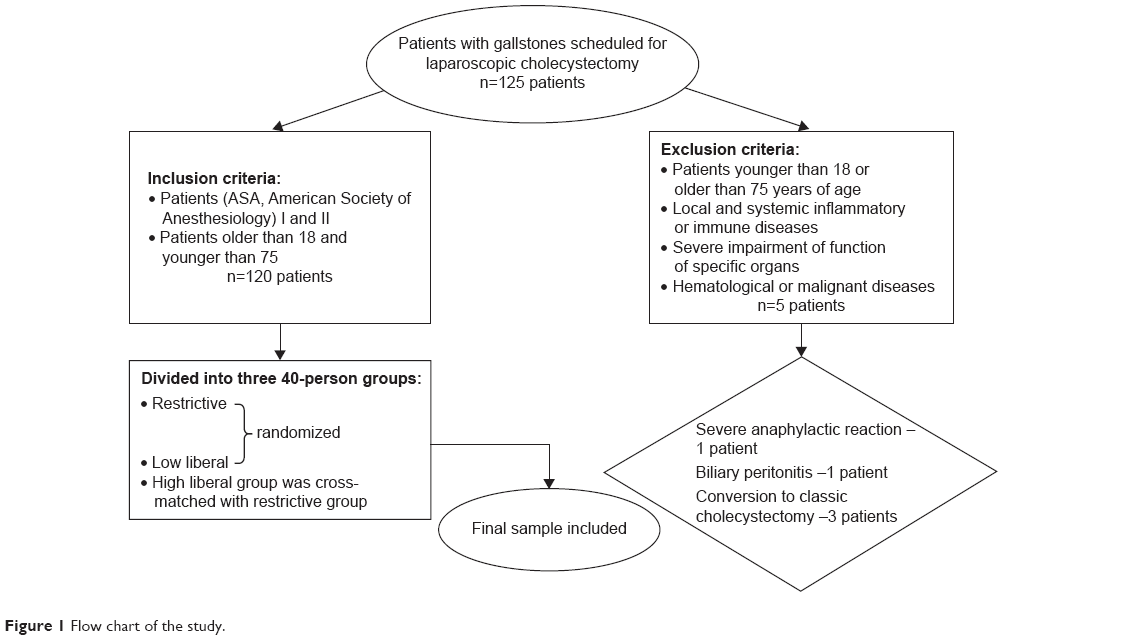 | Figure 1 Flow chart of the study. |
Objectives of the study
The objective of the current study was to determine the effectiveness and safety of a restrictive regimen of crystalloids during laparoscopic cholecystectomy, according to hemodynamic parameters, arterial blood gas (ABG), lactate concentrations, critical outcomes8 (respiratory and cardiac complications, renal failure, etc.), early postoperative surgical complications, length of hospital stay, 1-year morbidity, and mortality. The second objective was to determine the cost-effectiveness of various volumes of crystalloids.
Restrictive group and two liberal groups of patients
Patients were randomly allocated to one of two 40-person groups by the computer program Sealed Envelope® (Sealed Envelope Ltd, London, UK). Patients allocated to the restrictive group received 1 mL/kg/hr9 of Ringer’s solution intraoperatively whereas those allocated to the low liberal group received 5 mL/kg/hr. The dose in the low liberal group was equal to the proposed dose for moderate tissue trauma (ie, cholecystectomy): 4–6 mL/kg/hr10 and did not differ much from the usual dose of crystalloids given during gallbladder surgery.
Due to the routine clinical practice in Croatia and worldwide, where a larger volume of crystalloid solutions (15 mL/kg/hr) is usually used, a 40-person high liberal group was additionally analyzed. It was cross-matched with the restrictive group. Patients allocated to the high liberal group received 15 mL/kg/hr of Ringer’s solution intraoperatively. The survey was conducted in the operating room and at the Department of Abdominal Surgery, General Hospital Karlovac, Croatia. All 120 patients received 7.5 mg midazolam orally 30 minutes before surgery. In the recovery room, an intravenous line was placed in each patient and an infusion of isotonic Ringer’s solution7 using Infusomat was started in accordance with the protocol.
Operations were conducted under general anesthesia. For co-induction of general anesthesia, 2.5 mg midazolam was intravenously administered to all patients to reduce the dose of other anesthetics and preserve hemodynamic stability. At 3 minutes after co-induction, anesthesia was induced by intravenous hypnotic thiopental at a dose of 5 mg/kg. For muscle relaxation, rocuronium bromide at a dose of 0.6 mg/kg was administered. After the induction of anesthesia, the patient was endotracheally intubated and mechanically ventilated by the anesthetic apparatus Avance CS2 (FIN-00031 GE; GE Healthcare, Finland). Anesthesia was maintained by a mixture of oxygen and air and the volatile anesthetic sevoflurane. For analgesia, opioid fentanyl in 2–3 μg/kg doses was given during operation and, for postoperative analgesia, 25–100 mg tramadol hydrochloride and 1.25–2.5 g metamizole were given intravenously. After extubation, patients were transferred to the recovery room.
Hemodynamic monitoring
Hemodynamic monitoring of each patient was done with impedance cardiography (ICON; Osypka Medical GmbH, Berlin, Germany; BioZ® ICG Impedance Cardiography; CardioDynamics, San Diego, CA, USA; Solar GE Medical System Information Technologies, Milwaukee, WI, USA). Systolic blood pressure (SAP), diastolic blood pressure (DAP), mean arterial pressure (MAP), heart rate, cardiac index (CI), stroke volume index (SVI), systemic vascular resistance index (SVRI), peripheral oxygen saturation, and electrocardiography were recorded before inducing anesthesia (T0), immediately after intubation (T1), at the creation of pneumoperitoneum (T2), and immediately after surgery (T3).
Blood sampling
Blood samples for ABG analysis and lactate concentration were taken before the induction of anesthesia (T0), at the creation of pneumoperitoneum (T1), and immediately after surgery (T2).
Mortality and morbidity assessment
We used the Simplified Acute Physiology Score (SAPS II) as a prognostic score for calculating predictive mortality.11 Moreover, we assessed critical outcomes8 during the 30-day postoperative period, early postoperative surgical complications, length of hospital stay, 1-year morbidity, and mortality.
Calculation of the anesthetic and crystalloid consumption
We assessed the consumption of crystalloids, volatile anesthetics, and opioids by measuring the exact doses that were administered during each operation and comparing statistical differences between the groups. The consumption of volatile anesthetics was calculated using Dion’s method.12 We used the following formula: V = (P*F*T*M)/(2412*d), where V is the consumption of sevoflurane in milliliters; P is the vaporizer dial concentration in percentage; F is the total fresh gas flow in liter per minute; T is time, for which the concentration P was set in minutes; M is the molecular mass of sevoflurane in grams; and d is the density of liquid sevoflurane in gram per milliliter.13,14 The fixed variables used were as follows: F (total fresh gas flow) was set at 4 L/min for maintenance of anesthesia; M (molecular mass of sevoflurane) was 200.055 mg; and d (density of sevoflurane at 21°C) was 1.52 g/mL.14 Substituting the fixed variables, the equation can be rewritten for induction as follows: 0.2184 (T*P) for T (time) in minutes.14 The consumption of opioids and crystalloids was calculated from the anesthesia charts.
Statistical analysis
Statistical analysis of the quantitative data was carried out by examining the normality of distributions and using Shapiro–Wilk’s test and a normality histogram. Descriptive statistics were used for presenting demographic and surgical data. Because of the abnormal distributions of laboratory values and hemodynamic variables, nonparametric tests were applied. Data were presented as a median and interquartile range from the 25th to 75th quartiles. Friedman’s test and a post hoc Wilcoxon rank sum test were used to compare various time points within the same group. For the statistical comparison of data between the groups, a Kruskal–Wallis test and post hoc Mann–Whitney U test were used. Chi-square test was used for comparison of critical outcomes, early postoperative surgical complications, and 1-year morbidity. The G*Power program (G*Power 3.1.9.2 Software 2014; University of Düsseldorf, Düsseldorf, Germany) was used to estimate sample size. A predictive sample size was calculated for the nonparametric Wilcoxon and Mann–Whitney U tests. The expected difference between the two means of the cardiac index was 0.85, and the SDs were 0.7 and 0.6. The total sample size was 78 respondents, and there were 39 respondents per group, with a two-sided confidence interval of 0.95 and a desired power of 0.90. Data were recorded in Excel (Microsoft Office Excel 2003; Microsoft, Redmond, WA, USA). Statistical processing was carried out with SPSS 22 (IBM Corporation, Armonk, NY, USA). The results are presented in tables and graphs. Using Bonferroni corrections, p-values less than 0.017 were considered statistically significant for comparing four different time points, and p-values less than 0.025 were considered statistically significant for comparing values between the different groups.
Results
Demographic, anesthesiologic, and surgical data
The demographic, anesthesiologic, and surgical data of this study population are shown in Table 1. There was a significant difference in blood loss between the restrictive and high liberal groups (p = 0.003). The total volume of infusion solutions that patients received during surgery was 99 mL in the restrictive group, 474 mL in the low liberal group, and 1,485 mL in the high liberal group. The intraoperative fluid balance was calculated by subtracting the volume of blood loss, urine output, and insensible perspiration from the infused volume. There was a significant difference in volume infused, urine output, and intraoperative fluid balance on comparisons between the restrictive and the low liberal, as well as the restrictive and the high liberal, groups as shown in Table 1 (p < 0.001). There was no statistically significant difference in the length of hospitalization between the groups.
 | Table 1 Baseline demographics, anesthesiologic, and surgical data |
Hemodynamic changes in SAP, DAP, MAP, and heart rate
The SAP, DAP, MAP, and heart rate values in the three patient groups are shown in Figure 2. The SAP values decreased significantly from T0 to T1 in the restrictive [median: 133 (interquartile range: 116–154) mmHg vs 119 (99–137) mmHg, p < 0.001] and low liberal groups [141 (119–153) mmHg vs 114 (101–129) mmHg, p < 0.001; Figure 2A]. In the high liberal group, SAP values did not significantly change at any time point. SAP was significantly lower in the restrictive group than in the high liberal group at T1 [119 (99–137) mmHg vs 135 (119–151) mmHg, p = 0.016; Figure 2A]. DAP and MAP values did not change significantly within or between the groups (Figure 2B and C). Heart rates are illustrated in Figure 2D. Statistically significant increases in heart rate were observed in the restrictive and high liberal groups from T0 to T1 [74 (69–81) beats/min vs 85 (75–99) beats/min, p < 0.001; and 68 (61–79) beats/min vs 79 (68–94) beats/min, p < 0.001, respectively]. The heart rate was significantly faster in the restrictive group than in the low liberal group at T1 [85 (75–99) beats/min vs 75 (64–89) beats/min, p = 0.003]. The heart rate was significantly faster in the restrictive group at T2 and T3 than in the high liberal group [84 (70–92) beats/min vs 68 (60–83) beats/min, p = 0.002 and 79 (72–92) beats/min vs 69 (60–81) beats/min, p = 0.012, respectively].
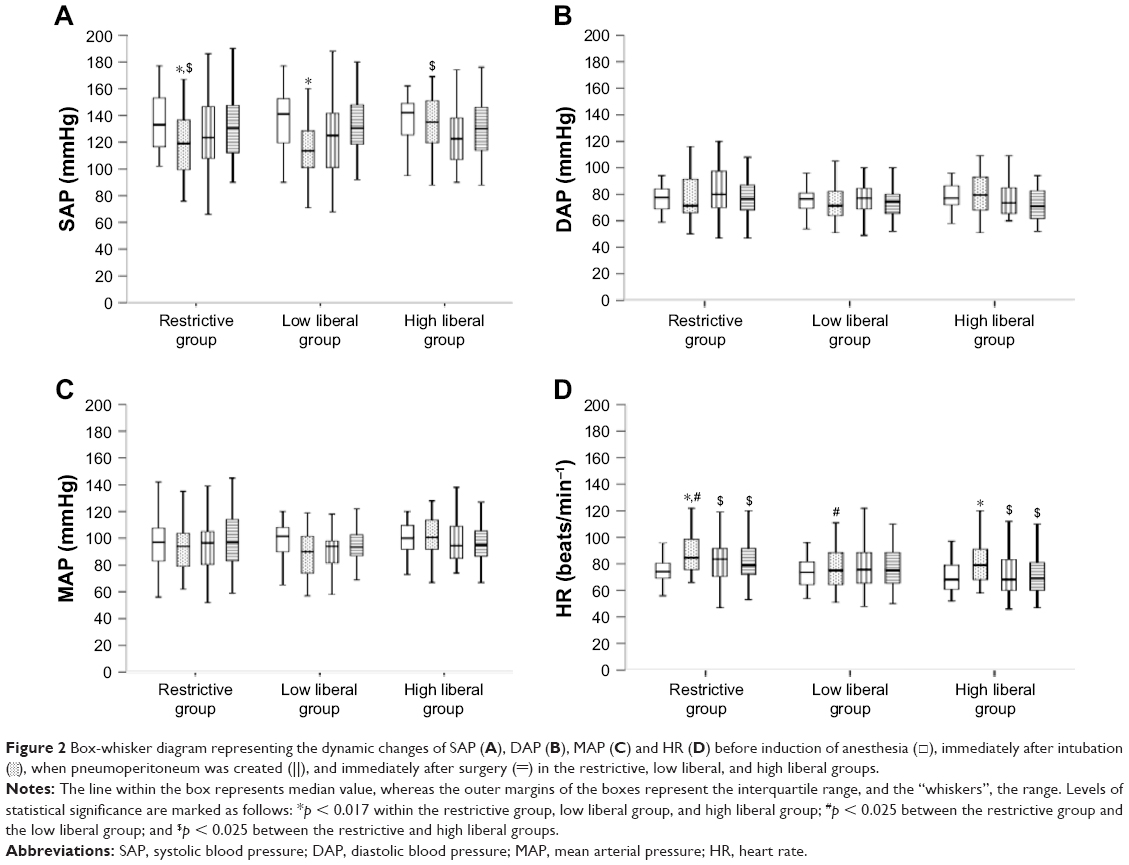 | Figure 2 Box-whisker diagram representing the dynamic changes of SAP (A), DAP (B), MAP (C) and HR (D) before induction of anesthesia (□), immediately after intubation |
 , when pneumoperitoneum was created (||), and immediately after surgery (═) in the restrictive, low liberal, and high liberal groups.
Hemodynamic changes in CI, SVI, and SVRI
Changes in CI values are shown in Figure 3A. In the restrictive group, CI significantly decreased from T0 to T1, T2, and T3 [2.9 (2.4–3.3) L/min/m2 vs 2.35 (1.93–2.78) L/min/m2 and 2.2 (1.8–2.5) L/min/m2, p < 0.001; and 2.9 (2.4–3.3) L/min/m2 vs 2.3 (1.93–3.07) L/min/m2, p = 0.002]. In the low liberal group, CI significantly decreased from T0 to T1 and T2 [2.65 (2.35–3.08) L/min/m2 vs 2.3 (2–2.68) L/min/m2 and 2.2 (1.8–2.68) L/min/m2, p < 0.001]. CI did not change significantly in the high liberal group at any time point. The CI value was significantly lower in the restrictive group at T1 than in the high liberal group at the same time point [2.35 (1.93–2.78) L/min/m2 vs 2.8 (2.2–3.1) L/min/m2, p = 0.007].
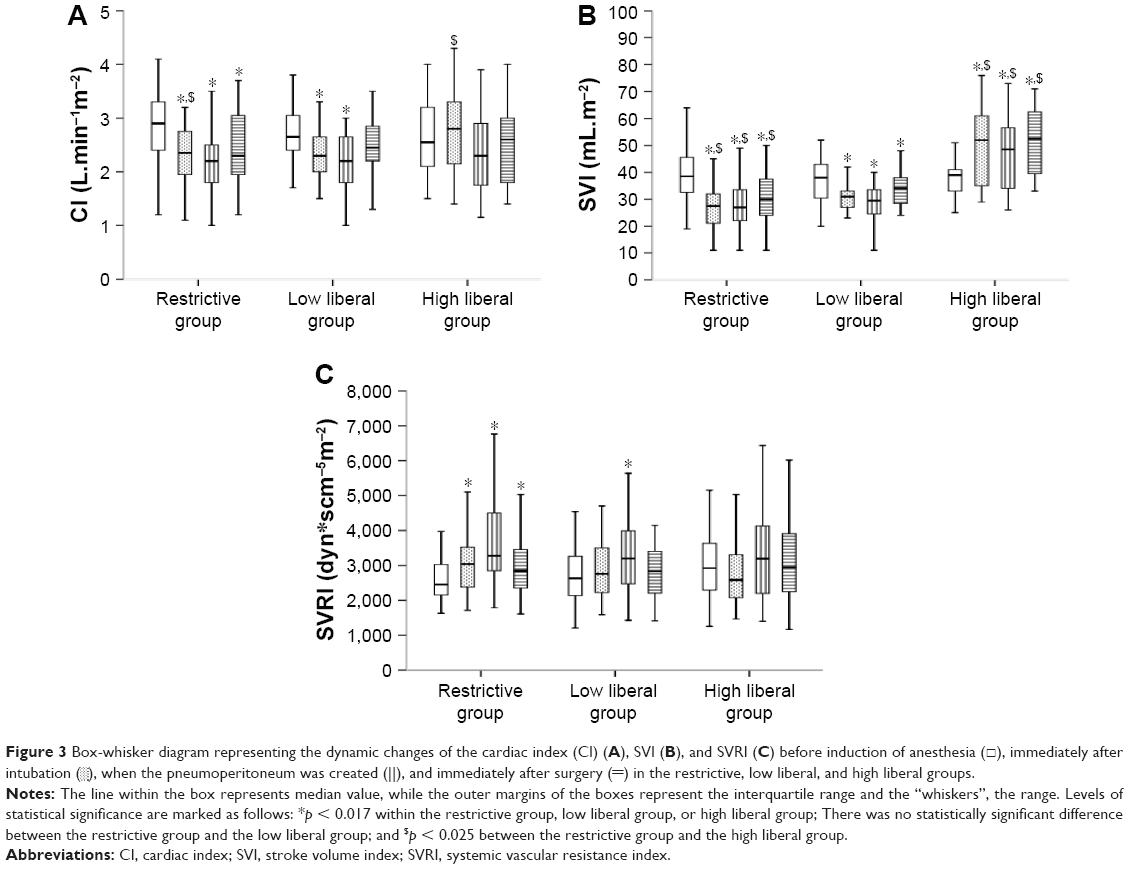 | Figure 3 Box-whisker diagram representing the dynamic changes of the cardiac index (CI) (A), SVI (B), and SVRI (C) before induction of anesthesia (□), immediately after intubation |
Changes in SVI values are illustrated in Figure 3B. SVI values decreased significantly from T0 to T1, T2, and T3 in the restrictive group [38.5 (32–45.8) mL/m2 vs 27.5 (21–32.5) mL/m2, 27 (22–33.8) mL/m2 and 30 (24–37.8) mL/m2, p < 0.001] and from T0 to T1, T2, and T3 in the low liberal group [38 (30–43) mL/m2 vs 31 (27–33) mL/m2 and 29.5 (24–33.8) mL/m2, p < 0.001] and [38 (30–43) mL/m2 vs 34 (28–38) mL/m2, p = 0.015]. In the high liberal group, SVI values significantly increased from T0 to T1, T2, and T3 [39 (33–41) mL/m2 vs 52 (35–61) mL/m2, 48.5 (34–56.8) mL/m2 and 52.5 (39–63) mL/m2, p < 0.001]. At T1, T2, and T3, the SVI values in the restrictive group were found to be significantly lower than those in the high liberal group [27.5 (21–32.5) mL/m2, 27 (22–33.8) mL/m2 and 30 (24–37.8) mL/m2 vs 52 (35–61) mL/m2, 48.5 (34–56.8) mL/m2 and 52.5 (39–63) mL/m2, p < 0.001; Figure 3B].
SVRI values are illustrated in Figure 3C. SVRI significantly increased in the restrictive group from T0 to T1 and T2 [2,453 (2,153–3,073) to 3,038 (2,378–3,541) and 3,278 (2,836–4,628) dyn*s−1cm−5m−2, p < 0.001] and to T3 [2,843 (2,353–3,498) dyn*s−1cm−5m−2, p = 0.013]. These values increased in the low liberal group from T0 to T2 [2,631 (2,135–3,303) vs 3,200 (2,461–4,003) dyn*s−1cm−5m−2, p = 0.003]. SVRI values did not change significantly within the high liberal group.
Comparison of laboratory values
ABG and lactate values in arterial blood revealed no signs of global hypoperfusion or elevated lactate levels (Table 2).
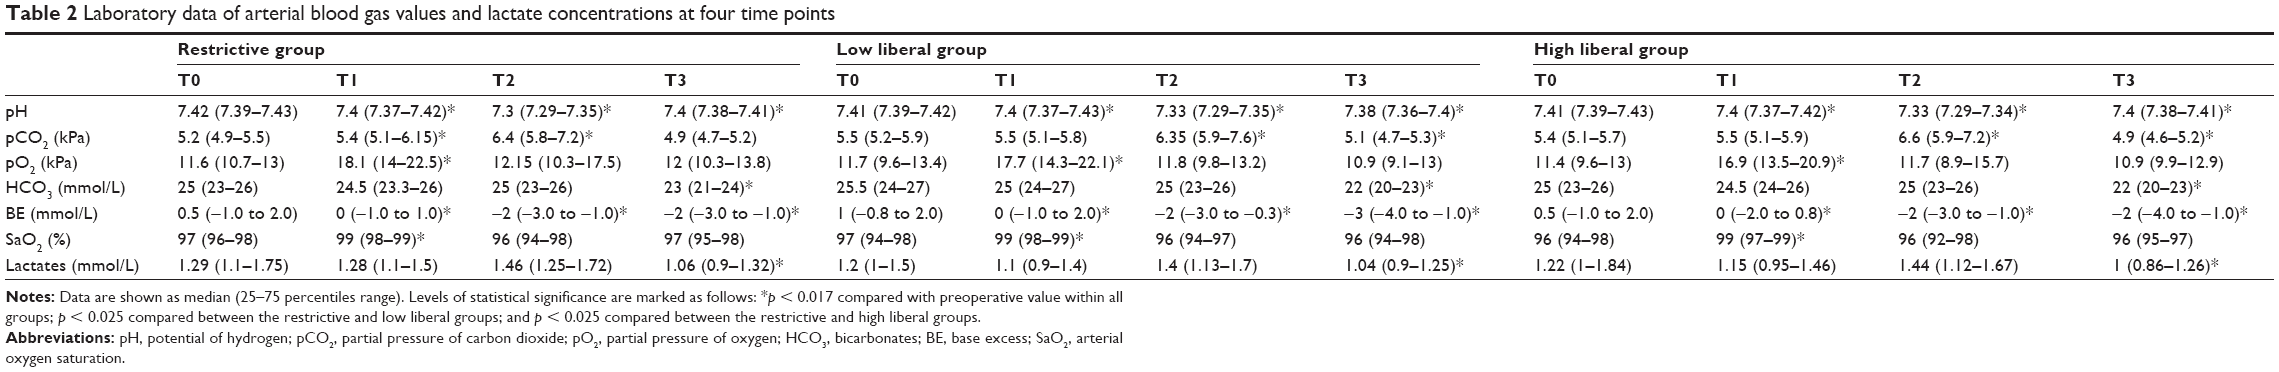 | Table 2 Laboratory data of arterial blood gas values and lactate concentrations at four time points |
Consumption of anesthetics
The calculated consumption of volatile anesthetic (sevoflurane, in milliliters) in the restrictive group was 34.4 (30.6–46) mL, whereas it was 46 (38.2–46) mL in the low liberal group and 46 (46–53.5) mL in the high liberal group. There was a statistically significant difference between the restrictive and low liberal groups (p = 0.017) and between the restrictive and high liberal groups (p < 0.001).
The average consumption of opioid fentanyl was 150 (100–200) μg in the restrictive group, whereas it was 175 (150–250) μg in the low liberal group and 150 (150–200) μg in the high liberal group. There was significantly lower consumption of fentanyl in the restrictive, than in the low liberal, group (p < 0.009).
The average consumption of thiopental was 400 (350–400) mg in the restrictive group, whereas it was 350 (300–400) mg in the low liberal group and 400 (300–450) mg in the high liberal group. There were no statistically significant differences in thiopental consumption between all groups.
The average consumption of rocuronium bromide in the restrictive and the high liberal groups was 50 (50–60) mg, and it was 50 (50–50) mg in the low liberal group. There were no statistically significant differences in the consumption of rocuronium bromide between the groups.
The average consumption of Ringer’s solution in the restrictive group was 99 (73–113) mL, whereas it was 474 (393–602) mL in the low liberal group and 1,485 (1,222–1,970) mL in the high liberal group. There was significantly lower consumption of Ringer’s solution between the restrictive and the low liberal groups (p < 0.001) and between the restrictive and the high liberal groups (p < 0.001).
The costs of the average consumption of sevoflurane in the restrictive group were €11 (9.8–14.7), whereas it was €14.7 (12.2–14.7) in the low liberal group and €14.7 (14.7–17.1) in the high liberal group. The overall costs of sevoflurane consumption were €440 (392–588) in the restrictive group, €588 (488–588) in the low liberal group, and €588 (588–684) in the high liberal group.
The costs of the average consumption of fentanyl were €0.41 (0.27–0.54) in the restrictive group, €0.47 (0.41–0.68) in the low liberal group, and €0.41 (0.41–0.54) in the high liberal group. The overall costs of fentanyl consumption were €16.4 (10.8–21.6) in the restrictive group, €18.8 (16.4–27.2) in the low liberal group, and €16.4 (16.4–21.6) in the high liberal group.
The costs of the average consumption of thiopental were €0.72 (0.63–0.72) in the restrictive group, €0.63 (0.54–0.72) in the low liberal group, and €0.72 (0.54–0.81) in the high liberal group. The overall costs of thiopental consumption were €28.8 (25.2–28.8) in the restrictive group, €25.2 (21.6–28.8) in the low liberal group, and €28.8 (21.6–32.4) in the high liberal group.
The costs of the average consumption of rocuronium bromide were €4.4 (4.4–5.3) in the restrictive and high liberal groups, whereas in the low liberal group they were €4.4 (4.4–4.4). The overall costs of rocuronium bromide consumption were €176 (176–212) in the restrictive and high liberal groups, whereas in the low liberal group they were €176 (176–176). The costs of the average consumption of Ringer’s solution were €0.2 (0.15–0.23) in the restrictive group, €1 (0.8–1.2) in the low liberal group, and €3 (2.4–3.9) in the high liberal group. The overall costs of Ringer’s solution consumption were €8 (6–9.2) in the restrictive group, €40 (32–48) in the low liberal group, and €120 (96–156) in the high liberal group. The costs of sevoflurane consumption in the restrictive group were €148 cheaper than in the low and high liberal groups, and the consumption of fentanyl was only €2.4 cheaper in the restrictive group than in the low liberal group. The costs of Ringer’s solution consumption were €32 cheaper in the restrictive than in the low liberal group and €112 cheaper in the restrictive than in the high liberal group. The costs of anesthetics and crystalloids were €180 cheaper in the restrictive group than in the low liberal group and were €260 cheaper in the restrictive group than in the high liberal group.
Mortality and morbidity assessment
We found no statistically significant differences in the SAPS II score among the groups, but predictive mortality was significantly lower in the restrictive group than in the high liberal group [2.9% (1.4%–4.2%) vs 5.2% (3.8%–9.5%), p < 0.001; Table 3]. The 1-year mortality rate was 0% in all three groups, but there were some differences in morbidity. There were no statistically significant differences in early postoperative surgical complications, with one complication in each of the three groups. Postoperatively prolonged bile secretion by abdominal drainage was observed in the restrictive and high liberal groups without signs of inflammation, but with prolonged hospitalization (8 days in the restrictive group and 14 in the high liberal group). These were treated conservatively. Prolonged hospitalization of 15 days was observed in the low liberal group and was associated with inflammation; it was treated conservatively with antibiotics and resolved spontaneously. In addition, critical outcomes were observed, with one case of pulmonary congestion as a consequence of heart failure in the high liberal group in the early postoperative period as a direct consequence of the high volume load. Moreover, we analyzed the 1-year morbidity and found no statistically significant differences between the groups. In the restrictive group, we observed a case of acute pancreatitis with sepsis and another case of choledocholithiasis with obstructive jaundice, which was treated by endoscopic retrograde cholangiopancreatography (ERCP) and sphincterotomy. In the low liberal group, an episode of heart failure was observed 4 months postoperatively and was determined to be unrelated to the surgery. The two cases of choledocholithiasis with obstructive jaundice were resolved by ERCP, sphincterotomy, and endobiliary stent implantation. In the high liberal group, we observed a case of bile reflux gastritis and another of stomach cancer 10 months after the cholecystectomy that required a subtotal gastrectomy. Furthermore, a single case of Klatskin tumor or hilar cholangiocarcinoma was observed in the high liberal group. Cholangiocarcinomas tend to grow slowly and infiltrate the walls of the ducts, growing along tissue planes. Local extension occurs into the liver, porta hepatis, and regional lymph nodes of the celiac and pancreaticoduodenal chains. Further, life-threatening infection (cholangitis) that requires immediate antibiotic intervention and aggressive biliary drainage may occur.
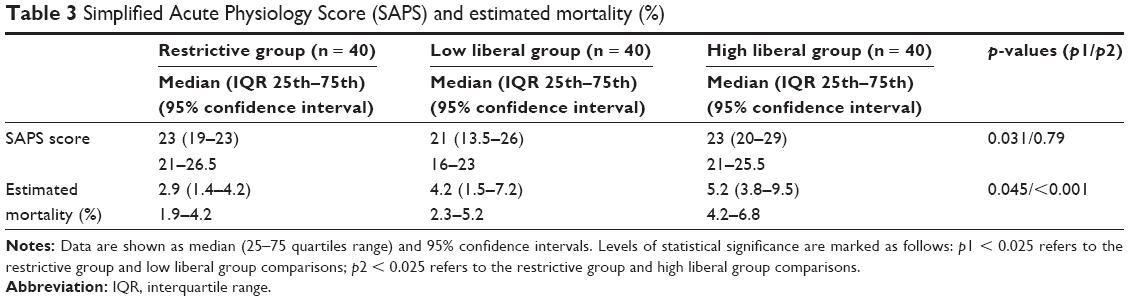 | Table 3 Simplified Acute Physiology Score (SAPS) and estimated mortality (%) |
Discussion
The major finding of this study was that global hemodynamics were preserved in the restrictive group, despite the negative intraoperative fluid balance, and there was no evidence of activated anaerobic metabolism. Moreover, global hemodynamics were preserved in the low and high liberal groups. MAP did not significantly change after inducing pneumoperitoneum in any group – a finding that contrasts with the results of a previous study by Joris et al,15 in which the MAP increased after a pneumoperitoneum was created. The CI decreased after the induction of anesthesia and the creation of pneumoperitoneum in the restrictive and the low liberal groups, but it did not change in the high liberal group. The decreases in CI were likely the results of the reduced preload and the effects of pneumoperitoneum.15 Pneumoperitoneum causes caval compression, an increase in venous resistance, and pooling of blood in the periphery of the circulatory system.15 SVI decreased after the induction of anesthesia, creation of pneumoperitoneum, and extubation within the restrictive and low liberal groups, whereas it significantly increased within the high liberal group. The volume load was larger in the high liberal group and, according to the Frank–Starling law, there was, therefore, a greater stretching of the myocardium, resulting in larger end-diastolic volume and greater SVI.16 The SVRI significantly increased after induction, creation of pneumoperitoneum, and extubation in the restrictive group, and after creation of the pneumoperitoneum in the low liberal group. The increase in SVRI can be attributed to a release of vasopressin and catecholamines.17 In the high liberal group, SVRI did not significantly change after the pneumoperitoneum was created because the large volume load prevented a preload reduction after the creation of the pneumoperitoneum. According to Joris et al,15 hemodynamic changes induced by the pneumoperitoneum can be attenuated by increasing the cardiac filling pressures before peritoneal insufflation (by fluid loading and tilting the patient to the head-up position only after insufflation).
The effects of various doses of infusion solutions have been previously described, mostly in major abdominal operations. We focused on minimally invasive laparoscopic surgery, wherein the fluid loss is significantly lower and the restrictive doses of infused solutions were adequate to compensate for the invisible losses of perspiration and urination.2
We used Ringer’s solution7 to compensate for fluid losses and to maintain global hemodynamics during surgery. Unlike colloids, which stay in the circulation longer after administration, only 20% of the infused volume of crystalloid solutions remains in circulation.3 Therefore, patients are usually given larger volumes of crystalloid solutions than of colloids during surgery. However, the infusion of large volumes of crystalloid solutions may lead to acute respiratory distress syndrome, pulmonary edema, brain edema, and abdominal compartment syndrome.18
Traditionally, the doses of infusion solutions administered during surgery have been more than the measured fluid losses incurred during tissue trauma or surgery. These liberal volumes are intended to compensate the loss of fluid from injured tissue and the vascular space, thus maintaining hemodynamic stability. The liberal volumes, moreover, are based on the premise that surgical patients are hypovolemic because of prolonged preoperative fasting and water deprivation, bowel cleansing, and invisible losses by perspiration and diuresis.3 It is now recommended, however, that patients consume solid food up to 6 hours and liquid up to 2 hours before a procedure.3 Further, it is known that the invisible losses due to perspiration are minimal, and the duration of preoperative fasting and water deprivation is short.3 In thoracic surgery, the use of a restrictive dose of infusions has had a favorable effect on treatment outcomes.3 On the other hand, in patients who received larger volumes of infusion solution for major colorectal surgery, significantly more postoperative complications were observed.3
There are no evidence-based guidelines describing the optimal volumes of perioperative fluid to be administered for surgical procedures. The ideal volume substitution is tailored to individual patients – an approach known as goal-directed therapy,19 in which volume substitution is based on the patient’s hemodynamic values and tissue oxygenation.3 This approach promptly compensates for losses from intraoperative bleeding and invisible losses due to perspiration and diuresis.2 In comparative studies, no differences were found between restrictive or zero-balance fluid therapy and zero-balanced goal-directed therapy.9
A recent article published in the Cochrane database20 suggests that restrictive fluid therapy is superior to a liberal fluid therapeutic strategy. In a multicenter study, Brandstrup et al21 investigated a homogenous collective of 172 patients undergoing major colorectal surgery.2,21 They demonstrated that perioperative intravenous fluid restriction (mean, 2,740 vs 5,388 mL) significantly reduced the incidence of major and minor complications, such as anastomotic leakage, pulmonary edema, pneumonia, and wound infection.2,21 Despite the administration of limited fluid and a perioperative decrease in urine output, acute renal failure did not occur in any patient.2,21 Although their analysis did not purely compare liberal versus restrictive, a close look at the infusion protocols reveals that, with regard to colloids versus crystalloids, they administered mainly colloids to the restrictive group whereas treating the liberal group with more than 5 L of crystalloids.2 Their study was conducted in patients who underwent major colorectal surgery,21 whereas ours investigated patients who underwent laparoscopic cholecystectomy and we used only crystalloids. We chose a continuous dose of crystalloids because the dose was adequate to compensate for the losses in the low and the high liberal groups without the need for additional fluid boluses. In the restrictive group, the dose of 1 mL/kg/hr was sufficient to compensate for losses from insensible perspiration and diuresis. We assumed that the surgical losses would be low enough that the postoperative infusions could compensate for them. In case of hypotension, we would administer the vasopressor ephedrine, which was required in four patients in the restrictive group. We have omitted additional fluid boluses in the restrictive group to provide equal conditions across all three groups (continuous dose of crystalloids). Cost-effective analyses of the anesthetic regimens and anesthetic consumption have become increasingly important in an attempt to reduce the costs of healthcare systems. A study by Smith et al22 compared the costs of inhalational anesthesia using sevoflurane with those of total intravenous anesthesia (TIVA) with propofol, and balanced anesthesia induced with propofol and maintained with sevoflurane. The primary variable studied was the cost of the anesthetic drugs (including wastage) and disposable equipment. After re-evaluation of the data from that study based on the current prices of propofol at the institution where the research was conducted, TIVA was found to be significantly less expensive than inhalational or balanced anesthesia.22 Vomiting occurred in 17% patients in the sevoflurane group and in none of the patients in the intravenous group; however, in the propofol plus sevoflurane group, 9% experienced vomiting.22 The simplest method for determining the cost of a particular anesthetic is to simply calculate drug consumption, perhaps including drug wastage and the cost of disposable equipment.23 In our study, we measured only the actual consumption of anesthetics and crystalloids but not drug wastage. Nausea and vomiting followed by incisional pain were found to be the most distressing factors for the postoperative patient and affect the cost necessary to ensure patient satisfaction.23 Furthermore, they have an impact on the time spent in the recovery room and will, therefore, influence the personnel costs associated with the anesthetic.23 Various studies have shown that intravenous techniques were associated with a significantly lower incidence of postoperative nausea and vomiting as compared with the inhalational technique.23 Intravenous anesthesia with propofol has been shown to result in a shorter period of sick leave than anesthesia with thiopental and isoflurane.23 In our study, all groups received balanced anesthesia with thiopental and sevoflurane and analgesia with fentanyl, and we did not compare the cost-effectiveness of each form of anesthesia, but rather the consumption of anesthetics and crystalloids according to the various volumes of Ringer’s solution. With regard to the 1-year postoperative morbidity, we would like to highlight a case of gastric carcinoma that occurred within a year of cholecystectomy. Kang et al’s24 retrospective study mentioned that the possibly increased risk of stomach cancer in patients undergoing gallstone cholecystectomy might be due to a duodenogastric bile reflux, and that the survival of these patients was poor.24 Therefore, close follow-up strategies for early detection are recommended for such patients.24 Despite the zero mortality rate in our study, the predictive mortality calculated by the SAPS II score was significantly higher in the high liberal group than in the restrictive group, and both cases of carcinoma (gastric and cholangiocarcinoma) were observed in that group. The incidence of gastric and cholangiocarcinoma in patients in the high liberal group could not be explained by hypervolemia, and it seems that this observation is the result of additional cofactors such as multiple genetic and epigenetic alterations in oncogenes, impairment of DNA repair and tumor suppressor genes, or dysregulation of cell-cycle regulators or signaling molecules that can, at least partially, be induced by the pro-inflammatory response caused by surgery and anesthesia in susceptible patients.25,26
There are some limitations to this study. The sample size was small and further analysis should be undertaken in a larger number of the patients undergoing low-risk, minimally invasive surgery such as laparoscopic cholecystectomy. Whether the results of our study will apply to more extensive operations deserves future study.
Conclusion
Global hemodynamics were preserved in all three groups, and there were no signs of global hypoperfusion or activated anaerobic metabolism in the restrictive or liberal groups. The consumption of anesthetics and Ringer’s solution was more cost-effective in the restrictive group than in the low liberal and high liberal groups. There were no statistically significant differences between the groups with regard to early postoperative surgical complications, as well as the length of hospitalization and 1-year morbidity. These results confirm the rationale and safety of restrictive dose infusions during minimally invasive surgery (laparoscopic cholecystectomy) in low-risk patients and may not be applicable to all patients or surgical procedures.
Acknowledgments
The authors thank the surgeons and nurses of the Department of Abdominal Surgery, Karlovac General Hospital; the anesthetic technicians of the Department of Anesthesiology, Reanimatology and Intensive Care, Karlovac General Hospital; and the medical laboratory staff of the Department of Medical Laboratory Diagnostics, Karlovac General Hospital for providing and caring for the study patients, their collaboration in conducting the study, and their work in collecting blood samples and running analyses.
Author contributions
All authors contributed toward data analysis, drafting, and critically revising the manuscript and agree to be accountable for all aspects of the work. All of the authors have read and approved the manuscript.
Disclosure
The authors report no conflicts of interest in this work.
References
Holte K. Pathophysiology and clinical implications of peroperative fluid management in elective surgery. Dan Med Bull. 2010;57(7):B4156. | ||
Chappell D, Jacob M, Hofmann-Kiefer K, Conzen P, Rehm M. A rational approach to perioperative fluid management. Anesthesiology. 2008;109(4):723–740. | ||
Doherty M, Buggy DJ. Intraoperative fluids: how much is too much? Br J Anaesth. 2012;109(1):69–79. | ||
Chappell D, Bruegger D, Potzel J, et al. Hypervolemia increases release of atrial natriuretic peptide and shedding of the endothelial glycocalyx. Crit Care. 2014;18(5):538. | ||
Lobo DN, Bostock KA, Neal KR, Perkins AC, Rowlands BJ, Allison SP. Effect of salt and water balance on recovery of gastrointestinal function after elective colonic resection: a randomised controlled trial. Lancet. 2002;359(9320):1812–1818. | ||
Holte K, Klarskov B, Christensen DS, et al. Liberal versus restrictive fluid administration to improve recovery after laparoscopic cholecystectomy: a randomized, double-blind study. Ann Surg. 2004;240(5):892–899. | ||
Halmed.hr [homepage on the Internet]. Zagreb: The Agency for Medicinal Products and Medical Devices, Inc.; 2007–2017 [updated 2015 July 29; cited 2016 June 13]. Available from: http://www.almp.hr/upl/lijekovi/SPC/UP-I-530-09-14-02-233_.pdf. Accessed December 15, 2017. | ||
National Clinical Guideline Centre (UK). Intravenous Fluid Therapy: Intravenous Fluid Therapy in Adults in Hospital [Internet]. London: Royal College of Physicians; 2013. (NICE Clinical Guidelines, No. 174.) Available from: https://www.ncbi.nlm.nih.gov/books/NBK247761/. Accessed December 15, 2017. | ||
Voldby AW, Brandstrup B. Fluid therapy in the perioperative setting-a clinical review. J Intensive Care. 2016;4:27. | ||
Stoelting RK, Miller RD. Basics of Anesthesia. 5th ed. Philadelphia, PA: Churchill Livingstone; 2007. | ||
Le Gall JR, Lemeshow S, Saulnier F. A new Simplified Acute Physiology Score (SAPS II) based on a European/North American multicenter study. JAMA. 1993;270(24):2957–2963. | ||
Dion P. The cost of anaesthetic vapours. Can J Anaesth. 1992;39(6):633. | ||
Shen L, Luo Y, Lu Z, Hu X, Ding W, Yu B. Cost-effectiveness of different regimens of anesthesia for day surgery in China. Int J Clin Exp Med. 2014;7(12):5744–5750. | ||
Singh PM, Trikha A, Sinha R, Borle A. Measurement of consumption of sevoflurane for short pediatric anesthetic procedures: comparison between Dion’s method and Dragger algorithm. J Anaesthesiol Clin Pharmacol. 2013;29(4):516–520. | ||
Joris JL, Chiche JD, Canivet JL, Jacquet NJ, Legros JJ, Lamy ML. Hemodynamic changes induced by laparoscopy and their endocrine correlates: effects of clonidine. J Am Coll Cardiol. 1998;32(5):1389–1396. | ||
Abraham DM, Davis RT 3rd, Warren CM, et al. β-Arrestin mediates the Frank-Starling mechanism of cardiac contractility. Proc Natl Acad Sci U S A. 2016;113(50):14426–14431. | ||
Poeze M, Solberg BC, Greve JW, Ramsay G. Monitoring global volume-related hemodynamic or regional variables after initial resuscitation: what is a better predictor of outcome in critically ill septic patients? Crit Care Med. 2005;33(11):2494–2500. | ||
Rackow EC, Falk JL, Fein IA, et al. Fluid resuscitation in circulatory shock: a comparison of the cardiorespiratory effects of albumin, hetastarch, and saline solutions in patients with hypovolemic and septic shock. Crit Care Med. 1983;11(11):839–850. | ||
Hamilton MA. Perioperative fluid management: progress despite lingering controversies. Cleve Clin J Med. 2009;76(Suppl 4):S28–S31. | ||
Wrzosek A, Jakowicka-Wordliczek J, Zajaczkowska R, et al. Perioperative restrictive versus goal-directed fluid therapy for adults undergoing major non-cardiac surgery (Protocol). Cochrane Database Syst Rev. 2017;(8):CD012767. | ||
Brandstrup B, Tønnesen H, Beier-Holgersen, R, et al; Danish Study Group on Perioperative Fluid Therapy. Effects of intravenous fluid restriction on postoperative complications: comparison of two perioperative fluid regimens: a randomized assessor-blinded multicenter trial. Ann Surg. 2003;238(5):641–648. | ||
Smith I, Terhoeve PA, Hennart D, et al. A multicentre comparison of the costs of anaesthesia with sevoflurane or propofol. Br J Anaesth. 1999;83(4):564–570. | ||
Kettler D, Crozier T. Cost-effectiveness of anaesthesia. Curr Opin Anaesthesiol. 2001;14(5):569–572. | ||
Kang SH, Kim YH, Roh YH, et al. Gallstone, cholecystectomy and risk of gastric cancer. Ann Hepatobiliary Pancreat Surg. 2017;21(3):131–137. | ||
Nagini S. Carcinoma of the stomach: a review of epidemiology, pathogenesis, molecular genetics and chemoprevention. World J Gastrointest Oncol. 2012;4(7):156–169. | ||
Medscape [https://www.medscape.org]. New York: WebMD; [updated 2017 June 23; cited 2018 February 28]. Available from: https://emedicine.medscape.com/article/277393-overview#a5. Accessed February 26, 2018. |
 © 2018 The Author(s). This work is published and licensed by Dove Medical Press Limited. The
full terms of this license are available at https://www.dovepress.com/terms
and incorporate the Creative Commons Attribution
- Non Commercial (unported, 3.0) License.
By accessing the work you hereby accept the Terms. Non-commercial uses of the work are permitted
without any further permission from Dove Medical Press Limited, provided the work is properly
attributed. For permission for commercial use of this work, please see paragraphs 4.2 and 5 of our Terms.
© 2018 The Author(s). This work is published and licensed by Dove Medical Press Limited. The
full terms of this license are available at https://www.dovepress.com/terms
and incorporate the Creative Commons Attribution
- Non Commercial (unported, 3.0) License.
By accessing the work you hereby accept the Terms. Non-commercial uses of the work are permitted
without any further permission from Dove Medical Press Limited, provided the work is properly
attributed. For permission for commercial use of this work, please see paragraphs 4.2 and 5 of our Terms.