
Back to Journals » Drug Design, Development and Therapy » Volume 20

A One-Year Retrospective Observational Study Reveals the Transient Nature of Pemafibrate-Induced LDL-C Elevation: Implications Beyond the PROMINENT Trial

Received 27 December 2025
Accepted for publication 12 April 2026
Published 8 July 2026 Volume 2026:20 592050
DOI https://doi.org/10.2147/DDDT.S592050
Checked for plagiarism Yes
Review by Single anonymous peer review
Peer reviewer comments 2
Editor who approved publication: Dr Solomon Tadesse Zeleke
Chie Iitake, Kazuhiro Iitake
Iitake Clinic for Internal Medicine, Mito City, Ibaraki, Japan
Correspondence: Chie Iitake, Iitake Clinic for Internal Medicine, 2131-1976 Migawacho, Mito City, Ibaraki, 310-0913, Japan, Tel +81-29-350-1155, Fax +81-29-244-1150, Email [email protected]
Purpose: Pemafibrate, a selective peroxisome proliferator-activated receptor-α modulator (SPPARMα), is widely used for hypertriglyceridemia; however, concerns persist regarding its potential to elevate low-density lipoprotein cholesterol (LDL-C). Previous studies monitored LDL-C for only 3– 6 months, leaving the long-term trajectory unclear. This one-year retrospective observational study aimed to determine whether pemafibrate-induced LDL-C elevation is sustained or transient and to identify factors associated with this response.
Patients and Methods: A total of 110 patients receiving pemafibrate (0.1– 0.2 mg/day; standard dose 0.2 mg/day) were followed for one year. Serial lipid changes were analyzed, and predictors of LDL-C elevation were evaluated using multivariate regression.
Results: Triglyceride decreased markedly from 378.6 ± 248.7 to 191.5 ± 144.4 mg/dL (P < 0.001). LDL-C increased from 120.5 ± 30.6 to 129.7 ± 34.3 mg/dL at 3 months (P < 0.05), representing the peak of LDL-C elevation. Thereafter, LDL-C gradually declined and showed no statistically significant difference from the baseline at 12 months, demonstrating a characteristic transient “rise-and-return” pattern. Lower baseline LDL-C, lower HDL-C, and higher triglycerides were associated with greater LDL-C elevation, while statin use showed no significant association. Low baseline LDL-C was the strongest predictor in multivariate analysis.
Conclusion: This study is the first to document the full one-year LDL-C trajectory under pemafibrate, revealing a transient “rise-and-return” pattern. LDL-C elevation peaks at approximately 3 months and returns to baseline by one year, indicating that the increase is temporary rather than persistent. These findings refine the understanding of pemafibrate’s lipid effects and support its long-term safety profile.
Keywords: hypertriglyceridemia, SPPARMα, LDL-C dynamics, pemafibrate, transient LDL-C elevation
Introduction
Pemafibrate, a novel selective peroxisome proliferator-activated receptor-α modulator (SPPARMα), effectively decreases high triglyceride (TG) levels with fewer adverse effects than conventional fibrates.1–3 It is recommended for patients with markedly elevated TG levels due to familial or genetic factors and for those who respond poorly to other treatments.4
Although pemafibrate consistently lowers TG levels, several studies have reported increases in low-density lipoprotein cholesterol (LDL-C) after several months of treatment. This has led some clinicians to hesitate or discontinue pemafibrate therapy. In the PROMINENT trial, a large international study in patients with type 2 diabetes receiving intensive statin therapy, LDL-C increased by approximately 14% (12 mg/dL) in the pemafibrate group compared with 2.9% (2 mg/dL) in the placebo group.5 Notably, LDL-C was assessed at four months, a time point that may coincide with the early peak of LDL-C elevation. Therefore, the observed increase may reflect a short-term metabolic shift rather than a sustained effect of pemafibrate.
We previously reported that LDL-C increased significantly after short-term pemafibrate therapy in real-world practice, particularly among patients not receiving statins, whereas no significant change was observed in those on statin therapy.6 These findings suggested that LDL-C elevation may occur early after pemafibrate initiation, but the long-term trajectory remained unclear.
Because previous studies monitored LDL-C for only 3–6 months, the full pattern of LDL-C changes under pemafibrate have not been established. Whether LDL-C levels continue to rise or naturally return to baseline has not been clarified, leaving the long-term behavior of LDL-C an unanswered clinical question.
Conventional fibrates can also increase LDL-C, although the mechanism is not fully understood, and long-term data are limited. In addition, lifestyle factors such as diet and exercise were not systematically modified in our clinical setting, minimizing their influence on lipid changes.
To address this gap, we conducted a one-year observational study to characterize the complete LDL-C trajectory under pemafibrate and to identify factors associated with transient LDL-C elevation. To our knowledge, no prior study has documented long-term LDL-C dynamics, including the possibility of a transient rise followed by a return to baseline.
Materials and Methods
The data of the study are available from the corresponding author upon reasonable request. The Ethics Committee of the Japan Physicians Association, Tokyo, Japan approved the study on August 7, 2019 (Approved ID: 022–1906-001). All data were collected retrospectively from the electric patient records at Iitake Clinic for Internal Medicine. This is a single-center observational study.
Due to the retrospective nature of this study, participants’ informed consent was waived. However, information about this study was provided to guarantee the right to opt out.
Participants
After considering the inclusion and exclusion criteria, 110 patients were enrolled, with 21 participants (19.1%) had been treated with other fibrates and were switched to pemafibrate, and 32 (29.1%) using statins. Other lipid medicated drugs included EPA (used in three cases, added in one case), ezetimibe (used in one case, added on one case), and probucol (used in one case). As the number of cases was extremely small, we believe that it would not affect the results. Furthermore, 55 patients (50.0%) had type 2 diabetes, and 43 (39.1%) were on medication. Insulin was used in one case. Other drugs, such as SGLT2 inhibitors and GLP-1 injections, which could affect the outcome, were used in 22 and 2 cases, respectively. However, as the number of these cases was small, its influence was not considered. Patients with hypertriglyceridemia (non-fasting TG levels ≥175 mg/dL) who regularly visiting our clinic and did not meet the exclusion criteria were included in the study. Follow-up visits occurred every 35–60 days, which is similar to the typical interval for general clinic visits. Patients who were self-discontinued pemafibrate, were admitted to other hospitals, underwent surgery, are pregnant or breastfeeding, started a new diet and exercise therapy, and deemed unsuitable for inclusion in this study by the researcher were excluded.
Dose
From July 2018 to July 2019, the patients received pemafibrate once (0.1–0.2 mg) or twice (0.2 mg) daily. The dose was selected after physician consultations and patient discussions to ensure medication compliance. The initiation doses were as follows: 0.1 mg/once daily (n = 56, 50.9%), 0.2 mg/once daily (n = 4, 3.6%), and 0.2 mg twice daily (n = 50, 45.5%). The average daily dose was 0.157 ± 0.094 mg, which is smaller than the standard daily dose 0.2 mg. Of the 110 cases, 17 (15.5%) had their doses increased from 0.1 to 0.2 mg, once or twice daily for a better effect. On average, the increase occurred at 7.12 ± 2.45 months.
Laboratory Findings and Statistical Analysis
Data on age, sex, and body weight (BW, kg) were collected. Changes in TG (non-fasting, mg/dL), LDL‑C (mg/dL), HDL‑C (mg/dL), HbA1c (%), and postprandial blood glucose (PBG, mg/dL) were assessed at baseline, 1 month, 3 months, 6 months, and 1 year. Baseline creatinine (mg/dL), creatinine kinase (CK, IU/L), aspartate transaminase (AST, IU/L), and alanine transaminase (ALT, IU/L) were also obtained.
LDL‑C was measured using a direct homogeneous assay routinely employed in our clinical laboratory. For descriptive purposes, “low baseline LDL‑C” was defined as <123 mg/dL, corresponding to the median baseline LDL‑C value in this cohort.
The Wilcoxon signed‑rank test was used for nonparametric evaluation of variables pre‑ and post‑treatment. The dataset was also examined using the Wilcoxon rank‑sum test where appropriate. The change rate of LDL‑C at 3 months was analyzed using Pearson’s or Spearman correlation coefficients, depending on data distribution.
Univariate and multivariate linear regression analyses were conducted to identify factors associated with LDL‑C elevation. Variables with P < 0.10 in univariate analysis were entered into the multivariate model, and scaled estimates were used. Statistical analyses were performed using JMP® version 17 (SAS Institute Inc., Cary, NC, USA). Values are expressed as mean ± standard deviation. Statistical significance was set at P < 0.05.
Reasons for Collecting Non-fasting TG
Non-fasting triglycerides were collected because postprandial lipid levels better reflect real‑world lipid metabolism and remnant lipoprotein burden, which are strongly associated with cardiovascular risk.6 Previous large cohort studies in both Western and Japanese populations have shown that non-fasting TG levels predict cardiovascular events as well as, or better than, fasting TG levels.7–10
In addition, achieving a true fasting state is often difficult in routine clinical practice, particularly for patients with diabetes.11–14 Therefore, non-fasting TG measurements were considered more practical and clinically relevant for this study.
Other Parameters
During the study period, no structured diet or exercise program was implemented, and patients continued their usual lifestyle habits. Smoking and alcohol consumption also remained unchanged, which may not have affected the results. Among the 110 patients, 13 (men, 9; women, 4) had a smoking history and 34 (men, 30; women, 4) had a history of alcohol consumption.
Results
Baseline Characteristics
The baseline characteristics of all 110 patients are shown in Table 1. Of these, 57 (51.8%) were men and 53 (48.2%) were women, with a mean age of 61.2±11.7 years. The mean baseline body weight was 70.9±17.8 kg, indicating an overweight population.
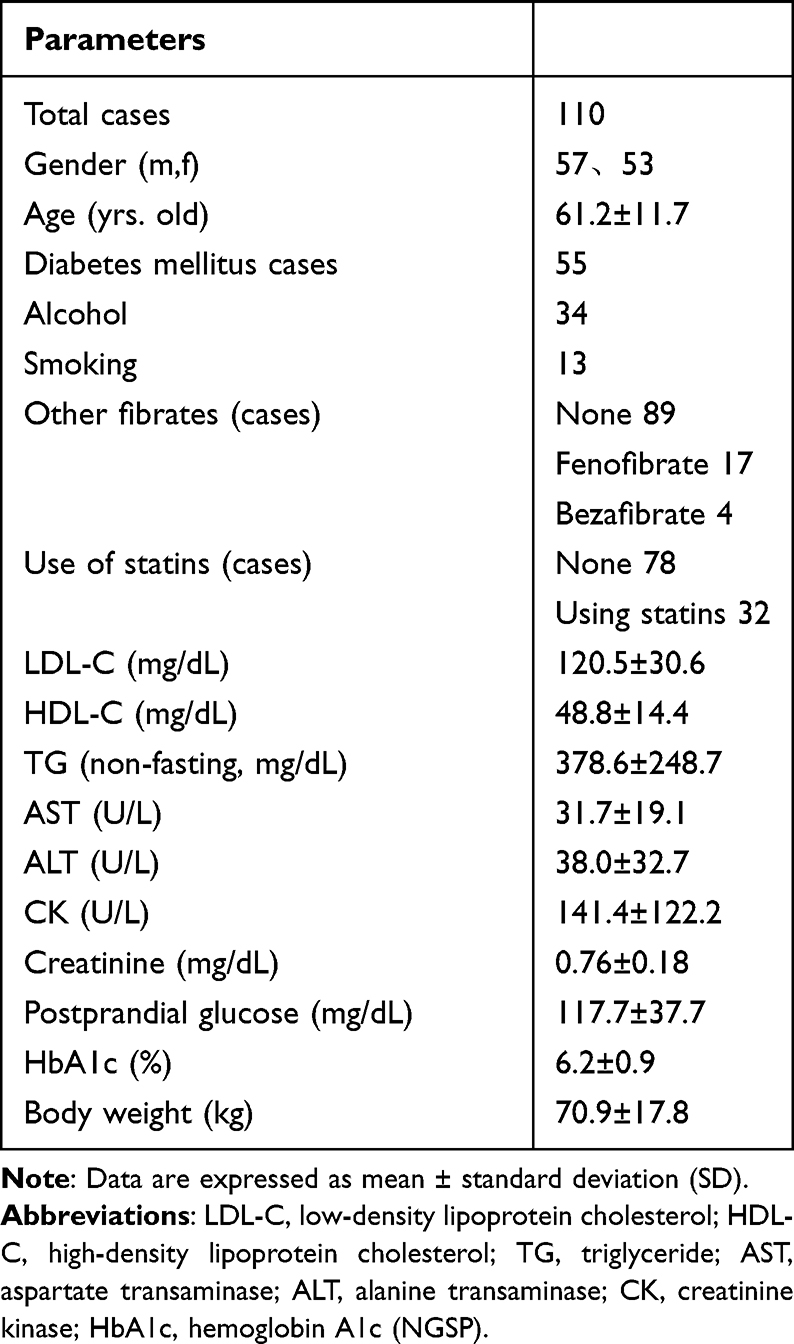 |
Table 1 Baseline Characteristics of All Patients |
 |
Table 2 Changes of Each Parameter from Baseline to 1 Year |
Baseline laboratory values were as follows: TG, 378.6 ± 248.7 mg/dL; LDL-C, 120.5 ± 30.6 mg/dL; HDL-C, 48.8 ± 14.4 mg/dL; HbA1c, 6.2% ± 0.9%; and postprandial blood glucose (PBG), 117.7 ± 37.7 mg/dL. Baseline creatinine was 0.76 ± 0.18 mg/dL; CK, 141.4 ± 122.2 IU/L; AST, 31.7 ± 19.1 IU/L; and ALT, 38.0 ± 32.7 IU/L.
Changes in Lipid Parameters Over One year
The changes in all parameters are summarized in Table 2.
Triglycerides (TG)
TG levels decreased significantly and consistently throughout the study period:
- 1 month: 242.4 ± 160.3 mg/dL (P < 0.0001***)
- 3 months: 216.5 ± 138.1 mg/dL (P < 0.0001***)
- 6 months: 211.7 ± 146.3 mg/dL (P < 0.0001***)
- 1 year: 191.5 ± 144.4 mg/dL (P < 0.0001***)
HDL-C
HDL-C levels significantly increased from the baseline steadily:
- 1 month: 52.8 ± 14.3 mg/dL (P < 0.0001***)
- 3 months: 53.2 ± 13.5 mg/dL (P < 0.0001***)
- 6 months: 55.8 ± 16.2 mg/dL (P < 0.0001***)
- 1 year: 56.0 ± 16.9 mg/dL (P < 0.0001***)
LDL-C (Rise-and-Return Pattern)
LDL-C demonstrated a distinct transient elevation:
- 1 month: 122.7 ± 31.2 mg/dL
- 3 months(peak): 129.7 ± 34.3 mg/dL (P < 0.05*)
- 6 months: 125.7 ± 31.6 mg/dL
- 1 year: 120.6 ± 28.3 mg/dL (return to baseline)
Figure 1 illustrates this trajectory. LDL-C increased from month 1, peaked at 3 months, and then gradually declined to baseline by 1 year. The LDL-C change rate showed the same pattern, with a peak of 11.7% ± 31.6% at 3 months, confirming the transient nature of the elevation.
 |
Figure 1 (a) Mean LDL-C trajectory (b) Change rate of LDL-C (c) Mean TG changes (d) Mean HDL-C changes in 110 patients, observed for 12 months. P-values were calculated using the paired t-test. * p < 0.05, *** p < 0.001. |
Identifying Contributors to LDL-C Elevation
We attempted to identify the most significant factors contributing to LDL-C elevations at 3 months. The LDL-C changes with different parameters are presented in Table 3. Statin use, which is the most likely contributing factor, was neither related nor statistically significant (P = 0.225). The prescribed pemafibrate dose (new or switched) was also not related. In addition, alcohol habits did not exhibit a significant correlation, but smoking habits did (P < 0.05*). Sex and diabetes complications were also not statistically significant. Regression analysis (Table 4) revealed six statistically significant factors associated with to LDL-C elevation.
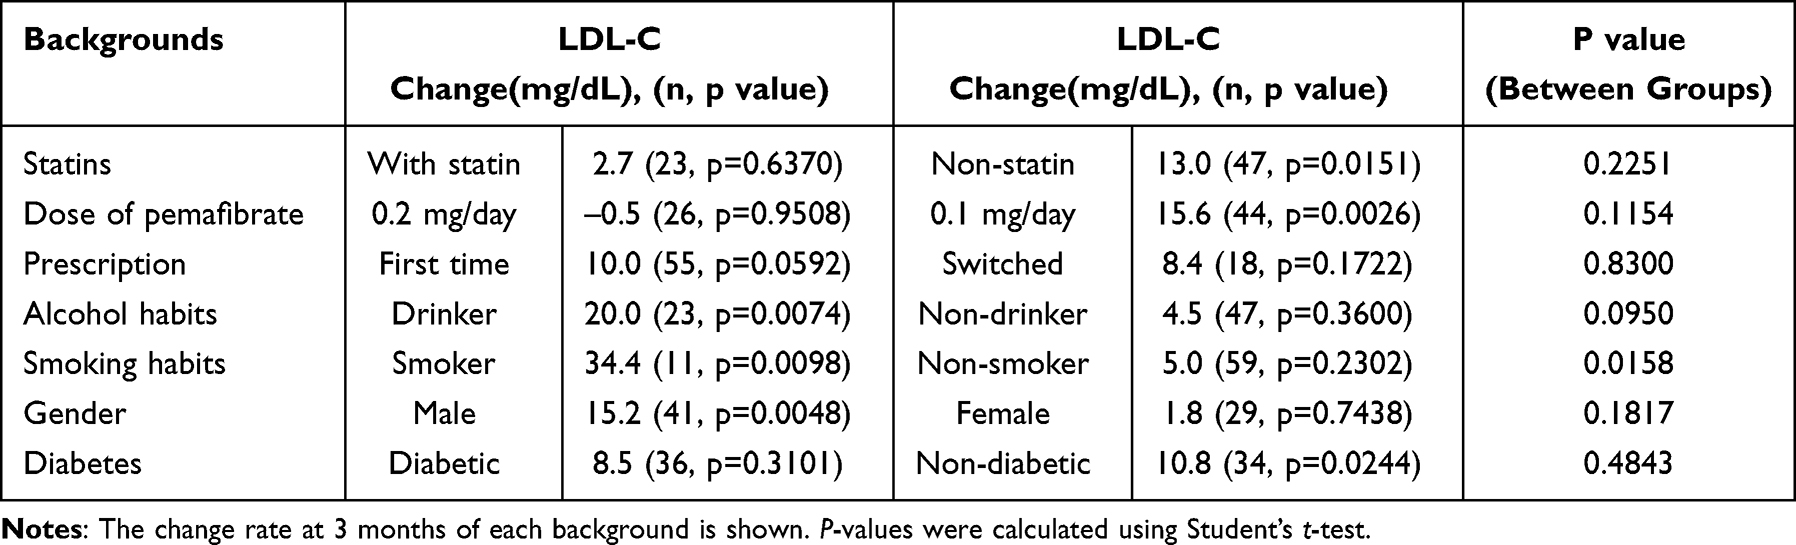 |
Table 3 LDL-C Changes at 3 Months with Different Backgrounds |
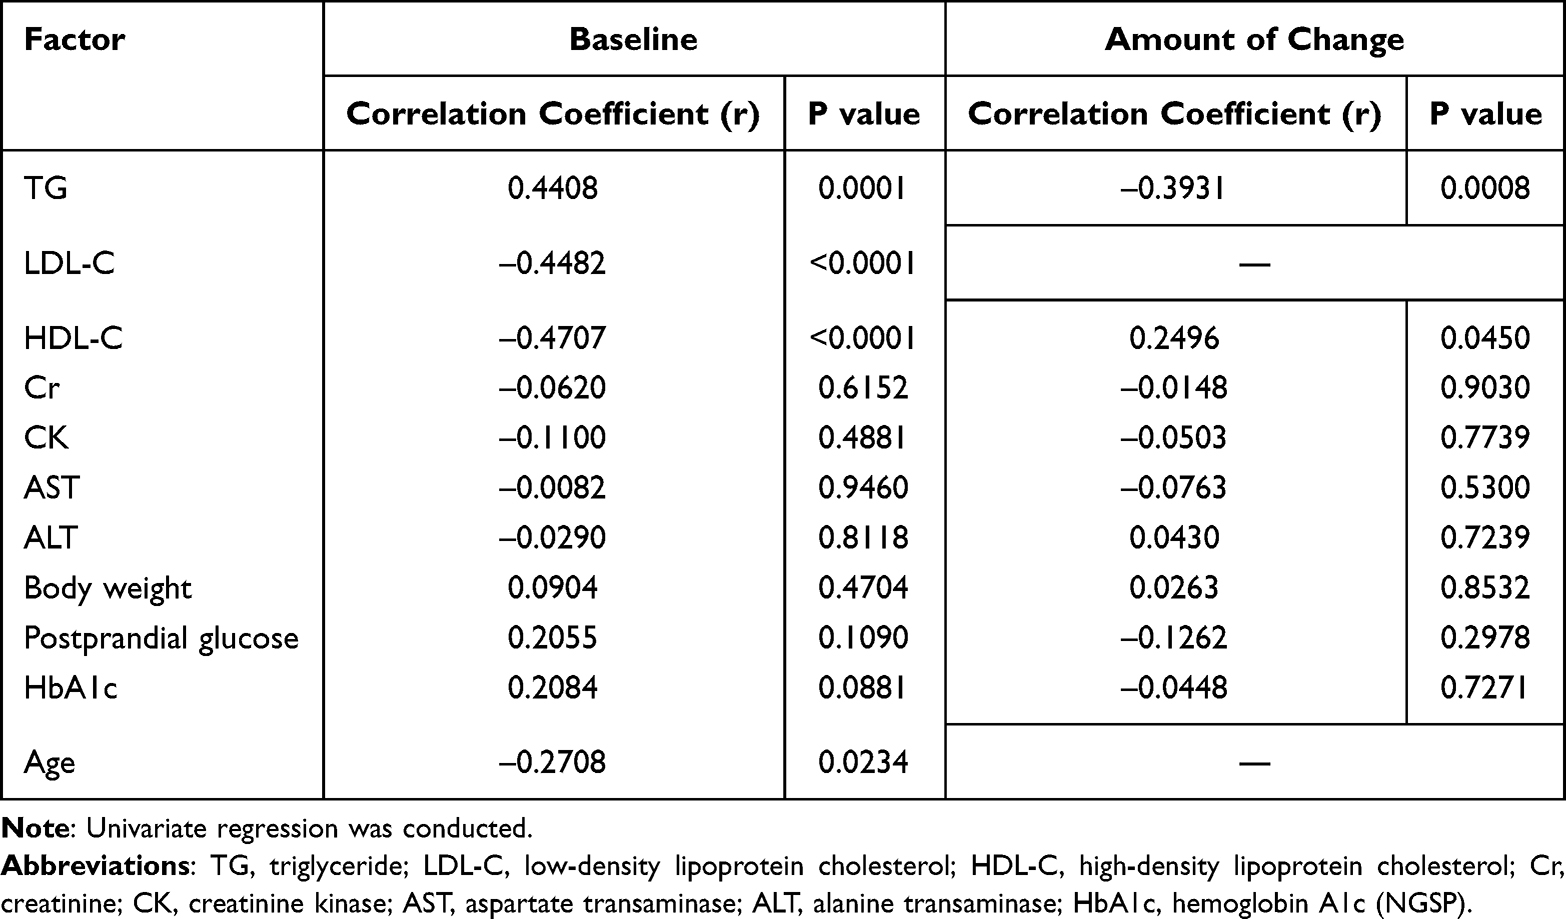 |
Table 4 LDL-C Changes and Correlation with Baseline at 3 Months |
1. The higher the baseline TG levels before administration, the higher the LDL-C levels afterward (correlation coefficient r = 0.4408, P= 0.0001***).
2. The lower the baseline LDL-C levels before administration, the higher the LDL-C levels afterward (correlation coefficient r = −0.4482, P<0.0001***).
3. The lower the baseline HDL-C levels before administration, the higher the LDL-C levels afterward (correlation coefficient r = −0.4707, P < 0.0001***).
4. The younger the age, the higher the LDL-C levels afterward (correlation coefficient r = −0.2708, P < 0.05*).
5. The larger the decrease in TG changes, the higher the LDL-C levels afterward (correlation coefficient r = −0.3931, P < 0.001***).
6. The larger the elevation in the HDL-C changes, the higher the LDL-C levels afterward (correlation coefficient r=0.2496, P < 0.05*).
We conducted a multivariate regression analysis (Table 5). The most significant factor associated with LDL-C elevation was a low baseline LDL-C level (standardized coefficient r = −0.2622, P < 0.05*). This was followed by a low baseline HDL-C level (standardized coefficient r = −0.3210, P < 0.01**) and high baseline TG level (standardized coefficient r=0.2262, P < 0.05*). Age and smoking habits did not exhibit statistically significant associations.
 |
Table 5 Key factors influencing 3-month LDL-C changes |
Discussion
The LDL-C levels initially increased after pemafibrate treatment. In some cases, the serum LDL-C level increased to about 20 mg/dL, which requires further evaluation in future studies. However, the level was within the expected increase range because of the VLDL catabolic pathway. This attributed to the fact that the conversion of VLDL to VLDL remnants is enhanced by LPL activation, leading to increased transformation of VLDL remnants to LDL by hepatic lipase. In our study, the factors statistically significant for LDL-C elevation were high TG, low HDL-C, and low LDL-C levels at the baseline. Patients with lower baseline LDL‑C may have a higher proportion of small, TG‑rich LDL particles or relatively preserved LDL receptor activity. Pemafibrate enhances LPL‑mediated lipolysis and alters LDL particle composition, which can transiently increase the cholesterol content within LDL particles without increasing ApoB. This may explain why patients with low baseline LDL‑C exhibited a greater rise in LDL‑C at 3 months. When administering pemafibrate, which effectively stimulates LPL activity, the catabolic pathway is upregulated, resulting in increased accumulation of downstream LDL-C. This process is estimated to occur between 3 and 6 months, depending on the change rate of LDL-C, as shown in Figure 1. After the peak, the levels gradually reach equilibrium. The PROMINENT Study monitored LDL-C at 4 months to observe the best peak in LDL-C levels after pemafibrate administration. While pemafibrate may appear to worsen LDL-C levels, criticizing LDL-C elevation as a hasty conclusion is warranted.
The subsequent decline and normalization of LDL‑C by 12 months likely reflect improvements in hepatic metabolic function during long‑term pemafibrate therapy. Several mechanisms may explain why LDL-C levels subsequently declined and returned to baseline after the initial 3-month rise. First, pemafibrate has been shown to improve hepatic insulin sensitivity and glucose uptake, as demonstrated in an insulin-clamp study. Improved hepatic insulin action reduces VLDL overproduction and enhances lipid handling, which may gradually attenuate the transient LDL-C increase observed during the early phase of treatment.15 Second, pemafibrate has been reported to ameliorate hepatic inflammation and stiffness in patients with metabolic dysfunction-associated steatotic liver disease. Improvement in hepatic metabolic function and reduced inflammatory stress may enhance LDL receptor activity and remnant clearance, contributing to the normalization of LDL-C levels over time.16 Third, studies combining pemafibrate with dietary interventions have suggested potential improvements in hepatic steatosis and overall lipid metabolism. These hepatic benefits collectively support the interpretation that the LDL-C rise represents a temporary metabolic shift rather than a persistent adverse effect.17
Considering the aforementioned metabolic process, enhanced β-oxidation of fatty acids in the liver via PPARα activation causes downregulation of hepatic TG synthesis. Therefore, the synthesis and secretion of large VLDL particles are reduced, with consequent decreases in sdLDL particles and formation of cholesterol-rich large LDL. In turn, the enhanced hepatic clearance of chylomicron remnants by pemafibrate promotes hepatic influx of cholesterol, increasing the hepatic cholesterol content, which may lead to the downregulation of hepatic LDL receptors. Thus, the quality of the elevated LDL-C is expected to be fair. Many studies reported that pemafibrate may reduce sdLDL-C levels, improving the LDL-C quality. In their study of 98 patients of whom 34% were statins users, almost the same size and backgrounds as our study, Hida et al reported that the level of sdLDL-C significantly decreased from 111 to 104 mg/dL at three months18 but the LDL-C level did not increase Komiya et al reported similar findings to ours, demonstrating that pemafibrate decreased TGs and sdLDL but increased LDL-C levels depending on baseline TGs and LDL-C levels19 Their study focused on patients with type 2 diabetes who were likely to have low LPL activity. In their 24-weeks observational study, the LDL-C levels increased in 69% of the patients, with an average change rate was 5.3%. Based on the findings from these two studies, the timing and the peak of LDL-C elevation are estimated to occur between 3 and 6 months after administration. Our 1-year study further supports this explanation.
In a prospective randomized comparative study of the effect of adding pemafibrate or doubling statin dose to decrease sdLDL-C in patients with type 2 diabetes,20 Hirano et al reported that such an addition exerted superior effects The evaluation period of the study was 12 weeks, and LDL-C did not significantly increase (107 ± 21 to 108 ± 25 mg/dL). However, sdLDL decreased by about −32.8%, which was statistically significant (P < 0.01). The findings indicate that pemafibrate increases LDL-C after 3 to 6 months and simultaneously reduces sdLDL.
Previous studies reported that pemafibrate reduces sdLDL and TG, but the observation point is 3 or 6 months at the most. To the best of our knowledge, no other study has followed up their patients for 1 year like ours, and our study is the first to demonstrate long-term LDL-C changes.
Limitations
This study has several limitations. First, it was a single‑center observational study with a relatively small sample size, which may limit generalizability. Second, although we discussed potential mechanisms such as hepatic insulin sensitivity and LDL receptor activity, these pathways were not directly evaluated in this study and should be interpreted cautiously. Third, although no structured diet or exercise interventions were implemented during the study period, unmeasured lifestyle factors may still have influenced lipid parameters to some extent.
Conclusion
In this one‑year observational study, we demonstrated that pemafibrate induces a distinct and transient “rise and return” pattern in LDL‑C levels—an early increase peaking at approximately 3 months, followed by a spontaneous return to baseline by one year. Patients with low baseline LDL‑C were most susceptible to this temporary rise, yet the overall lipid profile improved through sustained reductions in triglycerides and increases in HDL‑C, supporting the metabolic rather than adverse nature of this phenomenon. To our knowledge, this is the first study to characterize the full one‑year LDL‑C trajectory under pemafibrate, providing clinically relevant insight into how LDL‑C should be interpreted during treatment.
This study was conducted in a real‑world single‑center setting and includes inherent limitations such as heterogeneous patient backgrounds, multiple comorbidities, and concomitant medications. Some laboratory parameters could not be collected due to the retrospective design and insurance constraints. Despite these limitations, our findings offer important guidance for clinicians: transient LDL‑C elevation should not be misinterpreted as a harmful effect, and careful evaluation of baseline lipid profiles may help anticipate this short‑term response. Future prospective studies with broader datasets are warranted to validate and expand upon these observations.
In addition to the transient rise and subsequent normalization of LDL‑C, triglycerides and HDL‑C showed sustained improvement throughout the 12‑month period, supporting the overall metabolic benefit of long‑term pemafibrate therapy.
Data Sharing Statement
All datasets generated during and/or analyzed during the current study are not publicly available but are available from the corresponding author on reasonable request.
Ethics Approval and Informed Consent
The study was conducted in accordance with the Declaration of Helsinki, and approved by the Ethics Committee of the Japan Physicians Association, Tokyo, Japan approved the study on August 7, 2019 (Approved ID: 022-1906-001). Due to the retrospective nature of this study, participants’ informed consent was waived. However, information about this study was provided to guarantee the right to opt out.
Consent for Publication
All clinical data included in this study were anonymized and do not contain any information that could identify individual participants. Therefore, consent for publication was not required.
Acknowledgments
The authors are grateful to the study participants, and also would like to thank Enago (www.enago.jp) for the manuscript review and editing support.
Author Contributions
All authors made a significant contribution to the work reported, whether that is in the conception, study design, execution, acquisition of data, analysis and interpretation, or in all these areas; took part in drafting, revising or critically reviewing the article; gave final approval of the version to be published; have agreed on the journal to which the article has been submitted; and agree to be accountable for all aspects of the work.
Funding
This research received no external funding.
Disclosure
The authors report no conflicts of interest in this work.
References
1. Yamashita S, Masuda D, Matsuzawa Y. Pemafibrate, a new selective PPARα modulator: drug concept and its clinical applications for dyslipidemia and metabolic diseases. Curr Atheroscler Rep. 2020;22:5. doi:10.1007/s11883-020-0823-5
2. Yamashita S, Masuda D, Matsuzawa Y. Clinical applications of a novel selective PPARα modulator, pemafibrate, in dyslipidemia and metabolic diseases. J Atheroscler Thromb. 2019;26:389–11. doi:10.5551/jat.48918
3. Araki E, Yamashita S, Arai H, et al. Effects of pemafibrate, a novel selective PPARα modulator, on lipid and glucose metabolism in patients with type 2 diabetes and hypertriglyceridemia: a randomized, double-blind, placebo-controlled, Phase 3 trial. Diab Care. 2018;41:538–546. doi:10.2337/dc17-1589
4. Iitake C, Masuda D, Koseki M, Yamashita S. Marked effects of novel selective peroxisome proliferator-activated receptor α modulator, pemafibrate in severe hypertriglyceridemia: preliminary report [preliminary report]. Cardiovasc Diabetol. 2020;19:201. doi:10.1186/s12933-020-01172-8
5. Das Pradhan A, Glynn RJ, Fruchart JC, et al. Triglyceride lowering with pemafibrate to reduce cardiovascular risk. N Engl J Med. 2022;387:1923–1934. doi:10.1056/NEJMoa2210645
6. Iitake C, Iitake K. Half dose once-daily pemafibrate effectively improved hypertriglyceridemia in real practice. Clin Med Res. 2019;11:690–695.
7. Tada H, Nohara A, Inazu A, Mabuchi H, Kawashiri MA. Remnant lipoproteins and atherosclerotic cardiovascular disease. Clin Chim Acta. 2019;490:1–5. doi:10.1016/j.cca.2018.12.014
8. Aguib Y, Al Suwaidi JA. The Copenhagen city heart study (Østerbroundersøgelsen). Glob Cardiol Sci Pract. 2015;2015:33. doi:10.5339/gcsp.2015.33
9. Iso H, Imano H, Yamagishi K, et al. Fasting and non-fasting triglycerides and risk of ischemic cardiovascular disease in Japanese men and women: the circulatory risk in communities study (CIRCS). Atherosclerosis. 2014;237:361–368. doi:10.1016/j.atherosclerosis.2014.08.028
10. Tada H, Nomura A, Yoshimura K, et al. Fasting and non-fasting triglycerides and risk of cardiovascular events in diabetic patients under statin therapy. Circ J. 2020;84:509–515. doi:10.1253/circj.CJ-19-0981
11. Mora S, Chang CL, Moorthy MV, Sever PS. Association of nonfasting vs fasting lipid levels with risk of major coronary events in the Anglo-Scandinavian cardiac outcomes trial–lipid lowering arm. JAMA Intern Med. 2019;179:898–905. doi:10.1001/jamainternmed.2019.0392
12. Nakamura K, Miyoshi T, Yunoki K, Ito H. Postprandial hyperlipidemia as a potential residual risk factor. J Cardiol. 2016;67:335–339. doi:10.1016/j.jjcc.2015.12.001
13. Tanaka A, Tomie N, Nakano T, et al. Measurement of postprandial remnant-like particles (RLPs) following a fat-loading test. Clin Chim Acta. 1998;275:43–52. doi:10.1016/S0009-8981(98)00073-4
14. Ooi TC, Cousins M, Ooi DS, et al. Postprandial remnant-like lipoproteins in hypertriglyceridemia. J Clin Endocrinol Metab. 2001;86:3134–3142. doi:10.1210/jcem.86.7.7627
15. Matsuba I, Saito Y, Yamashita S, et al. Effect of pemafibrate on hepatic insulin sensitivity and glucose uptake assessed by hyperinsulinemic–euglycemic clamp in patients with dyslipidemia. J Atheroscler Thromb. 2020;27:134–145. doi:10.5551/jat.49767
16. Shinozaki S, Tahara T, Kawashima H, et al. Pemafibrate improves hepatic inflammation and stiffness in patients with metabolic dysfunction-associated steatotic liver disease. Hepatol Res. 2023;53:123–132.
17. Yamamoto K, Fujii H, Yoneda M, et al. Combined effects of pemafibrate and dietary intervention on hepatic steatosis and lipid metabolism in patients with hypertriglyceridemia. Nutr Metab Cardiovasc Dis. 2022;32:987–995.
18. Hida Y, Imamura T, Kinugawa K. Impact of pemafibrate therapy on reducing small dense low-density-lipoprotein-cholesterol levels in patients with hypertriglyceridemia. J Clin Med. 2023;12:6915. doi:10.3390/jcm12216915
19. Komiya I, Yamamoto A, Sunakawa S, Wakugami T. Pemafibrate decreases triglycerides and small, dense LDL, but increases LDL-C depending on baseline triglycerides and LDL-C in type 2 diabetes patients with hypertriglyceridemia: an observational study. Lipids Health Dis. 2021;20:17. doi:10.1186/s12944-021-01434-8
20. Hirano T, Hayashi T, Sugita H, et al. Prospective randomized comparative study of the effect of pemafibrate add-on or double statin dose on small dense low-density lipoprotein-cholesterol in patients with type 2 diabetes and hypertriglyceridemia on statin therapy. J Diab Investig. 2023;14:1401–1411. doi:10.1111/jdi.14076
 © 2026 The Author(s). This work is published and licensed by Dove Medical Press Limited. The
full terms of this license are available at https://www.dovepress.com/terms
and incorporate the Creative Commons Attribution
- Non Commercial (unported, 4.0) License.
By accessing the work you hereby accept the Terms. Non-commercial uses of the work are permitted
without any further permission from Dove Medical Press Limited, provided the work is properly
attributed. For permission for commercial use of this work, please see paragraphs 4.2 and 5 of our Terms.
© 2026 The Author(s). This work is published and licensed by Dove Medical Press Limited. The
full terms of this license are available at https://www.dovepress.com/terms
and incorporate the Creative Commons Attribution
- Non Commercial (unported, 4.0) License.
By accessing the work you hereby accept the Terms. Non-commercial uses of the work are permitted
without any further permission from Dove Medical Press Limited, provided the work is properly
attributed. For permission for commercial use of this work, please see paragraphs 4.2 and 5 of our Terms.
Recommended articles
Effects of Pemafibrate on Cardio-Ankle Vascular Index (CAVI) in Patients with Type 2 Diabetes or Ischemic Heart Disease: A 24-Week Observational Study
Watanabe Y, Nonaka S, Yamaoka S, Nakamura S, Horikawa O, Yamaguchi T, Sato S, Todani S, Sugizaki Y, Ito T, Mikamo H, Takahashi M, Nagayama D, Shimizu K, Saiki A
Vascular Health and Risk Management 2025, 21:293-304
Published Date: 24 April 2025