Back to Journals » Vascular Health and Risk Management » Volume 22
A Nonlinear Association Between Gamma-Glutamyltransferase to High-Density Lipoprotein Cholesterol Ratio and Arterial Stiffness in Japanese Population: A Secondary Analysis Based on a Cross-Sectional Study
Authors Shi LM, Gao YX, Yang JQ, Wang LL, Wang GM
Received 13 August 2025
Accepted for publication 15 January 2026
Published 27 January 2026 Volume 2026:22 560291
DOI https://doi.org/10.2147/VHRM.S560291
Checked for plagiarism Yes
Review by Single anonymous peer review
Peer reviewer comments 2
Editor who approved publication: Professor Roland Asmar
Liu-Ming Shi,1 Yu-Xu Gao,1 Jia-Qi Yang,1 Li-Li Wang,2 Gui-Ming Wang1
1Department of Vascular Surgery, First Hospital/First Clinical Medical College of Shanxi Medical University, Taiyuan, People’s Republic of China; 2Department of Gynaecology, The First Hospital of Shanxi Medical University, Taiyuan, People’s Republic of China
Correspondence: Gui-Ming Wang, Email [email protected]
Background: Evidences suggested that gamma-glutamyltransferase (GGT) to high-density lipoprotein cholesterol (HDL-C) ratio (GTHR) was a reliable surrogate indicator for fatty liver disease, diabetes, metabolic syndrome. However, the relationship between GTHR and the presence of arterial stiffness remains unclear in healthy population. In the present study, we aimed to explore the association between GTHR and arterial stiffness (AS) in a health check-up population from Japan.
Methods: This study is a secondary analysis from a health check-up program carried out at Murakami Memorial Hospital, Gifu, Japan between March 2004 and December 2012. A total of 912 individuals were included in this study. Patients were divided into three groups according to the tertiles of LogGTHR. The univariate linear regression model and the multivariate models were performed to explore the association between between LogGTHR and baPWV. Smoothed curve fit analysis was used to explore the linear or the nonlinear relationship between LogGTHR and baPWV. The modification and interaction of subgroup were inspected by the likelihood ration test.
Results: After adjusting for confounders, there is a nonlinear relationship between LogGTHR and baPWV (β=30.08, 95%CI: − 33.12 to 93.29, P=0.351). The inflection point was 1.43. When K< 1.43 (80.37% of the participants), the relationship was positively correlated (β=165.15, 95%CI: 62.72 to 267.58, P=0.0016), while when ≥ 1.43, there was a negative association between LogGTHR and baPWV (β= − 106.23, 95%CI: – 209.25 to − 3.21, P=0.0436). Subgroup analysis suggested that LogGTHR was not associated with baPWV in any of these subgroups.
Conclusion: In this cross-sectional study, there was a nonlinear positive association between LogGTHR and AS. LogGTHR was positively related with baPWV when less than 1.43, while this association was negative when LogGTHR was > 1.43.
Keywords: gamma-glutamyltransferase to high-density lipoprotein cholesterol ratio, brachial-ankle pulse wave velocity, arterial stiffness
Introduction
Brachial-ankle pulse wave velocity (baPWV) is a reliable indicator for quantitatively assessing the degree of arterial stiffness.1 As an independent risk factor for cardiovascular events, baPWV is widely used in health check-ups and epidemiological investigations.2 Accumulating evidence suggests that higher baPWV was associated with an increased risk of future cardiovascular and cerebrovascular disease,1,3,4 hypertension5 and diabetes.6 Considering the clinical significance of baPWV, it is of vital importance to investigate the reliable biomarkers to identify high-risk populations.
Gamma-glutamyltransferase (GGT) is an indicator widely used in clinical practice for evaluating the degree of liver function impairment. Evidences suggested a close relationship between GGT and insulin resistance (IR), and an increased GGT was an independent predictor for the risk of Type 2 diabetes.7–9 Moreover, elevated GGT has been shown to associate with the chronic inflammatory reaction derived from hypersensitive C-reactive protein (hs-CRP).10 In addition, higher GGT was shown as an independent predictor for cardiovascular mortality,11 stroke12 and metabolic syndrome.13 A lipid indicator, high-density lipoprotein cholesterol (HDL-C) could stimulate glucose uptake and improve β-cell function, while a lower HDL-C suggesting decreased β-cell function and IR.14,15 Furthermore, lower HDL-C was also a manifestations of metabolic syndrome16 and a risk factor for diabetes.17,18
In recent years, accumulating studies focused on the the predictive value of GGT to HDL-C ratio (GTHR) in diabetes,19 nonalcoholic fatty liver disease,20,21 metabolic syndrome21 and cardiovascular disease mortality.22 Moreover, diverse relationship including the linear, nonlinear or J-shaped relationships were shown.19–22 Although the exact pathogenesis is still undetermined, it is well established that IR was closely associated with AS.23 Considering the association between GGT, HDL-C, and IR, we speculated that GTHR may play a role in the development of AS. Therefore, we aimed to investigate the relationship between GTHR and AS, to better screen the high risk patients, therefore providing an early lifestyle intervention in these patients.
Methods
Study Population and Data Collection
The data in the present study were obtained from a open access database “DATADRYAD”. Researchers can download the raw data freely from the official website (www.Datadryad.org). In this study, we re-analyzed the data from a previously published study titled “Association between serum γ-glutamyltranspeptidase and atherosclerosis: a population-based cross-sectional study (10.5061/dryad.m484p).” It is a health check-up program carried out by Takuya Fukuda et al at Murakami Memorial Hospital, Gifu, Japan between March 2004 and December 2012, which aims to improve public health by early screening the patients at high risk of chronic diseases and identifying the potential risk factors. The inclusion and exclusion criteria and the study flowchart are shown in Figure 1. A total of 912 individuals were included in this study. Written informed consent were obtained from all the participants and the study was consistent with the principles of Declaration of Helsinki.
 |
Figure 1 The flowchart of this study. |
Assessment of baPWV, GTHR and Other Indicators
The indicators included in this study are consistent with the original data file. The demographic characteristics including age, sex, body mass index (BMI) were recorded. Comorbidities including blood pressure, smoking, drinking, exercise situation and fatty liver condition were re-analyzed. The laboratory indicators including alanine aminotransferase (ALT), aspartate transaminase (AST), γ-glutamyltranspeptidase (GGT), fasting glucose, uric acid, estimated glomerular filtration rate (eGFR), total cholesterol (TC), triglyceride (TG), low-density lipoprotein cholesterol (LDL-C) and high-density lipoprotein cholesterol (HDL-C) were compared. The details of blood biochemical testing and the data collection have been well described in the original study, therefore we did not repeat it. The automatic waveform analyzer (Colin Medical Technology, Komaki, Japan) was used to measure baPWV to assess the degree of AS quantitatively. The method used and the notes for attention were described in detail in the original study. In this study, AS was determined when baPWV >1400 cm/s according to the previous study.
Statistical Analysis
Continuous variables were shown as mean ±standard deviation or median (quartile), which were compared using one-way ANOVA or Kruskal–Wallis H-test, respectively. Categorical data were displayed in percentage, which were compared by chi-squared tests. We used the univariate linear regression model to assess the relationship between LogGTHR and baPWV. The multivariate models including the unadjusted, minimally adjusted and fully adjusted analyses were displayed in this study. The indicators adjusted followed the rules: when added the parameter to this model, changed the matched odds ratio by at least 10%.17 Furthermore, we also used a generalized additive model to identify the nonlinear relationship. If nonlinear relationship was determined, a two-piecewise linear regression model was used to evaluate the threshold effect of LogGTHR on baPWV in terms of the smoothing plot. Recursive method calculates automatically the inflection point, where the maximum model likelihood will be used. The stratified linear regression models were used to perform subgroup analyses. The modification and interaction of subgroup were inspected by the likelihood ration test. All of the data analysis were carried with the R packages. A two-side P-value<0.05 was considered statistically significant.
Results
Baseline and Clinical Characteristics
A total of 912 participants were included in this study. Patients were divided to three groups according to the the tertiles of the LogGTHR. We discovered that patients in the high LogGTHRG group had a higher incidence of male, fatty liver disease, current smoking, ex-smoking, AS, an increased level of BMI, systolic and diastolic blood pressure, AST, ALT, γGTP, fasting glucose, uric acid, TC, TG, LDL-C, GTHR, alcohol consumption, baPWV, while a decreased level of HDL-C, eGFR (P<0.05) (Table 1). Other indicators including age and ABI were comparable among the three groups (P>0.05) (Table 1).
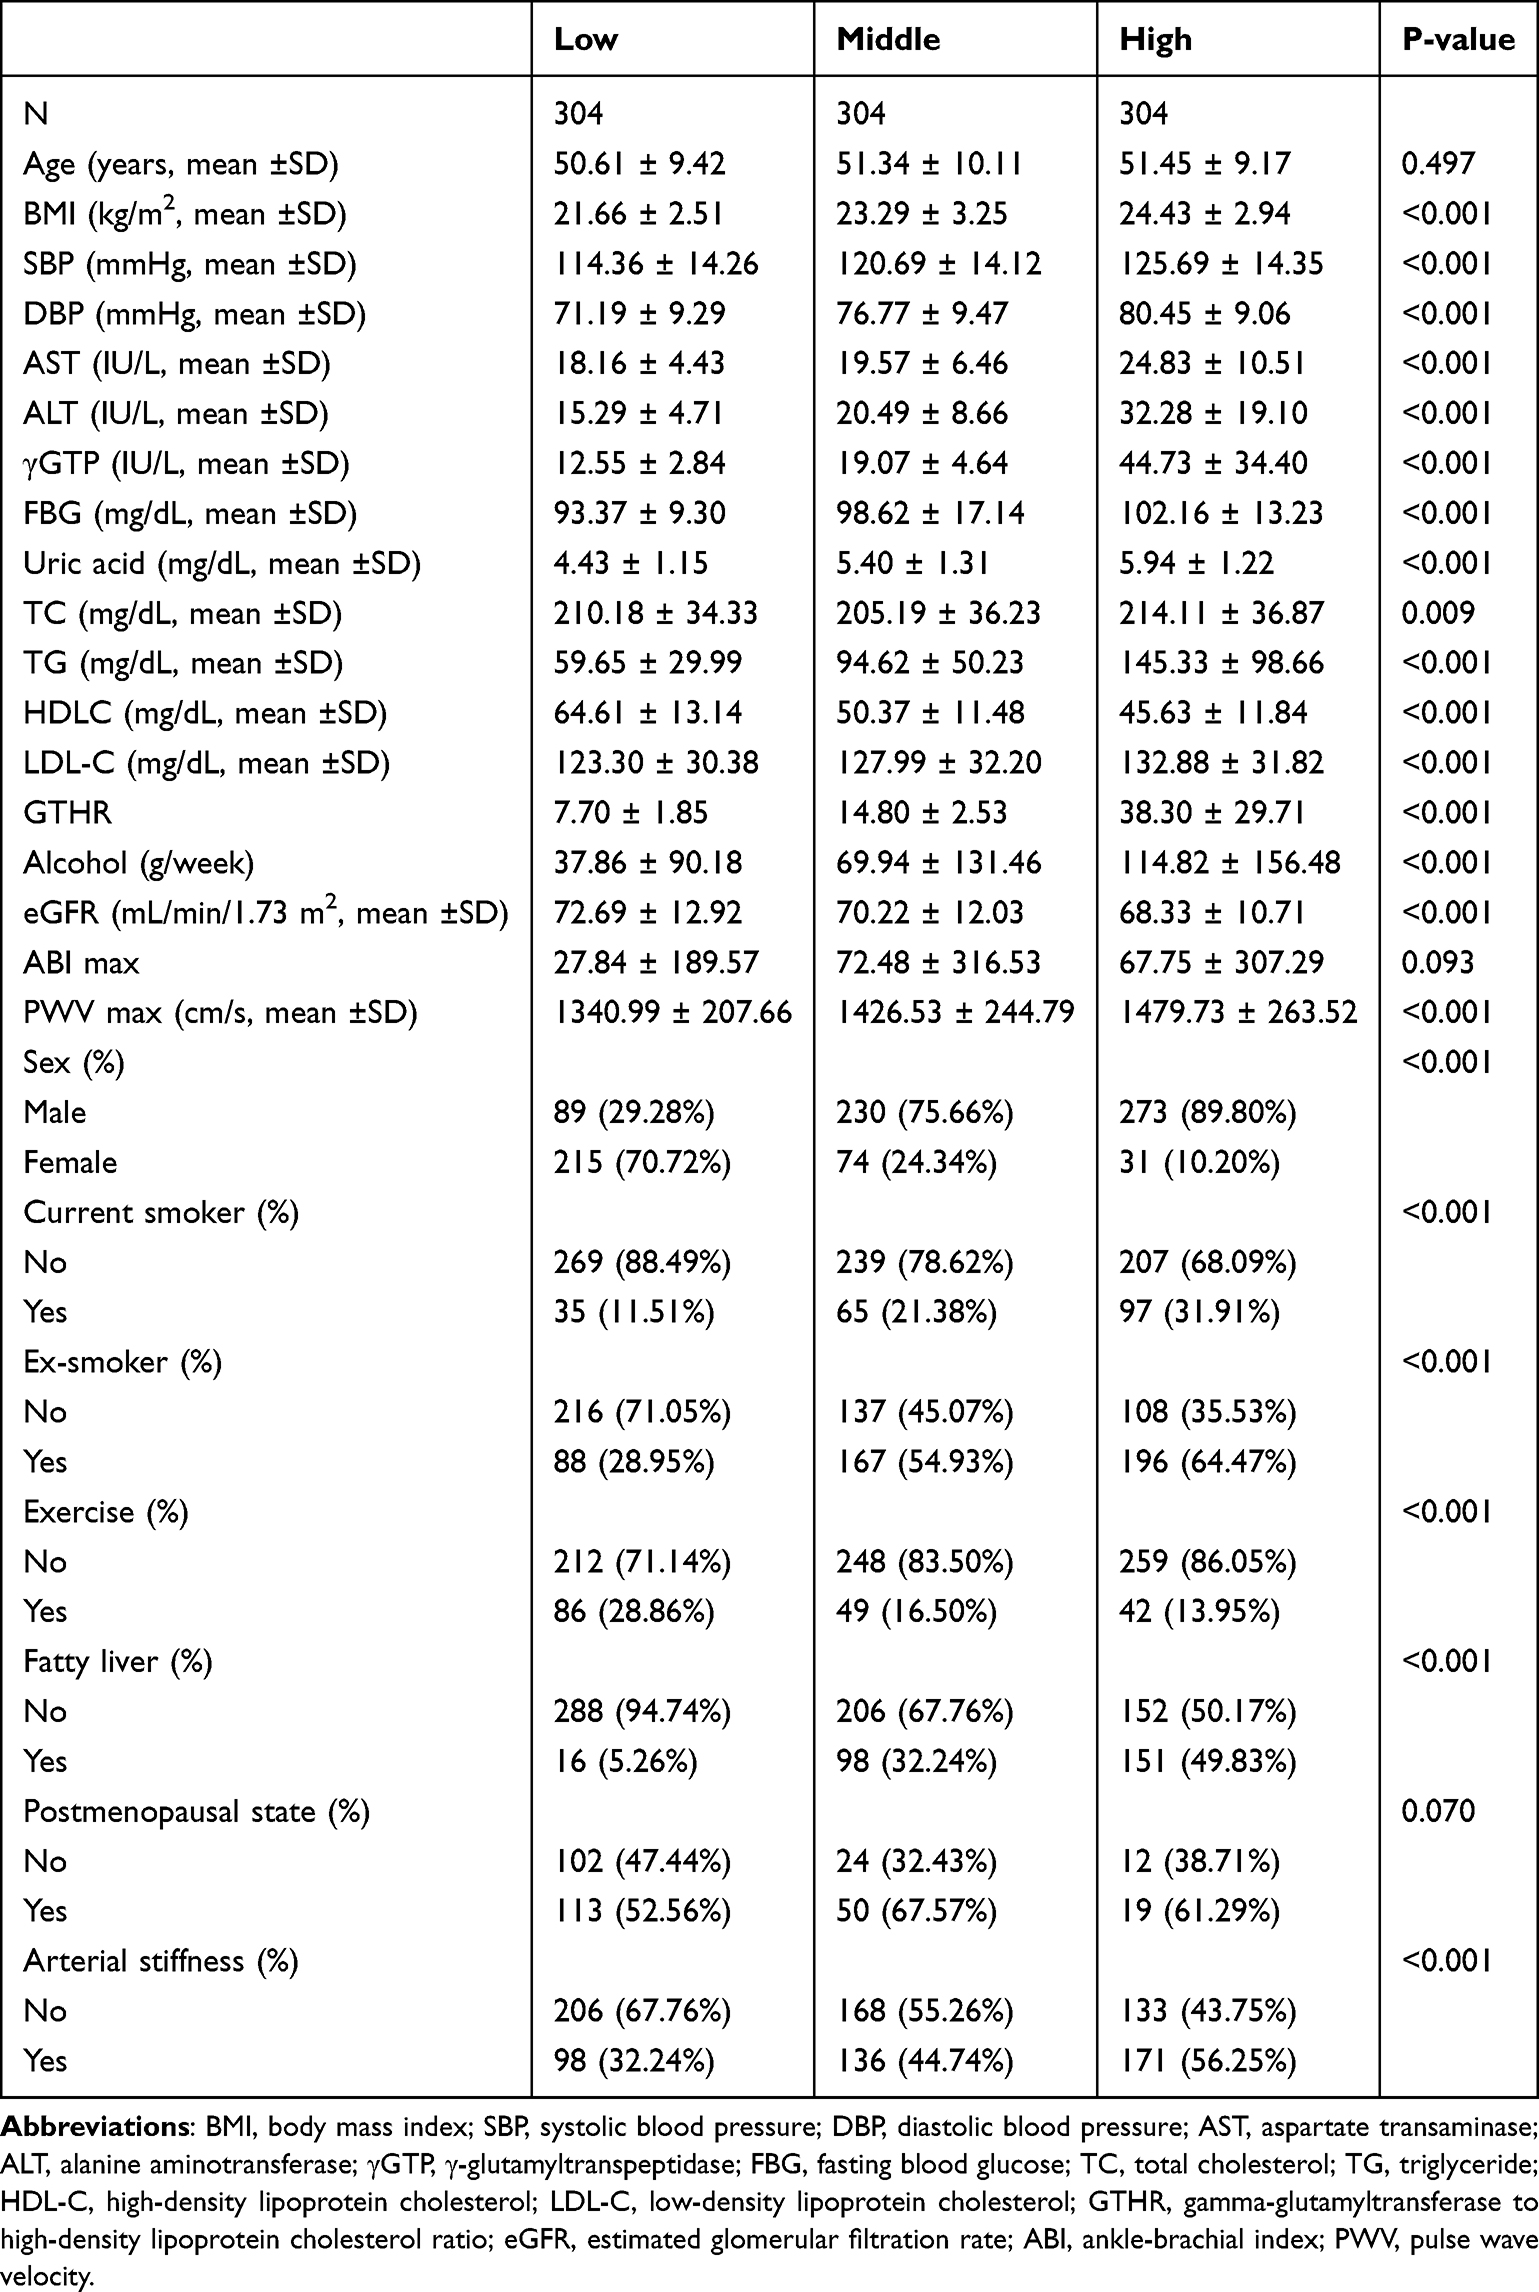 |
Table 1 Baseline Characteristics of Participants According to LogGTHR Tertiles |
Univariate Analysis
Univariate analysis showed that male, age, SBP, DBP, AST, ALT, fasting glucose, γGGT, uric acid, TC, TG, HDL-C, LDL-C and fatty liver were positively associated with AS (P<0.05) (Table 2). We also found that eGFR was negatively associated with higher AS (P<0.05) (Table 2). Parameters including BMI, smoking status, alcohol consumption, exercise and ABI were not correlated with AS (P>0.05) (Table 2).
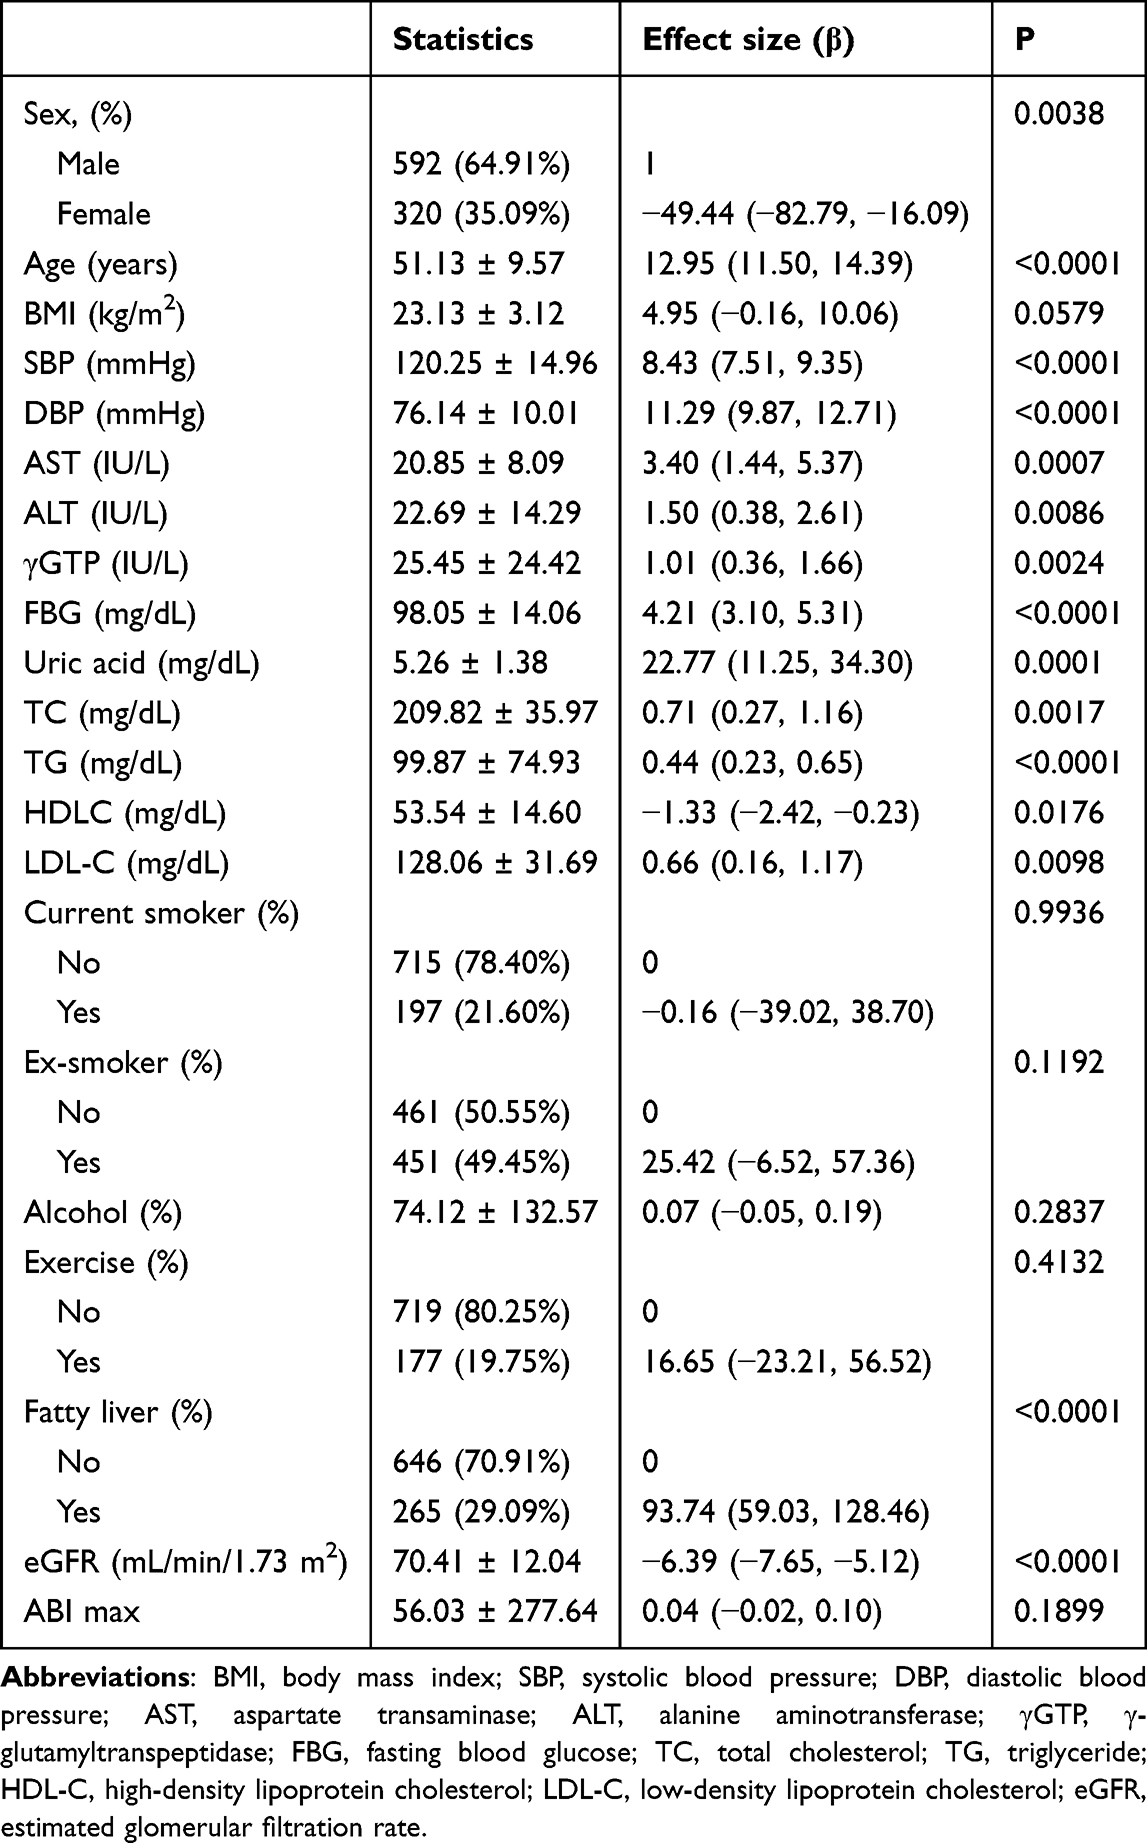 |
Table 2 The Results of Univariate Analysis |
The Relationship Between GTHR and baPWVs
The univariate linear regression model was performed to investigate the relationship between LogGTHR and baPWV. We found that LogGTHR was positively correlated with baPWV in the nonadjusted model (β= 162.94, 95%CI: (confidence interval) 110.67 to 215.21, P<0.0001) (Table 3). We also discovered a significant change in minimally adjusted model (β= 131.93, 95%CI: 79.56 to 184.30, P<0.0001). However, no statistical significance were found in full adjusted models (β= 24.18, 95%CI: −35.99 to 84.34, P=0.4312) (Table 3). In addition, when LogGTHR was considered as categorical variable (tertiles), the same trend was also observed in nonadjusted and minimally adjusted model (trend was P<0.001) (Table 3).
 |
Table 3 Relationship Between GTRH and baPWV in Different Models |
The Analyses of Nonlinear Relationship
Since LogGTHR was continuous data, therefore the nonlinear analysis was performed. We discovered that there is a nonlinear relationship between LogGTHR and baPWV (β= 30.08, 95%CI: −33.12 to 93.29, P=0.351) after adjusting for age, sex, BMI, SBP, DBP, AST, ALT, GGT, uric acid, fasting glucose, TC, HDL-C, LDL-C, eGFR, smoking, and exercise status, fatty liver, alcohol consumption, and ABI (Figure 2). The inflection point was 1.43. When K<1.43 (80.37% of the participants), the relationship was positively correlated (β= 165.15, 95%CI: 62.72 to 267.58, P=0.0016), while when ≥1.43, there was a negative association between LogGTHR and baPWV (β= −106.23, 95%CI:-209.25 to −3.21, P=0.0436). (Table 4).
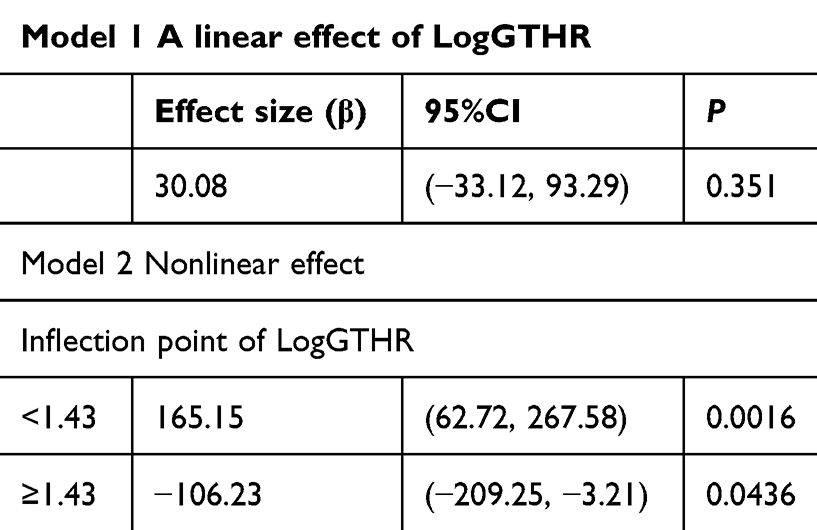 |
Table 4 The Results of Two-piecewise Linear Regression Model |
 |
Figure 2 The relationship between GTHR and baPWV. A nonlinear relationship between them was detected after adjusting for age, sex, BMI, SBP, DBP, AST, ALT, uric acid, fasting glucose, TC, TG, LDL, eGFR, smoking, and exercise status, fatty liver, alcohol consumption and ABI. |
Subgroup Analyses
The subgroup analysis were shown in Table 5. We found that the test for interactions were significant for sex and fatty liver disease (P<0.05). Meanwhile while, no statistical significance were found in age, current smoking, exercise status, alcohol consumption, BMI and uric acid (P>0.05) (Table 5). We adjusted the menopausal status in female patients in the subgroup analysis, and found that the effect size of GTHR on baPWV was not altered (P>0.05) (Table 5).
 |
Table 5 Effect Size of GTHR on baPWV in Subgroups |
Discussion
In the present study, we found GTHR was not associated with baPWV in the fully adjusted model. However, after adjusting for confounders, there is a nonlinear relationship between GTHR and baPWV. The inflection point was 21.06. When K<21.06, GTHR was positively correlated with baPWV, while when ≥21.06, the association was not statistically different. To the best of our knowledge, this is the first study to explore the potential relationship between the GTHR and AS.
AS was suggested as an early sign for the evaluation of vascular damage, which is strongly associated with poor prognosis in patients with cardiovascular disease.24 In addition, patients with AS are more predisposed to develop hypertension, diabetes, obesity, and metabolic syndrome.25–28 Although AS is the result of joint action of various factors, IR may play a role in this process via low grade inflammation and oxidative responses, causing endothelial damage and AS formation.29,30 Traditionally, the hyperinsulinemic euglycemic clamp is the gold standard for evaluating the status of IR.31 Due to the high expenses, the complex and time-consuming assessment process, it is not an ideal method for the diagnosis of IR in routine clinical practice.31 Recently, some novel and simple indicators have been reported to be surrogates of IR, such as triglyceride-glucose index (TyG). Compared with the hyperinsulinemic-euglycemic clamp, the TyG index has been widely used in all individuals regardless of their insulin treatment status.32 Since then, the association between IR and AS have been widely discussed. IR derived from HOMA index,33 TyG34 and TyG-BMI35 have been associated with the presence of AS.
In the present study, we first reported the nonlinear relationship between LogGTHR and AS. We discovered that LogGTHR was positively related with baPWV when less than 1.43, while this association was negative when LogGTHR was >1.43. Evidence suggested that GGT and HDL-C were reliable parameters for evaluating IR.7–9,14,15 A higher GTHR means a higher GGT or a lower HDL-C, therefore, elevated GTHR is associated with IR. In a more recent cross-sectional study, which included 1665 Type 2 diabetes patients, the authors suggested that GTHR had a superior predictive value than TyG for the presence of metabolic syndrome.36 This indicated that GTHR was also a reliable indicator for evaluating IR, therefore, could be used a risk factor for AS. The association between GTHR, a surrogate marker of IR, and AS is also supported by the pathophysiological mechanism. Patients with IR had a disorders of glucose and lipid metabolism, causing vascular endothelial dysfunction and oxidative stress, therefore bringing in the vascular remodeling and arterial stiffness.37 In addition, chronic inflammation was often found in the phase of IR, which may lead to the damage of vascular endothelial dysfunction, resulting in the development of AS.38 In the present study, we suggested that when less than 1.43, logGTHR was positively associated and IR was an important pathogenesis in this association. However, this association was negative when LogGTHR was more than 1.43. An increased GTHR affects the arterial stiffness up to a certain point beyond which factors such as hepatic dysfunction and medication effects counterbalance the association, reflecting the saturation. The exact nature of this correlations could not determined by the present study. However, considering GTHR as an indicator for IR, patients with high risk of AS could be early identified when LogGTHR was <1.43.
Our study has several limitations: (1) This is a cross-sectional study; therefore, causal relationships could not be determined. (2) Since the data were acquired from the published sources, variables not included in the dataset could not be adjusted, which may have a influence on the results. (3) In our study, we used baPWV >1400 cm/s for the determination of AS, so the results should be interpreted in this context. (4) The participants were healthy check-up individuals from Japan, so it is unclear whether these results could apply to other populations.
Conclusion
There is a nonlinear relationship between LogGTHR and baPWV in the present study. LogGTHR was positively related with baPWV when <1.43, while this association was negative when LogGTHR was >1.43. Large scale, multicenter, prospective cohort studies are still needed to confirm our conclusions.
Abbreviations
GTHR, gamma-glutamyltransferase to high-density lipoprotein cholesterol ratio; IR, insulin resistance; baPWV, brachial-ankle pulse wave velocity; AS, arterial stiffness.
Data Sharing Statement
The datasets generated and analyzed in this study are available from the Dryad Digital Repository (https://datadryad.org/).
Ethics Approval and Informed Consent
The original study was approved by the ethics committee of the Murakami Memorial Hospital. This study was also approved by the ethics committee of the First Hospital/First Clinical Medical College of Shanxi Medical University and all participants provided informed consent before entering the research project. The study was carried out in accordance with the applicable guidelines and regulations.
Funding
Shanxi Provincial Clinical Research Center for Interventional Medicine (No. 202204010501004).
Disclosure
The authors report no conflicts of interest in this work.
References
1. Tomiyama H. Arterial stiffness: is this a marker for the current status or future? J Atheroscler Thromb. 2016;23(9):1026–10. doi:10.5551/jat.ED042
2. Huang J, Chen Z, Yuan J, et al. Association between Body Mass Index (BMI) and Brachial-Ankle Pulse Wave Velocity (baPWV) in males with hypertension: a community-based cross-section study in North China. Med Sci Monit. 2019;25:5241–5257. doi:10.12659/MSM.914881
3. Hsu PC, Lee WH, Tsai WC, et al. Comparison between estimated and brachial-ankle pulse wave velocity for cardiovascular and overall mortality prediction. J Clin Hypertens. 2021;23(1):106–113. doi:10.1111/jch.14124
4. Song Y, Xu B, Xu R, et al. Independent and Joint Effect of Brachial-Ankle Pulse Wave Velocity and Blood Pressure Control on Incident Stroke in Hypertensive Adults. Hypertension. 2016;68(1):46–53. doi:10.1161/HYPERTENSIONAHA.115.07023
5. Jiang Y, Fan F, Jia J, et al. Brachial-ankle pulse wave velocity predicts new-onset hypertension and the modifying effect of blood pressure in a chinese community-based population. Int J Hypertens. 2020;2020:9075636. doi:10.1155/2020/9075636
6. Kang J, Jeon KH, Choi KU, et al. Brachial-ankle pulse wave velocity as a predictor of diabetes development: elevated risk within normal range values in a low-risk population. J Am Heart Assoc. 2024;13(24):e037705. doi:10.1161/JAHA.124.037705
7. Perry IJ, Wannamethee SG, Shaper AG. Prospective study of serum gamma-glutamyltransferase and risk of NIDDM. Diabetes Care. 1998;21(5):732–737. doi:10.2337/diacare.21.5.732
8. Nakanishi N, Suzuki K, Tatara K. Serum gamma-glutamyltransferase and risk of metabolic syndrome and type 2 diabetes in middle-aged Japanese men. Diabetes Care. 2004;27(6):1427–1432. doi:10.2337/diacare.27.6.1427
9. Targher G. Elevated serum gamma-glutamyltransferase activity is associated with increased risk of mortality, incident type 2 diabetes, cardiovascular events, chronic kidney disease and cancer - a narrative review. Clin Chem Lab Med. 2010;48(2):147–157. doi:10.1515/CCLM.2010.031
10. Lee DS, Evans JC, Robins SJ, et al. Gamma glutamyl transferase and metabolic syndrome, cardiovascular disease, and mortality risk: the Framingham Heart Study. Arterioscler Thromb Vasc Biol. 2007;27(1):127–133. doi:10.1161/01.ATV.0000251993.20372.40
11. Vorarlberg Health Monitoring and Promotion Program Study Group; Ruttmann E, Brant LJ, Concin H, et al. Gamma-glutamyltransferase as a risk factor for cardiovascular disease mortality: an epidemiological investigation in a cohort of 163,944 Austrian adults. Circulation. 2005;112(14):2130–2137. doi:10.1161/CIRCULATIONAHA.105.552547
12. Emdin M, Passino C, Donato L, et al. Serum gamma-glutamyltransferase as a risk factor of ischemic stroke might be independent of alcohol consumption. Stroke. 2002;33(4):1163–1164. doi:10.1161/01.str.0000012344.35312.13
13. Nannipieri M, Gonzales C, Baldi S, et al. Mexico City diabetes study. Liver enzymes, the metabolic syndrome, and incident diabetes: the Mexico City diabetes study. Diabetes Care. 2005;28(7):1757–1762. doi:10.2337/diacare.28.7.1757
14. Bardini G, Dicembrini I, Rotella CM, et al. Correlation between HDL cholesterol levels and beta-cell function in subjects with various degree of glucose tolerance. Acta Diabetol. 2013;50(2):277–281. doi:10.1007/s00592-011-0339-0
15. Liang S, Yang T. Analysis of the association between changes in the GGT/HDL-C ratio and the risk of diabetes mellitus based on a latent class growth mixed modeling: a longitudinal cohort study of adults in China. Diabetes Metab Syndr Obes. 2024;17:3139–3150. doi:10.2147/DMSO.S475067
16. Cho J, Hong H, Park S, et al. Insulin resistance and its association with metabolic syndrome in Korean Children. Biomed Res Int. 2017;2017:8728017. doi:10.1155/2017/8728017
17. Xepapadaki E, Nikdima I, Sagiadinou EC, et al. HDL and type 2 diabetes: the chicken or the egg? Diabetologia. 2021;64(9):1917–1926. doi:10.1007/s00125-021-05509-0
18. Lee SH, Kim HS, Park YM, et al. HDL-cholesterol, its variability, and the risk of diabetes: a nationwide population-based study. J Clin Endocrinol Metab. 2019;104(11):5633–5641. doi:10.1210/jc.2019-01080
19. Zhao Y, Xin X, Luo XP. The relationship between the ratio of gamma-glutamyltransferase to high-density lipoprotein cholesterol and the risk of diabetes mellitus using publicly available data: a secondary analysis based on a longitudinal study in Japan. Lipids Health Dis. 2023;22(1):7. doi:10.1186/s12944-023-01772-9
20. Xing Y, Chen J, Liu J, et al. Associations between GGT/HDL and MAFLD: a cross-sectional study. Diabetes Metab Syndr Obes. 2022;15:383–394. doi:10.2147/DMSO.S342505
21. Feng G, Feng L, Zhao Y. Association between ratio of γ-glutamyl transpeptidase to high-density lipoprotein cholesterol and prevalence of nonalcoholic fatty liver disease and metabolic syndrome: a cross-sectional study. Ann Transl Med. 2020;8(10):634. doi:10.21037/atm-19-4516
22. Qiu S, Li C, Guo Z. The J-shaped relationship between the gamma-glutamyltransferase to high-density lipoprotein cholesterol ratio and mortality risk in U.S. adults. Prev Med Rep. 2025;52:102958. doi:10.1016/j.pmedr.2024.102958
23. Hill MA, Yang Y, Zhang L, et al. Insulin resistance, cardiovascular stiffening and cardiovascular disease. Metabolism. 2021;119:154766. doi:10.1016/j.metabol.2021.154766
24. Vlachopoulos C, Aznaouridis K, Stefanadis C. Prediction of cardiovascular events and all-cause mortality with arterial stiffness: a systematic review and meta-analysis. J Am Coll Cardiol. 2010;55(13):1318–1327. doi:10.1016/j.jacc.2009.10.061
25. Agbaje AO. Arterial stiffness precedes hypertension and metabolic risks in youth: a review. J Hypertens. 2022;40(10):1887–1896. doi:10.1097/HJH.0000000000003239
26. Safar ME. Arterial stiffness as a risk factor for clinical hypertension. Nat Rev Cardiol. 2018;15(2):97–105. doi:10.1038/nrcardio.2017.155
27. Zheng M, Zhang X, Chen S, et al. Arterial stiffness preceding diabetes: a longitudinal study. Circ Res. 2020;127(12):1491–1498. doi:10.1161/CIRCRESAHA.120.317950
28. Sequí-Domínguez I, Cavero-Redondo I, Álvarez-Bueno C, et al. Association between arterial stiffness and the clustering of metabolic syndrome risk factors: a systematic review and meta-analysis. J Hypertens. 2021;39(6):1051–1059. doi:10.1097/HJH.0000000000002754
29. Shoelson SE, Lee J, Goldfine AB. Inflammation and insulin resistance. J Clin Invest. 2006;116(7):1793–1801. doi:10.1172/JCI29069
30. Yaribeygi H, Farrokhi FR, Butler AE, et al. Insulin resistance: review of the underlying molecular mechanisms. J Cell Physiol. 2019;234(6):8152–8161. doi:10.1002/jcp.27603
31. Muniyappa R, Lee S, Chen H, et al. Current approaches for assessing insulin sensitivity and resistance in vivo: advantages, limitations, and appropriate usage. Am J Physiol Endocrinol Metab. 2008;294(1):E15–26. doi:10.1152/ajpendo.00645.2007
32. Tao LC, Xu JN, Wang TT, et al. Triglyceride-glucose index as a marker in cardiovascular diseases: landscape and limitations. Cardiovasc Diabetol. 2022;21(1):68. doi:10.1186/s12933-022-01511-x
33. Urbina EM, Gao Z, Khoury PR, et al. Insulin resistance and arterial stiffness in healthy adolescents and young adults. Diabetologia. 2012;55(3):625–631. doi:10.1007/s00125-011-2412-1
34. Wu S, Xu L, Wu M, et al. Association between triglyceride-glucose index and risk of arterial stiffness: a cohort study. Cardiovasc Diabetol. 2021;20(1):146. doi:10.1186/s12933-021-01342-2
35. Ding L, Jiang X. The mediating effect of TyG and its derived indices in the association between OSAHS and atherosclerosis in patients with T2DM. Sleep Breath. 2024;28(6):2469–2479. doi:10.1007/s11325-024-03081-6
36. Gong S, Gan S, Zhang Y, et al. Gamma-glutamyl transferase to high-density lipoprotein cholesterol ratio is a more powerful marker than TyG index for predicting metabolic syndrome in patients with type 2 diabetes mellitus. Front Endocrinol. 2023;14:1248614. doi:10.3389/fendo.2023.1248614
37. Liu G, Tao L, Zhu Q, et al. Association between the metabolic score for insulin resistance (METS-IR) and estimated glomerular filtration rate (eGFR) among health check-up population in Japan: a retrospective cross-sectional study. Front Endocrinol. 2022;13:1027262. doi:10.3389/fendo.2022.1027262
38. Fuentes E, Fuentes F, Vilahur G, et al. Mechanisms of chronic state of inflammation as mediators that link obese adipose tissue and metabolic syndrome. Mediators Inflamm. 2013;2013:136584. doi:10.1155/2013/136584
 © 2026 The Author(s). This work is published and licensed by Dove Medical Press Limited. The
full terms of this license are available at https://www.dovepress.com/terms
and incorporate the Creative Commons Attribution
- Non Commercial (unported, 4.0) License.
By accessing the work you hereby accept the Terms. Non-commercial uses of the work are permitted
without any further permission from Dove Medical Press Limited, provided the work is properly
attributed. For permission for commercial use of this work, please see paragraphs 4.2 and 5 of our Terms.
© 2026 The Author(s). This work is published and licensed by Dove Medical Press Limited. The
full terms of this license are available at https://www.dovepress.com/terms
and incorporate the Creative Commons Attribution
- Non Commercial (unported, 4.0) License.
By accessing the work you hereby accept the Terms. Non-commercial uses of the work are permitted
without any further permission from Dove Medical Press Limited, provided the work is properly
attributed. For permission for commercial use of this work, please see paragraphs 4.2 and 5 of our Terms.