Back to Journals » Research and Reports in Urology » Volume 12
A New Interpretation of the Standard PSA-Test
Authors Esteban EP ![]() , Almodovar-Abreu L
, Almodovar-Abreu L
Received 27 November 2019
Accepted for publication 11 February 2020
Published 2 March 2020 Volume 2020:12 Pages 75—84
DOI https://doi.org/10.2147/RRU.S240171
Checked for plagiarism Yes
Review by Single anonymous peer review
Peer reviewer comments 2
Editor who approved publication: Dr Jan Colli
Ernesto P Esteban,1 Lusmeralis Almodovar-Abreu2
1Physics Department, University of Puerto Rico-Humacao, Humacao 00791, Puerto Rico; 2Chemistry Department, University of Puerto Rico-Humacao, Humacao 00791, Puerto Rico
Correspondence: Ernesto P Esteban
Physics Department, University of Puerto Rico-Humacao, PO BOX 10100, Humacao 00792, Puerto Rico
Tel +1 787 446 6660
Email [email protected]
Background: In Puerto Rico, prostate cancer (PC) has the highest incidence and level of mortality. PC screening is performed using the standard prostatic-specific antigen (PSA) test with a cut-off value of 4.0 ng/mL. However, the standard PSA test is very controversial because it is subject to false positives and negatives.
Purpose: To establish a new interpretation of the standard PSA test based on the strong correlation between total serum PSA and tumor volume.
Patients and Methods: A PSA database of 21,980 Puerto Rican men (2004– 2015) with proven PC was provided by the Puerto Rico Cancer Center Register (PRCCR). A statistical analysis was conducted for the entire PC population divided into two categories i) age and PSA ranges and ii) diagnostic year, age ranges, and PSA ranges. The weighted first percentiles of the PSA ranges were used to define three PSA cut-off values related to small, intermediate, and large tumor volumes. Further, three baseline PSA weighted median values were calculated to enable better prognosis of PC.
Results: Three PSA cut-off values of 2.1 ng/mL, 6 ng/mL, and 10.5 ng/mL were found related to small (1.0 cc), intermediate (2.8 cc), and large (5.0 cc) PC tumor volumes, respectively. PSA values greater than the weighted median values of 3.1 ng/mL, 7 ng/mL, were associated with increased risks of tumors growing from small to intermediate and from intermediate to large size, respectively. A PSA value greater than 14.1 ng/mL was related to metastasis.
Conclusion: In this research, we have found a new interpretation of the PSA test based on PSA cut-off values correlated to small, intermediate, and large prostate cancer tumor volumes. The set of these results together with the weighted PSA median values enhance the usefulness of the standard PSA test and provide a tool for a better decision-making and treatment.
Keywords: prostate cancer, PSA, tumor volume, Puerto Rico
Introduction
In Puerto Rico, prostate cancer (PC) has the highest incidence and level of mortality of any type of cancer. In 2018, Globocan1 reported 2810 new PC cases and 505 deaths in Puerto Rico. At the global level, Puerto Rico is the country with the eighth highest rate of PC. Certainly, PC is an epidemic disease on the Island. Worldwide the PC incidence ranks second after lung cancer, with 1,276,106 new cases in 2018. Thus, the diagnosis and prognosis of PC are of paramount importance. Although a biopsy is the standard definitive medical procedure for detecting PC, a less invasive approach is to measure the total prostate-specific antigen (PSA) levels in the blood. In fact, since 1986, a clinical PSA test approved by the US Food & Drug Administration (FDA) has recommended a serum total PSA of 4.0 ng/mL as a cut-off value for PC. Unfortunately, it is well known that the standard PSA test lacks specificity and may lead to overdiagnosis and overtreatment. To improve the standard PSA test, different additional and complementary procedures with mixed results have been suggested, including i) rectal examination (DRE), ii) PSA velocity, iii) free and total PSA, iv) PSA density, v) age-specific PSA reference ranges, and vi) PSA cut-off values for different ethnic groups. Meanwhile, several serological and pathologic PC biomarkers are being developed. Among them, one of the most promising is the Prostatic Health Index2,3 (PHI). However, the original PSA test cannot be disregarded yet due to its extensive use in developing countries, low price, and easy availability.
In this paper, our main objective is achieving a better interpretation of the standard PSA test based on three PSA cut-off level values associated with small, intermediate, and large tumor volumes localized in the prostate. These PSA cut-off values together with three weighted PSA median values define seven PSA regions useful for better diagnosis and prognosis of PC.
This research was exempt from IRB review (under category 4) because PSA data accessed from the PRCCR is freely available.
Materials and Methods
In Puerto Rico, it is mandatory to report any cancer diagnosis to the Puerto Rico Central Cancer Registry (PRCCR). In 2016, we carried out the first PSA statistical study of 16,305 Puerto Rican male prostate cancer patients.4 In this paper, we expand on that study using a PSA database provided by the PRCCR (spanning from 2004 to 2015) of 21,980 Puerto Rican men with proven PC. For this research, the Puerto Rican PC patient population was divided into two cohorts. First, they were grouped into five-year spans (40–44 years to 80–84 years). Then, each age group was divided into six subgroups according to its PSA value (Table 1). Second, Puerto Rican PC patients were grouped based on their diagnostic year from 2004 to 2015. For each diagnostic year, ten age-range (40–44 years to 85+years) subgroups were formed. Then, for each age range a subgroup of six PSA ranges was formed. For space reasons we only included data of two years 2004 and 2015 in this paper (Table 2). All the data of the remaining years are available to the interested readers.
 |
Table 1 PSA Statistical Central Values by Age-Range for Puerto Rican Men with Proven Prostate Cancer (2004–2015) |
 |  |  |
Table 2 PSA Statistical Central Values by Diagnostic Year and Age-Range for Puerto Rican Men with Proven Prostate Cancer (2004—2015) |
Next, we have used the fact that there is a strong correlation between total PSA and PC tumor volumes to establish age-specific PSA reference ranges for small, intermediate, and large tumors volumes. For instance, the first two PSA subgroups (0.1 ng/mL ≤PSA≤ 3.8 ng/mL and 3.8 ng/mL ≤ PSA<5.2 ng/mL) are associated with a small tumor volume. The next two PSA subgroups (5.2 ng/mL ≤PSA <7.0 ng/mL and 7.0 ng/mL≤ PSA<10.5 ng/) are associated with intermediate tumor volumes, and finally the PSA subgroup is related to a large tumor (10.5 ng/mL ≤ PSA< 26 ng/mL). To obtain the PSA cut-off value for a small tumor volume, we retrieved from Table 1 the 1st percentile PSA value (eighth column) for each age range and PSA ranges 0.1 ng/mL ≤ PSA<3.8 ng/mL, and 3.8 ng/mL≤ PSA<5.2ng/mL (second column). Then, the first percentile was weighted with the number of cases (third column). In a similar manner, to obtain the PSA cut-off value related to an intermediate tumor we used the PSA ranges 5.2 ng/mL≤PSA<7 ng/mL and 7 ng/mL<PSA< 10.5 ng/mL and repeated all the steps described above. To define the first PSA cut-off value associated with a large tumor volume, we used the PSA range 10ng/mL<PSA< 26 ng/mL. For the weighted PSA median, we used the same procedure described for the first weighted percentile.
Results
Tables 1 and 2 summarize our statistical results. Notice that in Table 1, for 0.1ng/mL ≤PSA<3.8 ng/mL, the PSA median and mean values decrease when the age range increases. This is contrary to the popular belief that the PSA values always increase with age. In fact, only for PSA values in the range of or greater than 5.2 ng/mL≤PSA< 7.0 ng/mL do the median or mean values increase or maintain the same value as age increases. Table 2 is useful for comparing how the PSA cut-off values have evolved from 2004 to 2015. It turns out that the cut-off values have remained equal. This suggests that, in Puerto Rico, PC risk factors (genetics, race, age, diet) have not changed from 2004 to 2015. Figures 1 and 2 show histograms with different bin sizes. Figure 1 shows a right-skewed histogram with a 1-bin size and an outlier to the right. Figure 2 shows the same histogram but with a 4-bin size. A histogram for PSA values less than or equal to 4 ng/mL is shown in Figure 3. The number of Puerto Rican men with proven PC and with a PSA less or equal to 4 ng/mL is 4070, or 18.51% of the total 21,980 Puerto Rican men with proven PC in the period 2004–2015. Interestingly, Figure 3 shows that the number of cases with a PSA value of 0.5 ng/mL (2.6% of the total population) is greater than the number of cases with PSA values of 1ng/mL, 1.5ng/mL, 2.0 ng/mL, 2.5 ng/mL, and 3.0 ng/mL. Figures 4 and 5 show in percentages the number of cases in each age range and year of diagnosis, respectively. As expected, the least number of cases is in the age range 40–44 years (Figure 4). Meanwhile, the greatest number of cases is localized in the 65–69 age range. Figure 5 shows that in 2012 more PC diagnoses were recorded, while in 2004 fewer PC cases were diagnosed. Nonetheless, since the beginning of 2013, the number of PC diagnoses was always less that in the following year. Is this caused by the emigration of Puerto Rican men outside the Island? In Figure 6, the first weighted percentile PSA cut-off values levels from 2004 (solid line) and 2015 (broken line) are plotted. PSA values listed in green, blue and red are related to small, intermediate, and large tumor volumes, respectively. There is no significant difference between broken and solid lines. Thus, PSA cut-off values have not changed between 2004 and 2015 in Puerto Rico.
 |
Figure 1 Distribution of PSA for 21,980 Puerto Rican men with proven prostate cancer (2004–2015). |
 |
Figure 2 PSA histogram for 21,980 Puerto Rican men with proven prostate cancer (2004–2015). |
 |
Figure 3 Distribution of PSA of 4070 Puerto Rican men with proven prostate cancer with PSA ≤ 4 ng/mL (2004–2015). |
 |
Figure 4 PSA distribution by age-ranges of 21,980 Puerto Rican men with proven prostate cancer (2004—2015). |
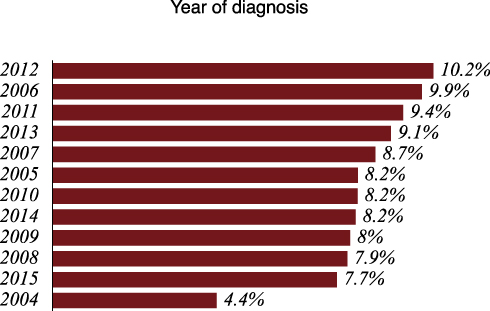 |
Figure 5 PSA distribution by diagnostic year of 21,980 Puerto Rican men with proven prostate cancer (2004—2015). |
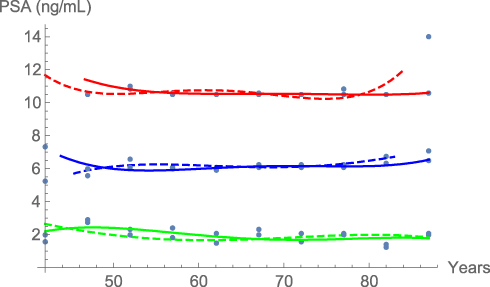 |
Figure 6 Distribution of PSA of 21,980 Puerto Rican men with proven prostate cancer for small (green), intermediate (blue), and large tumors (red) in 2004 (solid lines) and 2015 (dashed lines). |
Our main result is plotted in Figure 7. The cut-off PSA values (first PSA weighted percentile) in green, blue, and red are related to small, intermediate, and large tumor volumes. In solid and dashed lines represent the PSA first weighted percentile and PSA weighted median, respectively.
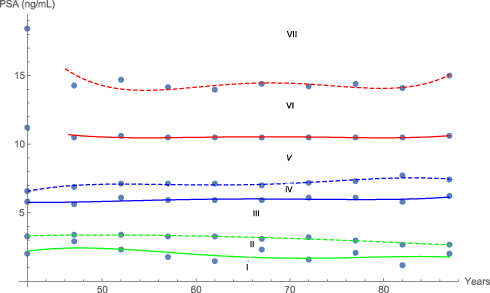 |
Figure 7 Distribution of PSA first weighted percentile (solid lines) and PSA weighted median (dashed lines) of 21,980 Puerto Rican men with proven prostate cancer for small (green), intermediate (blue), and large tumors (red). |
Discussion
It is well known that not PC is not the only cause of elevated PSA levels. Prostatitis and benign prostatic hyperplasia (BPH) also have this effect. However, past studies have shown that there is only a small percentage of men who have PC and either or both diseases concurrently. Thus, the contamination of these diseases in the PRCCR data is negligible. Although the PRCCR database does not discriminate between Puerto Rico-born or non-Puerto Rico-born men living in Puerto Rico, the Institute of Statistics of Puerto Rico5 reports that only 3.56% of men between 45 and 85 years living on the island are non-Puerto Rican.
Figures 1 and 2 show a right-skewed histogram with an outlier (427). Interestingly, the PSA distribution has two behaviors before and after a PSA value of 4 ng/mL. In the first case, the number of PC patients decreased from 580 (0.5 ng/mL) to 350 (2 ng/mL) and then increased to about 720 (4 ng/mL). After 4 ng/mL it diminished rapidly from 5230 (4 ng/mL) to 46 (<98 ng/mL). Figure 4 shows that the greater number of PC cases occurs in the 65–69 age range (23.8%). Figure 5 shows that the PC cases increased from 7.9% in 2008 to 10.2% in 2012. However, from 2012 to 2015 the number of PC cases decreased from 10.2% to 7.7%. This may be explained for the economic crisis of these years. In fact, the Census Bureau’s Community6 estimated that between 2011 and 2012 about 55,000 residents migrated from the Island to the mainland. Figure 3 shows that the number of PC patients with a PSA ≤ 4 ng/mL is about 18.5% of the overall population of Puerto Rican PC patients (2004—2015). This is in agreement with the Prostate Cancer Prevention Trial7 (PCPT), which reports that 15% of men with a PSA ≤4ng/mL have prostate cancer. Figure 6 shows that PSA cut-off values (green=2.1ng/mL, blue=6.0 ng/mL, and red=10.5 ng/mL) of years 2004 (solid line) and 2015 (dashed line). Figure 7 shows our main result. Namely, the PSA cutoffs (solid lines) and the PSA weighted median (dashed lines; green=3.1 ng/mL, blue=7.0 ng/mL, and red=14 ng/mL). Notice that a PSA cut-off value of 2.5 ng/mL has been recently recommended by the National Comprehensive Cancer Network8 in the United States and the Goteborg trial.9 This value must be compared with the PSA cut-off value (2.1 ng/mL) we obtained for a small tumor volume.
A strong correlation between preoperative total PSA and tumor volume (VT) was found by Carvalhal et-al.10 Thus, using Carvalhal et-al10 results (Figure 2B in Ref. 10), and assuming no tumor volume as PSA goes to zero, we found the respective PC tumor volumes associated with the PSA cut-off values. They are 1.0 cc, 2.8 cc, and 5.0 cc, for small, intermediate, and large PC tumor volumes, respectively.
In Figure 7, PSA cut-off values and the weighted median define the boundaries of PSA regions I to VII. Puerto Rican men with PSA values in region I are very unlike to have an aggressive form of PC. Accordingly, there is no need for treatment other than an annual frequency of a PSA test. A recommendation of “watchful waiting” is given for those with a PSA value in region II. Patients with an evolving small to intermediate PC tumor volume are localized in region III. Meanwhile, region IV includes PC patients with an intermediate PC tumor volume, and in region V includes those with intermediate tumor volumes evolving to large tumors. Region VI is for patients with a large PC tumor volume and a high risk of cancer, and in region VII includes those with a metastasis in progress. Preisser et al11 have developed a procedure for predicting the probability of metastatic in PC patients. In Table 2 (Ref. 11), they established a PSA cut-off value for metastasis (all Gleason grade group) of 13.8 ng/mL. This result is comparable to the weighted PSA median of 14.0 ng/mL (boundary between PSA regions VI and VII in Figure 7) found in this paper for the same purpose.
Conclusion
On the basis of a PSA statistical study of 21,980 Puerto Rican men with proven PC (2004—2015), we have enhanced the interpretation of the standard PSA-test. Instead of the standard cut-off value of 4.0 ng/mL we found three PSA-cutoff values related to low, intermediate, and high risk of PC. The proposed age-specific PSA-cutoff reference range (Table 1) increases specificity and allows to differentiate aggressive from non-aggressive PC tumors (Figure 7). This information is crucial for PC diagnosis and treatment. In addition, to obtain a better understanding of PC over time, we found three PSA weighted medians and defined seven PSA regions (Figure 7). Each of these PSA regions has an interpretation from active surveillance to metastasis.
The results of this research suggest a new PSA test protocol. Any Puerto-Rican men age forty or older should take a PSA test at least annually. The PSA value and the respective age are plotted in Figure 7 to determine which of the seven PSA regions (Figure 7) they are initially located within. Then, using the yearly PSA data, the patient and urologist together can monitor its evolution of the levels over the years and take appropriate medical measures measurements to control and manage the disease, if needed.
Although the results of this research are strictly valid only for men in Puerto Rico, they could be replicated in other countries with PC patients of different ethnicities.
Acknowledgments
E. P. Esteban thanks the University of Puerto Rico-Humacao for release time. L. Almodovar-Abreu acknowledges the partial support of the Louis Stokes-AMP Puerto Rico. This work was supported by a federal grant from the National Program of Cancer Registries (Grant 1NU58DP006318-02-00) to the Puerto Rico Central cancer Registry (PRCCR) at the UPR Comprehensive Cancer Center.
Disclosure
The authors report no conflicts of interest of any kind in this work.
References
1. GLOBOCAN. Estimated number of new cases in 2018, Puerto Rico, all cancers, males, all ages. 2018. Available from: http://gco.iarc.fr/today/online-analysis-pie?v=2018&mode=cancer&mode_population=continents&population=900&populations=630&key=total&sex=1&cancer=39&type=0&statistic=5&prevalence=0&population_group=0&ages_group%5B%5D=0&ages_group%5B%5D=17 items=7&group_cancer=0&include_nmsc=1&include_nmsc_other=0&half_pie=0&donut=0&population_group_globocan_id=#collapse-group-0-1.
2. de la Calle C, Patil D, Wei JT, et al. Multicenter evaluation of the prostate health index to detect aggressive prostate cancer in biopsy naive men. J Urol. 2015;194(1):65–72. doi:10.1016/j.juro.2015.01.091
3. Filella X, Gimenez N. Evaluation of [−2] proPSA and Prostate Health Index (phi) for the detection of prostate cancer: a systematic review and meta-analysis. Clin Chem Lab Med. 2013;51(4):729–739. doi:10.1515/cclm-2012-0410
4. Esteban EP, Rivera A, Rivera-Rodriguez J. Age-specific reference ranges for serum prostate-specific antigen in puerto rican men with proven prostate cancer. P R Health Sci J. 2019;38(2):87–91.
5. Velázquez-Estrada AL Perfil del migrante. 2019. [updated de agosto de 23, 2019]. Available from: https://www.estadisticas.pr/.
6. Bureau C Migration Puerto Rico 2011–2012. 2012. Available from: https://www.census.gov/en.html.
7. Thompson IM, Ankerst DP, Chi C, et al. Assessing prostate cancer risk: results from the prostate cancer prevention trial. J Natl Cancer Inst. 2006;98(8):529–534. doi:10.1093/jnci/djj131
8. Network NCC. Prostate cancer. 2019. [Updated 2019]. Available from: https://www.nccn.org/patients/guidelines/content/PDF/prostate-patient.pdf.
9. Hugosson J, Godtman RA, Carlsson SV, et al. Eighteen-year follow-up of the goteborg randomized population-based prostate cancer screening trial: effect of sociodemographic variables on participation, prostate cancer incidence and mortality. Scand J Urol. 2018;52(1):27–37. doi:10.1080/21681805.2017.1411392
10. Carvalhal GF, Daudi SN, Kan D, et al. Correlation between serum prostate-specific antigen and cancer volume in prostate glands of different sizes. Urology. 2010;76(5):1072–1076. doi:10.1016/j.urology.2009.11.056
11. Preisser F, Bandini M, Nazzani S, et al. Development and validation of a lookup table for the prediction of metastatic prostate cancer according to prostatic-specific antigen value, clinical tumor stage, and Gleason grade groups. Eur Urol Oncol. 2019. doi:10.1016/j.euo.2019.03.003.
 © 2020 The Author(s). This work is published and licensed by Dove Medical Press Limited. The
full terms of this license are available at https://www.dovepress.com/terms
and incorporate the Creative Commons Attribution
- Non Commercial (unported, 3.0) License.
By accessing the work you hereby accept the Terms. Non-commercial uses of the work are permitted
without any further permission from Dove Medical Press Limited, provided the work is properly
attributed. For permission for commercial use of this work, please see paragraphs 4.2 and 5 of our Terms.
© 2020 The Author(s). This work is published and licensed by Dove Medical Press Limited. The
full terms of this license are available at https://www.dovepress.com/terms
and incorporate the Creative Commons Attribution
- Non Commercial (unported, 3.0) License.
By accessing the work you hereby accept the Terms. Non-commercial uses of the work are permitted
without any further permission from Dove Medical Press Limited, provided the work is properly
attributed. For permission for commercial use of this work, please see paragraphs 4.2 and 5 of our Terms.