Back to Journals » Psychology Research and Behavior Management » Volume 15
A Network Analysis of the Association Between Intergroup Contact and Intergroup Relations
Authors Yu D, Zhao Y, Yin C, Liang F ![]() , Chen W
, Chen W ![]()
Received 31 August 2021
Accepted for publication 9 December 2021
Published 7 January 2022 Volume 2022:15 Pages 51—69
DOI https://doi.org/10.2147/PRBM.S336740
Checked for plagiarism Yes
Review by Single anonymous peer review
Peer reviewer comments 2
Editor who approved publication: Dr Igor Elman
Video abstract of "Association between intergroup contact and intergroup relations" [ID 336740].
Views: 265
Dongfang Yu,1,2 Yufang Zhao,1,3 Chenzu Yin,4 Fangmei Liang,4 Wenyu Chen5
1Center for Studies of Education and Psychology of Ethnic Minorities in Southwest China, Southwest University, Chongqing, People’s Republic of China; 2Reader Service Dept, Guangxi University of Finance and Economics, Nanning, People’s Republic of China; 3Faculty of Psychology, Southwest University, Chongqing, People’s Republic of China; 4School of Teacher Education, Hechi University, Hechi, People’s Republic of China; 5College of Computer and Information Science, Southwest University, Chongqing, People’s Republic of China
Correspondence: Yufang Zhao
Faculty of Psychology, Southwest University, Chongqing, 400715, People’s Republic of China
Email [email protected]
Purpose: Intergroup contact is an effective strategy to improve intergroup relationships. Although intergroup relationships have been studied extensively, the individual roles of quantity and quality of contact in relationships with cognition, emotion, and intention of behavior toward other ethnic minority groups are not fully understood. This study explores the situation via network analysis among Zhuang and Yao ethnic minorities in Southwest China.
Methods: We investigated the quantity and quality of intergroup contact and cognition, emotion, and intention of behavior among a sample of 543 Zhuang and 490 Yao ethnic group members. Data were analyzed using the R-package. Network structures were analyzed via the Qgraph package, and the accuracy and stability of the network were measured via the Bootnet package; communities were detected via the Igraph package; bridge analyses were conducted via the Networktools package; and the network difference was compared via the Network Comparison Test package.
Results: The results indicated perceived intimacy is the central node. Quantity of contact constructed a community with “perceived connection,” “sense of community,” “knowledge about out-group,” and “perceived similarity.” Meanwhile, quality of contact constructed a community with “intergroup attitude” and a “feeling thermometer.” The remainder of the nodes constructed two additional communities. The network global connectivity and structure between the two ethnic groups were highly similar.
Conclusion: The study examined the quantity and quality of intergroup contact via network analysis for two ethnic minority groups. It was shown that the two groups’ global network structures of intergroup contact and their effects are highly similar. Specifically, quantity and quality of contact produce different effects on intergroup relations. Quantity of contact has proximal effects, including instant cognitive and emotional response without depth cognition, while quality of contact has proximal effects that may change deep-seated cognition and subsequently improve intergroup relations.
Keywords: quantity, quality, community analysis, network global connectivity, ethnic minorities, intergroup relationships
Introduction
In more than 70 years of empirical research, intergroup contact has been found to have robust relations with intergroup outcomes.1 Past studies have found intergroup contact improves intergroup relationships, such as promoting intergroup attitudes2 and shortening social distance.3 Some studies revealed quality of contact as a key functional role, while others observed quantity of contact as the key.4–7 A number of studies assess quantity and quality of contact in combination.8 However, as the variables adapted to measure intergroup contact and intergroup relationships, the effect sizes of contact on dependent variables varied in different studies.9 We propose that quantity of contact and quality of contact are sensitive to different dependent variables, respectively. That is, some variables may associate strongly with the quantity of contact, while others may with the quality of contact. Using network analysis, quantity and quality of contact and the outcome variables toward outgroups are conceptualized as a network structure. This offers an overview of the connection patterns among quantity of contact, quality of contact, and the outcomes toward outgroups, revealing which outcomes are strongly connected to quantity and quality of contact when exploring various effects of quantity and quality of contact simultaneously. Such an analysis can provide a reference for both practical work and studies on intergroup contact.
The network perspective is increasingly used to model the complexity of systems to explore multiple interconnected factors.10 It makes it possible to examine the contemporaneous relationships among a given set of variables, controlling for all other variables in the network, thus allowing for a global representation of the structure of a psychological phenomenon.11 Using network analysis, we are able to further understand intergroup contact and its related outcomes.
The Association Between Intergroup Contact and Intergroup Relations
Intergroup contact hypothesis is a dominant theoretical and applied framework to resolve intergroup conflicts and improve intergroup relations.12,13 Intergroup contact has been found to positively affect various variables that represent the significant positive transformation of intergroup relations within samples ranging from ethnic minority groups (including immigrants), the elderly, people with disabilities to religious groups.5,14–16 Guided by the review from Pettigrew et al, we summarized these variables from three aspects: 1) new cognition about out-groups, such as improving one’s knowledge about the history, language, and value of an out-group,9 perceiving similarity,17 generating a sense of community,18 reducing social distance,3 and improving intergroup attitude5; 2) emotion toward out-groups or contact, such as perceiving the intimacy of contact,6 stimulating out-group empathy,19 perceiving connection,20 and increasing feelings of warmth6; and 3) intention of behavior toward out-groups, such as improving willingness to approach contact in the future21 and out-group helping intentions.22
According to an integrative model of intergroup contact, both quantity and quality of contact impact intergroup relationships.23 Quantity of contact refers to the frequency with which a person comes into contact with an out-group or a specific number of out-groups, while quality of contact is the degree to which contact is pleasant and cooperative.8,24 Previous studies have looked at the association between intergroup contact and intergroup relationships. However, the effect size of quantity and quality of contact on outcomes are varying.9 For instance, from the point of contact, Nicole Tausch et al assessed quantitative and qualitative contact between Hindus and Muslims in India, and found contact quantity predicted social distance (r = −0.47) and contact quality (r = −0.23).25 Méndez Fernández et al found quantity of contact could not directly predict social distance, but quality of contact significantly predicted social distance (r = −0.36).26 Obviously, the effect size of quantity and quality of contact on the same outcomes differ. Considering the result variable, Pettigrew et al reviewed existing literature and found there are many types of positive outcomes beyond reducing prejudice, and, additionally, showed great heterogeneity in effect size.9 Similarly, in various studies, we found some variables are strongly associated with quality of contact, while others with quantity of contact. For instance, numerous studies have shown quality of contact predicts positive out-group attitude, rather than quantity of contact.4,5 Quality of contact between Americans with a certain racial/ethnic outgroup in America predicts out-group helping intentions (r = 0.42).27 Further, quality of imagined contact with Eastern Europeans in British nationals predict out-group empathy (r = 0.46) and social distance (r =−0.33).3 However, other studies found quantity of contact between students from two schools in the UK predicted desired closeness (r = 0.48) and negative evaluation (r = −0.33).6 Further, quantity of contact between non-indigenous people and indigenous Mapuche participants in Chile is related to intergroup knowledge (r = 0.37).7 Drawing on the existing literature analyzed by regression or the structural equation model,3–7,27 we can see the effects of quantity and quality of contact on different result variables vary.
Using network analysis, quantity and quality of contact and the outcome variables toward out-groups can be conceptualized as a network structure. This offers an overview of the connection patterns among quantity of contact, quality of contact, and the outcomes toward out-groups, revealing which outcomes are strongly connected to quantity of contact and which are strongly connected to quality of contact when exploring the various effects of quantity and quality of contact simultaneously.
Despite the extensive literature, a very small number of studies have investigated the effects of intergroup contact in China.18,21 Accordingly, we know very little about whether findings generated for other populations can be generalized to intergroup relations in China. There are 55 Chinese ethnic minority groups. The southwest region holds more than 30 permanently settled ethnic minorities, such as Zhuang and Yao in the Guangxi Zhuang Autonomous Region (equivalent to a province). We argue that the intergroup contact between ethnic minorities in China plays an important role in the research on the generalizability of contact effect.
Network Analysis
Network analysis conceptualizes psychological processes by considering them a network.28 It supposes that a certain phenomenon emerges from the causal interaction among specific beliefs, emotions, and behaviors that are measured by observed variables.29 These observed variables constitute a network, within which they are modeled as a set of nodes and edges and visualize how they interact with one another; thus, this can help researchers clarify the relations between the variables.30 Specifically, nodes usually represent observed variables. A network’s centrality (such as closeness, betweenness, and strength of nodes) could indicate a core variable that is the most influenced factor in the generation or maintenance of the psychological phenomenon; edges usually represent relationships among nodes and can differ in strength of connection, indicating whether a relationship is strong (commonly visualized with thick edges) or weak (thin, less saturated edges) and positive (green edges) or negative (red edges).29,31 In the intergroup contact field, quantity and quality of contact and the outcome variables toward out-groups can be conceptualized as a network structure. In other words, this can provide an overview of the connection patterns among all of the variables, revealing which variables are most closely related to each other.
An advantage of network analysis is the investigation of whether nodes cluster into communities. The nodes that belong to one “community” tend to have a stronger connection with each other, and a weaker connection with nodes in other communities. Community detection determines whether or not the variables form statistically discernible clusters, which helps to understand how specific variable groups might be crucial to the network system and to comprehend the properties of dynamic processes in a network.32,33 In this study, we use a cluster spin glass algorithm to test whether quantity and quality of contact and the outcome variables toward outgroups cluster into distinct communities,34 revealing which outcomes are strongly connected. Those strongly connected to quantity of contact are named as the proximal effects of quantity, and those strongly connected to quality of contact are named as the proximal effects of quality. The communities without quantity and quality of contact are named as the distant effects of contact. Community detection would help clarify the relationship between quantity and quality of contact and various outcomes toward out-groups.
Present Study
Pettigrew et al reviewed existing literature and found that there were many types of positive outcomes beyond reducing prejudice caused by intergroup contact; additionally, these outcomes had great heterogeneity in effect sizes.9 He proposed these outcomes expanded the range of contact’s effects across both cognitive and affective domains.9 Later research found another outcome domain, exploring whether intergroup contact causes changes in intention of behavior. For example, Johnston et al showed intergroup contact was associated with increases in out-group helping intentions.27 In order to explore the association between intergroup contact and intergroup relationships, drawing on the existing literature, we chose outcome variables that represent the positive transformation of intergroup relationships from three aspects:
(1) Cognitive indicators. Pettigrew et al found intergroup contact increases out-group knowledge and positive out-group attitudes.9 Other studies found intergroup contact with Eastern Europeans among British nationals predicted less social distance.3 Intergroup contact between the ethnic minority and majority in China is associated with a sense of Chinese national community.18 Individuals who experience more intergroup interactions may re-categorize in-group and former out-group members as a new in-group, which could increase perceived similarity.17
(2) Emotional indicators. Pettigrew et al found intergroup contact increased out-group empathy.9 Other studies found intergroup contact between students from two schools in UK predicted desired closeness.6 Intergroup contact (culture mixing) between the Yi minority and Dai minority in China could increase perceived connection and the feeling of warmth toward out-groups.20
(3) Intention of behavior. Intergroup contact between Americans with a certain racial/ethnic out-group in America predicted out-group helping intentions.27 Positive intergroup contact between the ethnic minority and majority in China demonstrates a willingness to approach contact in the future.21
Although within our range of reading we have not found literature related to network analysis in the field of intergroup contact research, the existing literature can indicate the effects that interethnic minority contact may generate in China. Given the special function of network analysis as mentioned above, the present article aims to use network analysis to construct a network that includes quantity of contact, quality of contact, intergroup attitude, social distance, out-group knowledge, out-group empathy, increasing feelings of warmth, sense of community, perceived connection, perceived similarity, perceived intimacy of contact, out-group helping intention, and willingness to approach contact. Using network analysis, we explore the central node which may strongly influence intergroup relation, cluster the variables to confirm which outcome variables are highly connected with the quantity and quality of contact, and compare whether the networks are statistically different between two ethnic minorities samples in contact.
We argue that the Zhuang and Yao ethnic minorities are typically representative for studying intergroup contact in China. Zhuang is the most populous Chinese ethnic minority group, with an estimated population of 16.93 million, of which 92.88% lives in Guangxi. As an indigenous people in southern China, they have their own language and costume, creating many myths, legends and folktales, such as the myth of Buluotuo. Their traditional costume features embroidery, such as a jacket with embroidered piping and an embroidered waist and embroidered shoes. The “SAN YUE SAN” is an annual grand song festival for Zhuang. During that day, people dress in traditional costume and gather in “Ge Xu”, a specific place for group singing, to sing Zhuang folk songs and dance Zhuang folk dances.
Yao is one of the oldest Chinese ethnic minority groups, with a population of about 2.85 million, of which approximately 60.00% lives in Guangxi. Yao ancestors can be traced back to one branch of the ancient eastern tribal alliance named “nine Li.” They migrated from the lower reaches of the Yellow River basin to the southern region for survival in ancient times. While moving south, they were divided into 36 collateral series; accordingly, the Yao cultures are very rich and treasured. Their costume varies from region to region. The “BaiKu Yao” in Nandan of Guangxi is noted for wearing white shorts, and the “Hong Yao” in GuiLin of Guangxi is famous for wearing red dresses. However, most Yao people have a common traditional festival called “PanWang Jie”, which commemorates their ancestors.
Although ethnic minorities had conflicts through history, there are no conflicts between the Zhuang and Yao ethnic groups in modern times. Given their close geographical distribution, the Zhuang and Yao experience natural intergroup contact. The conditions under which they come in contact with each other in daily life are approximate to the optimal principles: equal status between the groups in the situation; common goals; intergroup cooperation; and the support of authorities, law, or custom. This makes them a representative case for studying intergroup contact.
Materials and Methods
Participants
Through convenience sampling, 1033 participants (32.60% male, 67.40% female; Mage = 20.40 years, SD = 1.31) from the Guangxi Zhuang Autonomous Region of China were invited to participate in the questionnaire survey. Of these, 543 (39.20% male, 60.80% female; Mage = 20.30 years, SD = 1.04) are Zhuang ethnic group members and 490 (25.30% male, 74.70% female; Mage = 20.50 years, SD = 1.30) are Yao ethnic group members. In this investigation, 563 participants are from multi-ethnic communities, in which multi-ethnic people live, and 470 from mono-ethnic communities, in which the same ethnic minority lives compactly. Questionnaires were administered face-to-face to students in colleges or universities.
Ethical Statements
The research was approved by the Scientific Review Committee of the Faculty of Psychology of Southwest University of the People’s Republic of China (H20074) and conducted in accordance with the principles of the Declaration of Helsinki. Prior to participating in the study, participants were informed that the questionnaire was completely anonymous, only the researcher has access to the data collected, and the data collected would be used only for academic research. And then all participants signed informed consent. Further, informed consent was obtained. Each participant received a ¥5 reward at the end of the survey.
Measures
The questionnaires used in the study came from published literature, and the two-way translation procedures were adopted to ensure the consistency of content and meaning in both the Chinese and English versions.
Intergroup Quantity of Contact
We measured “intergroup contact quantity” with seven items,35,36 such as “I often play with Yao/Zhuang members” and “I often go to Yao/Zhuang localities.” The response scale ranged from 1 (strongly disagree) to 7 (strongly agree), with higher scores indicating higher quantity (αtotal=0.910, αZhuang=0.875, αYao=0.895.).
Intergroup Quality of Contact
A six-item scale was used to measure “intergroup contact quality” (based on Voci and Hewstone).8 Questions included: “When you meet with Yao/Zhuang members, in general, do you find the contact to be equal?” “When … pleasant?” Participants responded to these items on a 7-point Likert scale (1 = not at all; 7 = very much; αtotal=0.937, αZhuang=0.941, αYao=0.933.).
Perceived Connection
Perceived connection was measured with a five-item scale.20 Participants indicated the extent of their agreement with statements such as “I feel a bond with the Yao/Zhuang people,” on a 7-point scale (from 1 = totally disagree to 7 = totally agree; αtotal=0.868, αZhuang=0.889, αYao=0.842.).
Out-Group Knowledge
We measured out-group knowledge with four items adapted from previous research,7 such as: “In general, how much do you know about the Yao/Zhuang minority?” “In … history?” “In … language?” “In … values?” (from 1 = very little knowledge to 7 = a lot of knowledge; αtotal=0.898, αZhuang=0.853, αYao=0.921.).
Perceived Similarity
We measured the degree to which participants perceived themselves as similar to the Yao/Zhuang minority via a four-item scale.37 A sample item was “With respect to personality, I think I am very similar to the Yao/Zhuang minority” (from 1 = extremely dissimilar to 7 = extremely similar; αtotal=0.916, αZhuang=0.918, αYao=0.909.).
Out-Group Empathy
Out-group empathy was measured with Hayward et al:19 “It is difficult for me to put myself in the shoes of the Yao/Zhuang minority” (1 = strongly disagree, 7 = strongly agree; reverse coded such that higher scores indicate greater empathy).
Perceived Intimacy of Contact
We measured perceived intimacy of contact with an item adapted from previous research.38 Participants rated the extent of intimacy they perceived when in contact with the Yao/Zhuang minority (1 = not intimate at all; 7 = very intimate).
Sense of Community
This was measured with six items.39 Participants indicated their extent of agreement with statements, such as “I feel a sense of contact with Yao/Zhuang people” and “I feel intimate with Yao/Zhuang people I spent time with” (1 = strongly disagree, 5 = strongly agree; αtotal=0.771, αZhuang=0.765, αYao=0.743.).
Out-Group Helping Intention
Out-group helping intention was measured using a brief out-group helping scenario:22 “If a Yao/Zhuang classmate hoped you would assist to complete his/her homework problem which you have just finished, would you mind helping him/her?” Participants indicated their likelihood of offering help on a 10-point Likert scale (1 = not at all likely; 10 = extremely likely) adapted from previous research.40
Social Distance
We measured how favorable participants were of contacting Yao/Zhuang people with eight items representing layers of in-depth relationship (eg, classmates, neighbor, roommate, in‐laws; 1 = not at all to 7 = very much).3 Higher scores mean less social distance from the out-group (αtotal=0.975, αZhuang=0.978, αYao=0.973.).
Willingness to Approach Contact
We measured participants’ willingness to approach contact with Yao/Zhuang people on two items:41 “If you were free to choose, would you like to have more contact with Yao/Zhuang people?” (1 = not at all; 7 = very much), and “To what extent do you feel you try to avoid contact with Yao/Zhuang people?” (reverse scored, 1 = not at all; 7 = very much; αtotal=0.830, αZhuang=0.865, αYao=0.781.).
Intergroup Attitude
We measured intergroup attitude based on Wright et al. Participants indicated their feelings towards Yao/Zhuang people in general on a series of bipolar adjective pairs (1–7; cold–warm, negative–positive, hostile–friendly, contempt–respect).2 Higher scores indicate more positive intergroup attitudes (αtotal=0.950, αZhuang=0.952, αYao=0.946.).
Feeling Thermometer
Participants indicated a feeling of warmth towards Yao/Zhuang people on a scale called “feeling thermometer”, ranging from 0 degrees (extremely cold) to 11 (extremely warm).38
Statistical Analysis
Data Preparation
First, following the tutorial on the application of network analysis, we applied a non-paranormal transformation to transform the variables.42 This transformation ensures that the data including the marginal distributions are multivariate normal, and all relationships between variables are linear; thus, they meet relevant assumptions for the estimated network analyses.43 Second, to identify nodes that most likely measure the same underlying construct, we implemented a data-driven method to identify potentially redundant nodes among our variables via the Networktools package.44 A redundancy index below 0.25 indicated possible redundancy.45 This method did not identify any redundant variables in our study.
Network Estimation
We estimated a Gaussian graphical model (GGM) with the GLASSO (graphical lasso) algorithm with extended Bayes information criteria (EBIC) model selection.43 The GLASSO algorithm is a coordinate descent procedure for the lasso,46 a method of estimation for sparse undirected graphical models by minimizing the residual sum of squares subject to the sum of the absolute value of the coefficients being less than a constant.47 EBIC is a Bayesian paradigm for model selection, which considers the number of unknown parameters and the complexity of the model space, allowing the number of covariates to increase to infinity with the sample size and incur a small loss in the positive selection rate; however, it tightly controls the false discovery rate.48 EBIC has proven to have a desirable property in many applications.49 The GLASSO with EBIC model selection has an overall high specificity but varying sensitivity based on the true network structure and sample size.29 Hence, we adopted it for our network analysis.
The network is represented through nodes (variables) and edges (relationships between variables). Two nodes are considered conditionally dependent if an association is identified between them as the relationships between variables are regularized partial correlations. If an edge cannot be found between two nodes, they are supposed to be conditionally independent and do not share a unique association.50 The network estimation was via the Qgraph package.51
To measure the intra-network property, we estimated centrality indices of each node: betweenness, closeness, and strength. Strength is the sum of the partial correlations between a node and the other nodes.31 As a higher strength represents a stronger influence of the activation of one node on the other node,52 it is usually considered the main centrality parameter.32 In the present research, strength will be considered the main centrality measure.
Accuracy, Stability, and Intra-Network Comparisons
Accuracy, stability, and intra-network comparison analyses were performed in accordance with Epskamp and Fried.43 The accuracy of the edge and strength values was indicated by 95% bootstrapped confidence intervals. Case-dropping subset bootstraps were applied to indicate the stability of the strength.43 The bootstrap approach was used to test the statistical difference of strength of nodes and edges. Node predictability is an absolute measure of the connectedness of network nodes to explain the variance of each node among other nodes in the network.53 We estimated each node’s predictability for the network and represented it in a pie chart.
Community Detection
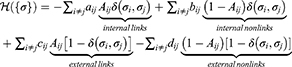
Communities are interconnected groups within which the nodes are heavily connected but sparsely connected to the rest of the network.33 The quality function for an assignment of nodes into communities is the Hamiltonian function as follows54:
where  denotes the adjacency matrix of the graph with
  , if an edge is present and zero otherwise.
  denotes the spin state (or group index) of node
  in the graph, and
  denote the weights of the individual contributions, respectively. The number of spin states
  determines the maximum number of groups allowed and can be as large as
  , the number of nodes in the network. For weighted networks, this approach is generalized by using a weighted adjacency matrix
  . With a directed network with a nonsymmetric adjacency matrix
  , one can construct a symmetric representation of the network introducing
  and.
and.  . We apply undirected, unweighted adjacency matrices. Our choice of weights allows us to further simplify the Hamiltonian:
This represents a spin glass with couplings  between all pairs of nodes: ferromagnetic, in which links between nodes exist, and antiferromagnetic, in which they are absent. For more information on the Hamiltonian function, please consult other relevant literature.54 The community detection was implemented via the Igraph package.
Bridge Analyses
To find distinctive communities, we test whether certain nodes function as “bridges.” Bridge nodes are those connecting separate communities,45 indicating associations between them.55 They are pivotal to maintaining information, material, and energy exchanges of crossing modules throughout a network.42 Bridge strength is the sum of the absolute value of all edges that exist between node A and all nodes that are not in the same community as node A. High strength bridge nodes are especially likely to activate nearby communities.45 In our study, bridge analysis helps identify potential factors (nodes) that connect proximal effects of a community to other communities. We identified the bridge nodes by computing bridge strength value via the Networktools package.44
Network Comparison
We investigated whether the networks estimated in the Yao and Zhuang minorities differed statistically. First, we evaluated the overall similarity index between networks.56 Second, we used the Network Comparison Test (NCT) to test whether the two minorities’ networks significantly differ in overall connectivity, distribution of edge weights, and strength centrality.57
Results
Descriptive Statistics
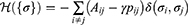
Descriptive information is listed in Table 1. Pearson product–moment correlations of non-paranormal-transformed variables are reported in Figure 1.
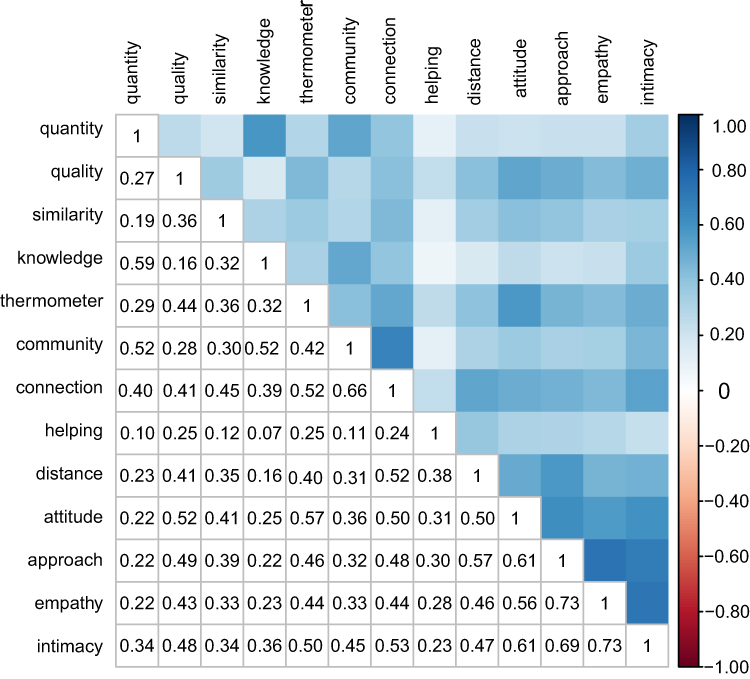 |
Figure 1 Pearson product–moment correlations between each variable. Abbreviations: quantity, quantity of contact; quality, quality of contact; similarity, perceived similarity; thermometer, feeling thermometer; community, sense of community; connection, perceived connection ; helping, outgroup helping intention; distance, social distance; attitude, intergroup attitude; approach, willingness to approach contact; empathy, outgroup empathy; knowledge, knowledge about outgroup; intimacy, perceived intimacy of outgroup contact. |
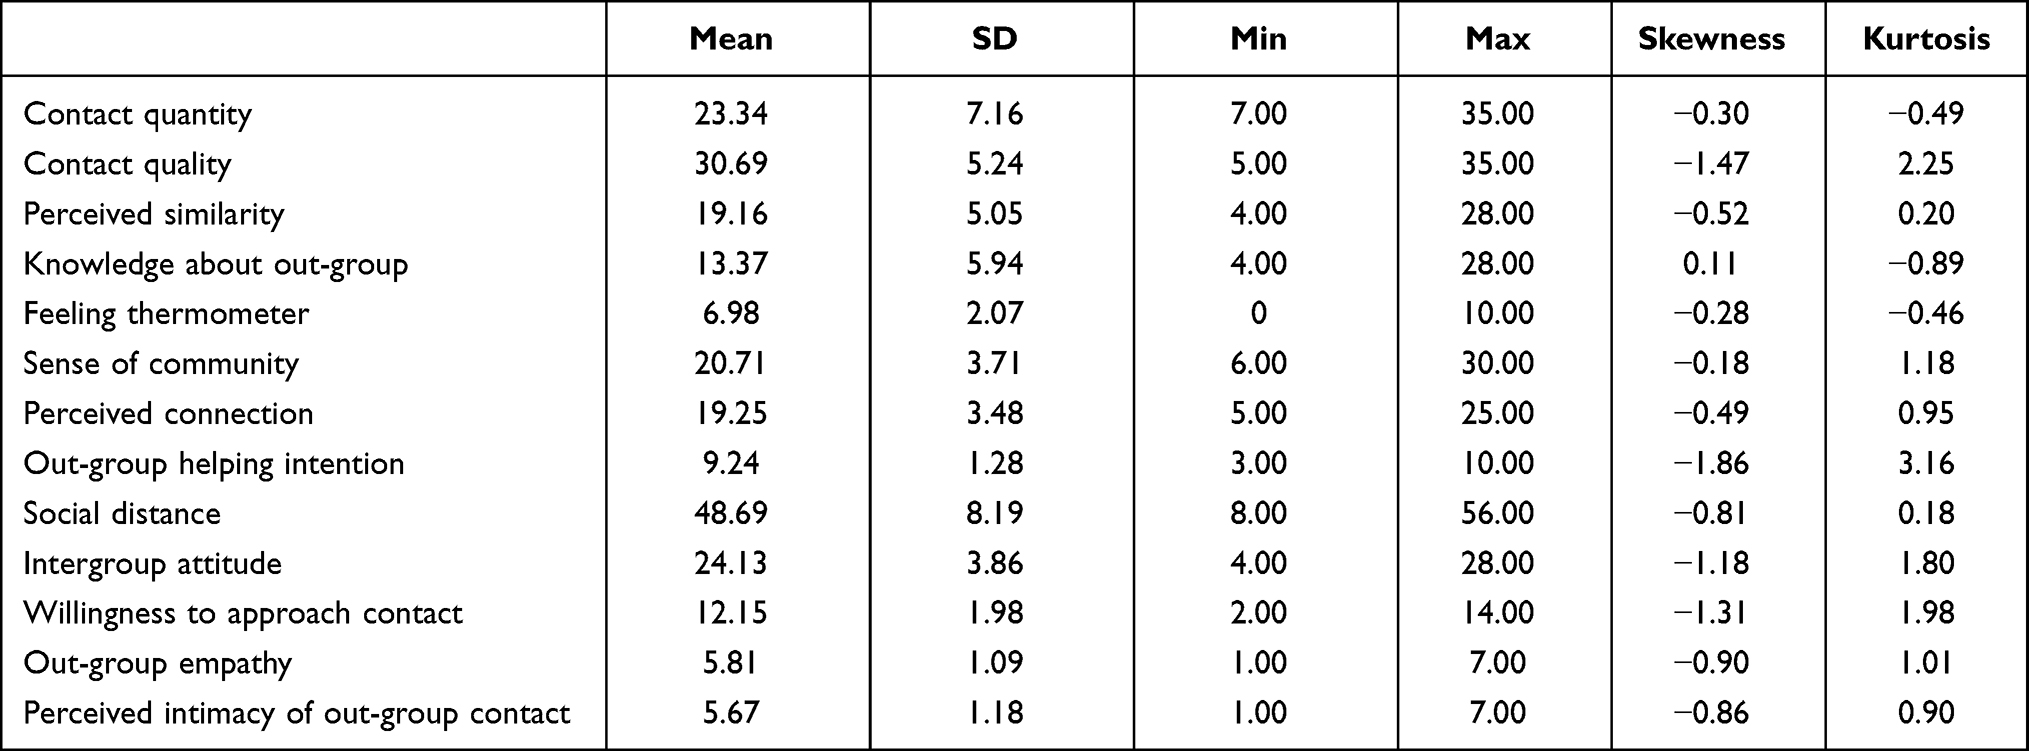 |
Table 1 Mean, Standard Deviation (SD), Minimum (Min), Maximum (Max), Skewness, and Kurtosis of Each Variable (Before Nonparanormal Transformation) |
Network Estimation and Centrality Analysis
The estimated EBIC graphical network nodes and edges are represented in Figure 2. The network had several obvious features. First, all connections were positive, as all the edges were green. Second, the densest connections between nodes were “out-group empathy” and “willingness to approach contact” (r = 0.73), and “out-group empathy” and “perceived intimacy of out-group contact” (r = 0.73). The loosest connections between nodes were “knowledge about out-group” and “out-group helping intention” (r = 0.07). Third, quantity and quality of contact had different connections with other nodes. Quantity of contact is strongly connected to out-group knowledge (r = 0.59), and a sense of community (r = 0.52), but quality of contact is strongly connected to intergroup attitude (r = 0.52).
Centrality analysis revealed that the most central node is the “perceived intimacy of out-group contact” (Figure 3) according to strength value—the most common centrality index.34 It is notable that perceived intimacy of out-group contact had relatively higher values on all three centrality measures, suggesting that perceived intimacy of out-group contact can directly influence many other nodes (or be influenced by them) without considering mediation by other nodes. In contrast, out-group helping intention had low values on all three centrality measures.
 |
Figure 2 Graphical Gaussian model network constructed via the graphical LASSO. Abbreviations: QT, quantity of contact; QL, quality of contact; PS, perceived similarity; kAO, knowledge about outgroup; FT, feeling thermometer; SOC, Sense of community; PC, perceived connection; OHI, outgroup helping intention; SD, social distance; IA, intergroup attitude;WTAC, willingness to approach contact; OE, outgroup empathy; PIOOC, perceived intimacy of outgroup contact. |
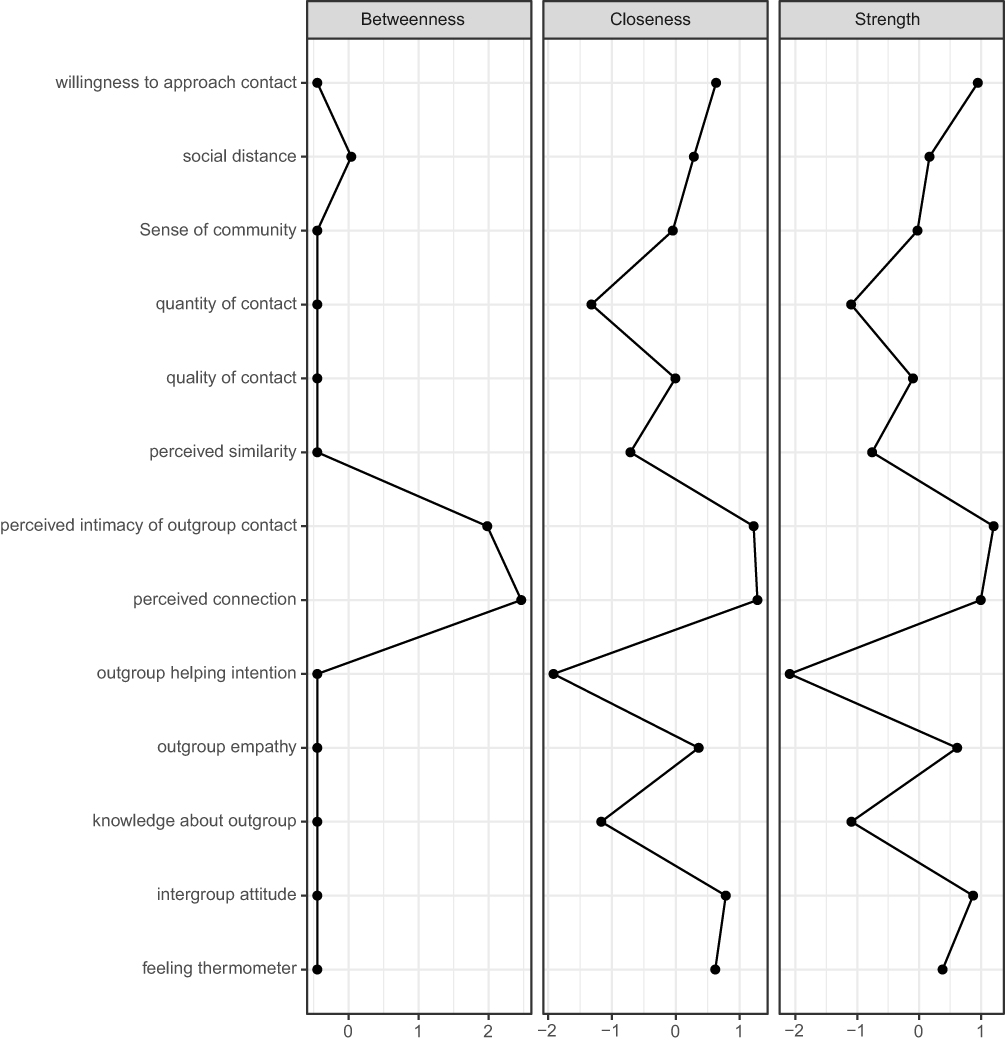 |
Figure 3 Centrality estimates of intergroup contact depicting strength, betweenness, and closeness. |
Accuracy, Stability, and Intra-Network Comparison Analyses
Bootstrapped 95% confidence intervals for the edge weights were narrow, suggesting that the estimates were highly accurate (Figure 4). Bootstrapped difference tests showed that the strongest and weakest edges differ significantly from each other (Figure 5).
To quantify the stability of the centrality index, we processed the case-dropping subset bootstrap procedure. The value of strength, betweenness, and closeness remain highly stable even after dropping large proportions of the sample (Figure 6), as their correlation stability coefficients are 0.75, 0.67, 0.75, respectively. Epskamp et al advised that values should preferably range between 0.25 and 0.50 for sufficient stability.43 Meanwhile, the comparison of strength indicated that 52.56% of the nodes were statistically different from each other (Figure 7), and nodes with higher strength significantly differed from ones with lower strength.
The mean node predictability is 0.49, which means that, on average, nodes share 48.70% of their variance with surrounding nodes. The node with the highest predictability is “willingness to approach contact” (0.67). The node with the lowest predictability is “out-group helping intention” (0.16).
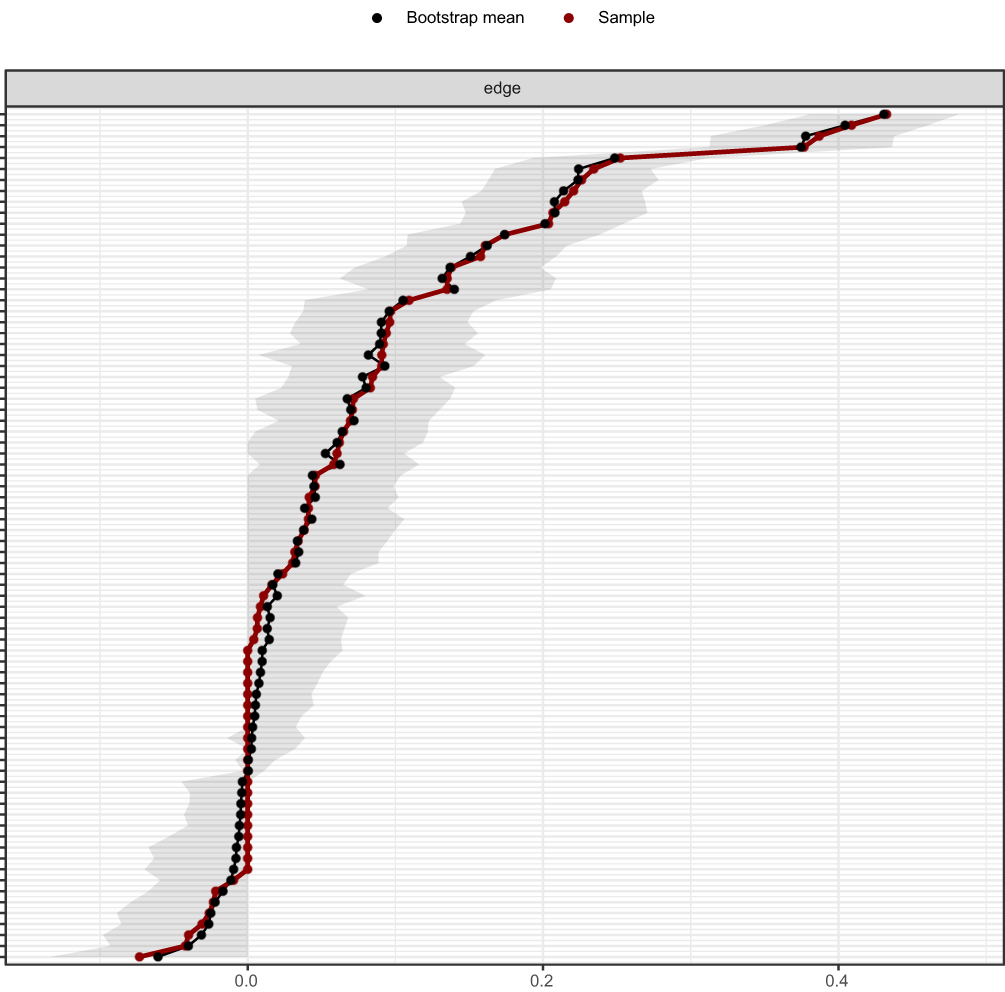 |
Figure 4 Bootstrapped confidence intervals of estimated edge – weights for the estimated network of intergroup contact. |
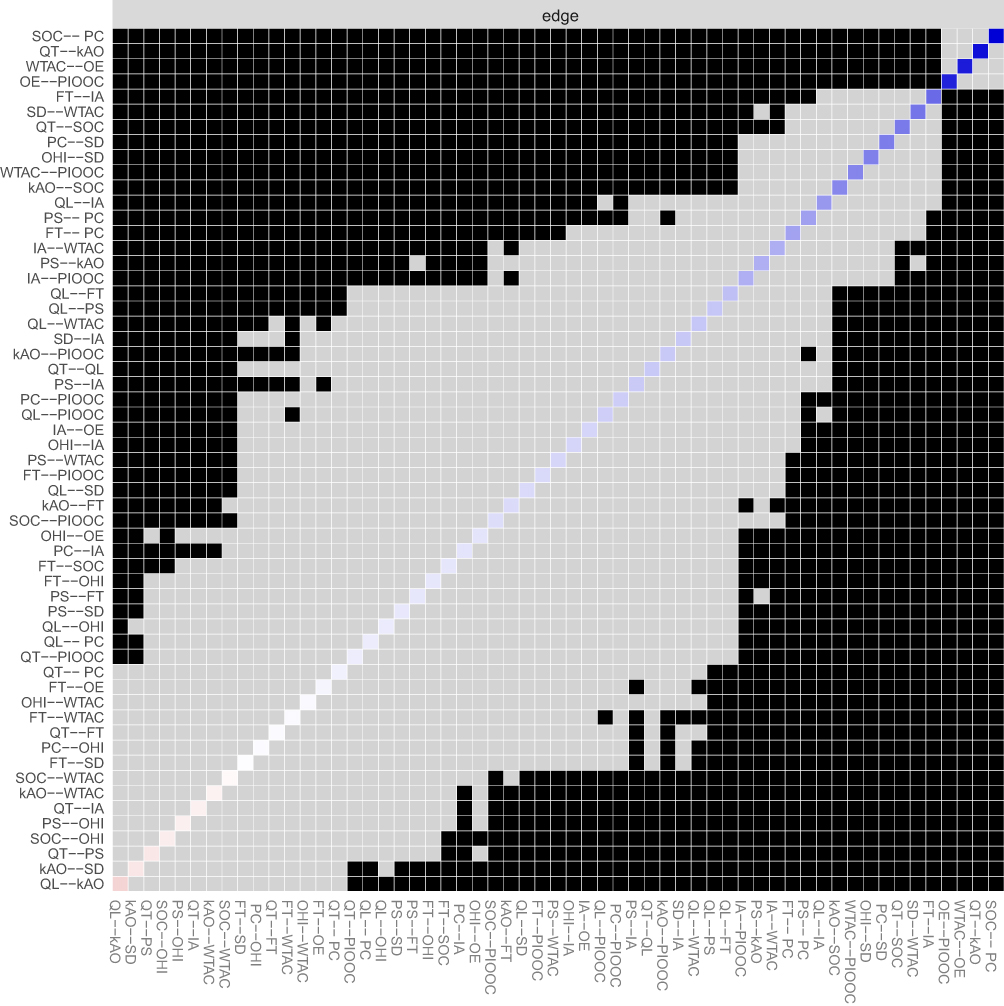 |
Figure 5 Bootstrapped difference of estimated edge – weights for the estimated network of intergroup contact. |
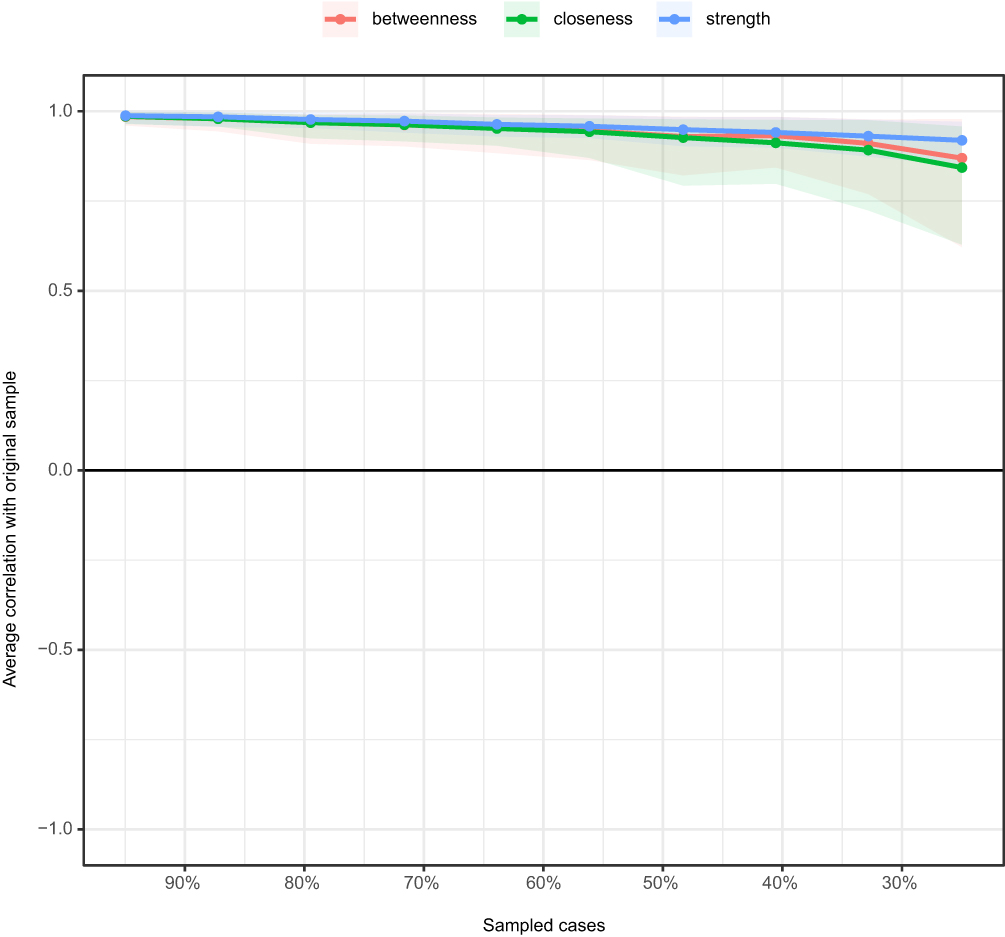 |
Figure 6 Average correlations between centrality indices of networks sampled with case dropped and the original sample. |
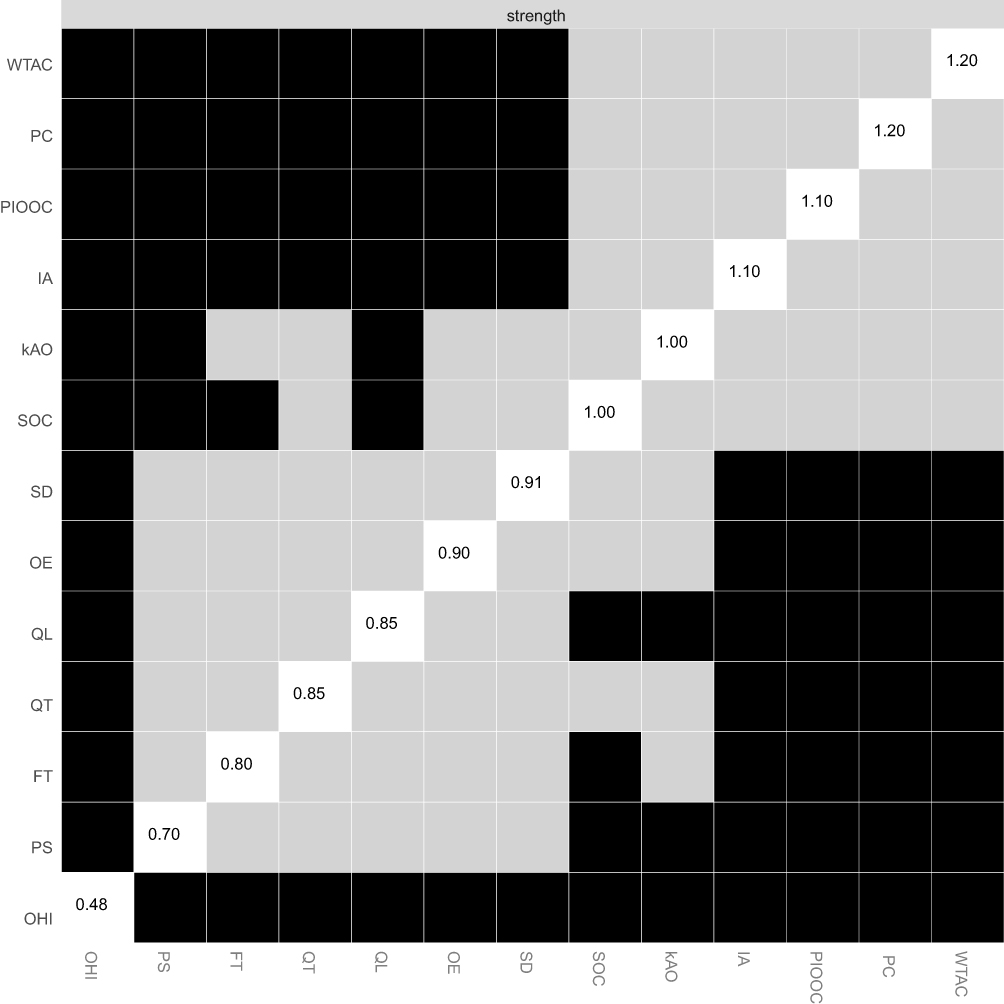 |
Figure 7 Bootstrapped difference of strength for the estimated network of intergroup contact. |
Community Analysis
Community detection revealed four clustered communities. Concurring with our assumption, different communities clustered according to quality and quantity of contact. The first community (including “contact quantity,” “perceived connection,” “sense of community,” “knowledge about out-group,” and “perceived similarity”; red community in Figure 2) includes nodes with a strong connection to contact quantity. The second community (including “quality of contact,” “intergroup attitude,” and “feeling thermometer”; green community in Figure 2) is represented by nodes with a strong connection to contact quality. The third community (including “willingness to approach contact,” “perceived intimacy of out-group contact,” “out-group empathy”; purple community in Figure 2) comprises nodes that are more highly correlated with each other. The fourth community (including “out-group helping intention,” and “social distance”; blue community in Figure 2) includes the nodes with a weak connection to nodes of other communities.
Bridge Analysis
Bridge analysis revealed that “intergroup attitude” has the highest bridge strength value, and “out-group helping intention” has the lowest bridge strength value in the network. The bridge strength between every set of two communities is presented in Table 2. The highest accumulated bridge strength is the value between the purple and blue communities. The lowest accumulated bridge strength is the value between the green and blue communities. The bridge strength between the green and purple communities is higher than that between the green and blue communities. Furthermore, the bridge strength between the red and purple communities is higher than that between the red and blue communities. A person-dropping bootstrap procedure revealed that the bridge strength values were highly stable (Figure 8).
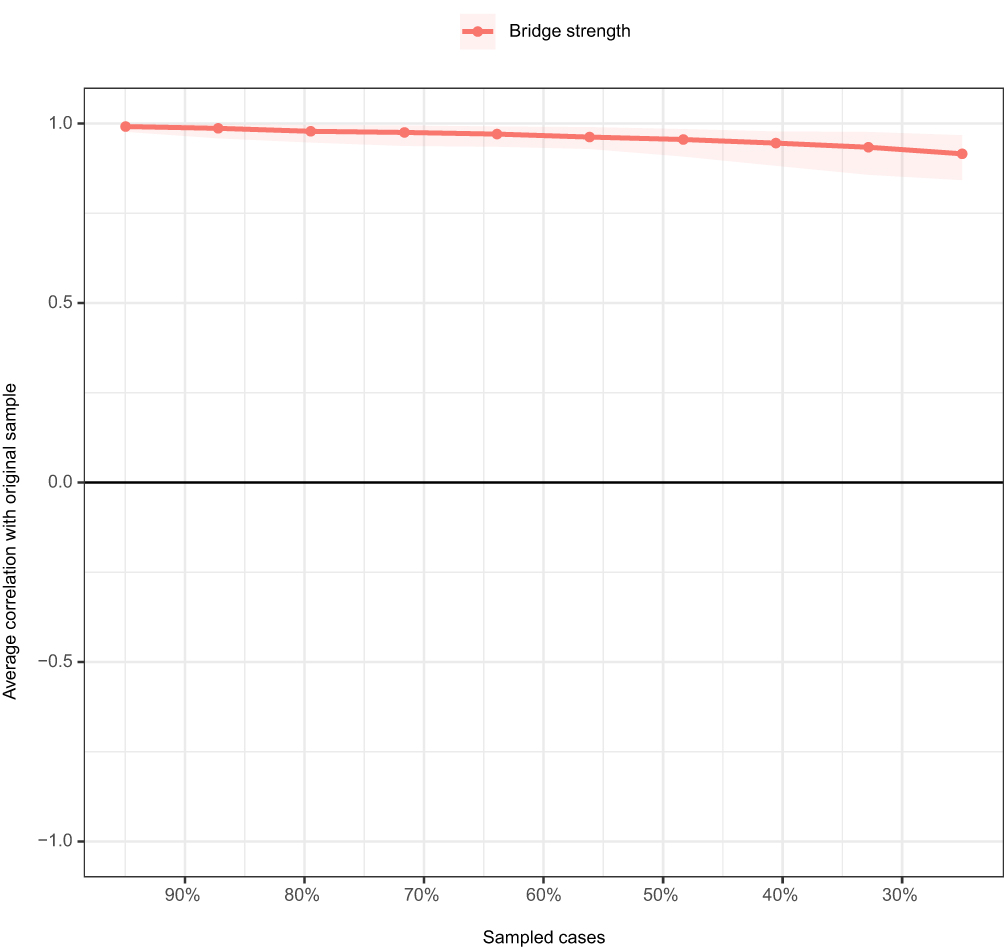 |
Figure 8 Average correlations between bridge strength of networks sampled with case dropped and the original sample. |
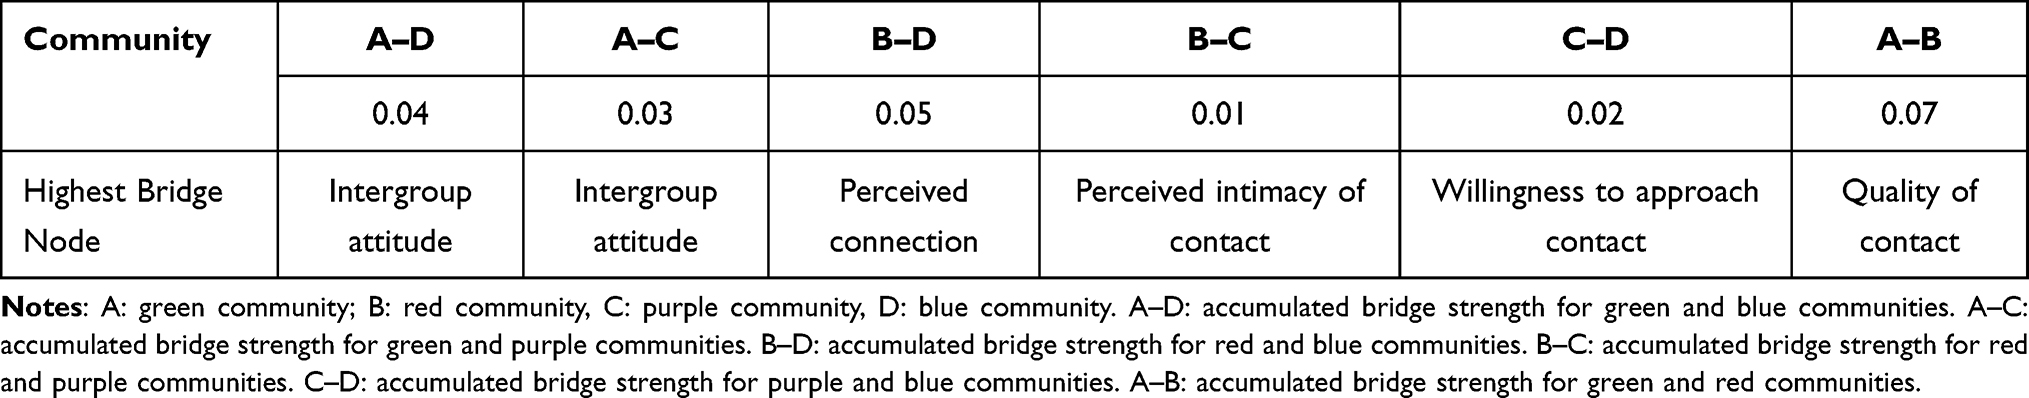 |
Table 2 Accumulated Bridge Strength for Each Community |
Network Comparison
We estimated the degree of similarity and variability of the networks across the Yao and Zhuang minority samples. A high similarity was observed across the groups’ networks, with a strong (Spearman’s) correlation between their path weights (coefficient of similarity rs = 0.83). To confirm the similarity and variability of the two groups’ networks, we performed an NCT. In the omnibus tests, they did not differ significantly from each other (p = 0.44), implying that they featured nearly the same edge weights.
Discussion
In the current analysis, we employed a network approach to examine complex structures among a broad range of variables including quantity and quality of contact and the variables that caused transformations in intergroup relationships in Chinese ethnic minority groups. Our results confirm that quantity and quality of contact construct respective communities with different variables, and the variables uninvolved these communities construct two other communities. The nodes with high centrality in the network are “perceived intimacy of out-group contact” and “perceived connection.” Moreover, “intergroup attitude” was the highest bridge node that strongly connected separate communities. The Zhuang and Yao’s global network structures of intergroup contact and the effects are highly similar. The network structure was reliably estimated, since the findings were stable even after excluding the largest cases; thus, the obtained network structure efficiently represents the “true” model underlying the data.
Our finding about the community of quality of contact and the strongest bridge node concurs with prior studies that have indicated the quality of contact significantly predicts out-group attitudes.5,16 Out-group attitudes are considered one of the most important indicators to reduce intergroup prejudice.1 Despite simultaneously considering other outcomes variables, our study revealed that out-group attitudes have the strongest association with the quality of contact. Thus, prior studies, as well as the current one, may collectively indicate the pivotal, stable role of out-group attitudes.
The result that quantity of contact constructs community with “perceived connection,” “sense of community,” “knowledge about out-group,” and “perceived similarity” means quantity and quality of contact may have their own potential proximal effects that varyingly influence some intergroup relationships. Specifically, quantity of contact has proximal effects including instant cognitive and emotional response without depth cognition, while quality of contact has proximal effects that may change deep-seated cognition and improve intergroup relations. Nonetheless, additional research is warranted to corroborate these speculations.
An interesting finding is that “out-group empathy,” “perceived intimacy of out-group,” and “willingness to approach contact” construct a community. This provides a possible explanation for a confusing problem: previous studies identified empathy as a possible important mediator of the association between intergroup contact and prejudice;1 however, sometimes, the path was not significant.3 A possible reason is that empathy strongly relates to “perceived intimacy” and “willingness to approach contact,” which may moderate that path. Further, this finding provides a roadmap for researchers who study the drivers of contact seeking and predictors of contact. That is, an intervention for intimate contact may promote people’s “out-group empathy,” which increases “willingness to approach contact” in the future. The reverse may also hold true. Nonetheless, these speculations require confirmation through future research.
“Perceived intimacy of out-group” is the central node in the network structure. Intimate intergroup interactions in prior studies have been considered the ideal form of contact for prejudice reduction by voluntarily entering into pleasant, equal cooperation.58 It is identified as a more effective form of contact to improve intergroup relationships by improving various variables such as empathy.58–60 In addition, “perceived connection” is another central node. According to self-determination theory, one of the most powerful human motives is the desire to form and maintain social connections.61 Perceived connection guides feelings, thoughts, and behaviors.61 Existing studies have found this is closely related to prosocial behavior,62 such as enabling people to be more tolerant and respectful of interpersonal differences63 and increasing trust.64 In this study, the high centrality of both “perceived intimacy of out-group” and “perceived connection” further highlight this idea, indicating that facilitating them would lead to simultaneous improvements of other variables. Thus, “perceived intimacy of out-group” and “perceived connection” ought to be the main target for intervention. Accordingly, a growing body of research has called for a deeper understanding of these.20,58
Constructing a community through “out-group helping intention“ with “social distance“ indicates they are the remote effects of the quantity and quality of contact, but there may exist a high interaction between them. Out-group helping intention may involve social distance and the costs of helping, such as the level of effort, the time needed, and the particular rewards forgone. In our study, the operationalization of helping was to assist with homework; this was predicted by intergroup contact in past studies.22 However, another study found that the costs of helping reduce children’s willingness to help ethnic out-group peers, but it did not influence their intention to help ethnic in-group peers.65 In-group meant close social distance while out-group meant distal social distance. That is, people may assess whether to offer help according to social distance and the cost of helping. Even though the measure in our study did not explicitly state the social distance and costs of helping, participants may do by their own to estimate. The relation between ”out-group helping intention” with ”social distance” may be stronger than they are with quantity and quality of out-group contact. This finding cautions us when exploring the effects of contact on helping behavior, the operationalization of help (such as level of effort, cost of money, and time) and social distance should be accounted for carefully.
The network construct is highly similar in the Zhuang and Yao minorities. A potential interpretation is that both are ethnic minorities permanently residing in Southwest China and share similar folk culture; hence, they may perceive mutual ethnic homophily.66 Furthermore, according to a previous study, classifying individuals into in-group members can strengthen similarity perception,67 and the existing studies found Chinese national identity, based on Chinese nationality, is the shared common identity among the ethnic majority and minority.68–70 Zhuang and Yao may share a common in-group identity (Chinese national identity); thus, when considering this common in-group membership, they may consider themselves similar to other ethnic groups. Of course, this needs further research to confirm.
This research has some theoretical and practical implications. Theoretically, the strong association among quality of contact, intergroup attitude, and the feeling thermometer replicated previous findings, lending support to the validity of previous results. The community of quantity of contact extends our knowledge on its effects. In the future, using intensive longitudinal designs with multiple assessments, network analyses on the temporal succession of intergroup contact could help elucidate causes and consequences of specific effects within dynamic networks of quantity and quality of contact; further, it could help clarify the effects of interventions. Practically, as typical members of 55 ethnic minorities in China, the characteristics of contact between the Zhuang and Yao help reveal interethnic minority group relations. We found evidence that perceived intimacy occupied a central position in the network, and intergroup attitude functioned as the strongest bridge node; hence, in the light of the network theory, improving these variables has the potential to promote positive relationships. An effective method is to cultivate deeper cross-ethnic friendships between members of minorities.58,59 There are 55 ethnic minorities in China, distributing across different regions of the country; China is a country covering such a vast region that many ethnic groups have no contact with each other. It is important to build cross-ethnic friendships between members of ethnic groups. Moreover, it is necessary to improve the frequency of contact to improve perceived similarity, sense of community, knowledge about out-group, and perceived connection.
Finally, future directions need to be addressed. Our study only included variables to measure the outcomes of intergroup contact in China. The predictability analysis showed that, on average, more than half of the variance in the effects of intergroup contact was unexplained. Although the influence of intergroup contact on intergroup relations is extremely multifarious,71,72 future studies need to further refine the measurement of outcome variables and discern more effects of intergroup contact, such as perceived cultural distance73 and the effects of negative contact. Furthermore, the results were based on two ethnic minorities long-dwelling in Southwest China and may vary when conducted in other groups. Thus, future studies could explore the network with different samples, such as race, religion, and homosexual groups in different countries. In addition, our study used cross-sectional data; thus, it cannot derive directionality among variables to infer causality. We should conduct a longitudinal or experimental design for direction verification in future research.31 Finally, the results are from a self-reported questionnaire that may not be correlated with actual intergroup contact; thus, our results should be carefully explained.
Conclusion
Despite the limitations, our study contributes to the literature on the effects of intergroup contact. To our knowledge, it represents a rare fully detailed investigation of the influence of contact from the perspective of both groups involved, considering various effects from cognitive, emotional, and behavioral perspectives. We highlighted several important new pieces of information about intergroup contact by means of network analyses. Specifically, we found that perceived intimacy of contact is essential to improve other effects of intergroup contact. Furthermore, some variables (ie, “perceived connection,” “sense of community,” “knowledge about out-group,” and “perceived similarity”) are strongly correlated to quantity of contact. Moreover, other variables (ie, “intergroup attitude” and the “feeling thermometer”) are strongly correlated to quality of contact. Additionally, some variables (ie, “willingness to approach contact,” “perceived intimacy of out-group contact,” and “out-group empathy”) are highly correlated with each other. Conversely, other variables (ie, “out-group helping intention” and “social distance”) correlate highly with each other but weakly to quantity and quality of intergroup contact. The results suggest that the effect of intergroup contact may not essentially differ for ethnic minorities in Southwest China. Finally, we have paved the way for future studies to further understand this phenomenon. We suggest that future research should construct a systematic measurement system for the effects of intergroup contact and identify the most important effects by targeting specific groups via network analyses when conducting interventions. Hence, we could improve the pertinence of intervention and shed further light on intergroup contact.
Abbreviations
EBIC, extended Bayes information criteria; GGM, Gaussian graphical model; NCT, Network Comparison Test.
Acknowledgments
We are thankful to everyone in our team for assisting us with the investigation and data analysis. We would also like to thank Editage for English language editing.
Author Contributions
All authors made substantial contributions to research design, acquisition of data, or analysis and interpretation of data; took part in drafting the article or revising it critically for important intellectual content; agreed to submit to the current journal; provided final approval of the version to be published; and agree to be accountable for all aspects of the work.
Funding
This research was supported by the Major Project for Key Research Institutes of Humanities and Social Science by the Ministry of Education of China (Number 16JJD190007), the basic scientific research ability improvement project for the young and middle-aged teachers in Guangxi universities (2021KY0609), and the Key Project of Guangxi Ethnic Education Research and Development Center (2020MJZD002).
Disclosure
The authors report no conflicts of interest in this work.
References
1. Pettigrew TF, Tropp LR. A meta-analytic test of intergroup contact theory. J Pers Soc Psychol. 2006;90(5):751–783. doi:10.1037/0022-3514.90.5.751
2. Wright SC, Aron A, Mclaughlinvolpe T, Ropp SA. The extended contact effect: knowledge of cross-group friendships and prejudice. J Pers Soc Psychol. 1997;73(1):73–90. doi:10.1037/0022-3514.73.1.73
3. Stathi S, Guerra R, Di Bernardo GA, Vezzali L. Spontaneous imagined contact and intergroup relations: quality matters. Eur J Soc Psychol. 2020;50(1):124–142. doi:10.1002/ejsp.2600
4. Bagci SC, Piyale ZE, Sen E, Yildirim O. Beyond shifting intergroup attitudes: intergroup contact’s association with socio-cognitive skills and group-based ideologies. J Theoret Soc Psychol. 2019;3(3):176–188. doi:10.1002/jts5.45
5. Drury L, Hutchison P, Abrams D. Direct and extended intergenerational contact and young people’s attitudes towards older adults. Brit J Soc Psychol. 2016;55(3):522–543. doi:10.1111/bjso.12146
6. Brown R, Eller A, Leeds S, Stace K. Intergroup contact and intergroup attitudes: a longitudinal study. Eur J Soc Psychol. 2007;37(4):692–703. doi:10.1002/ejsp.384
7. Zagefka H, Gonzalez R, Brown R, Lay S, Manzi J, Didier N. To know you is to love you: effects of intergroup contact and knowledge on intergroup anxiety and prejudice among indigenous Chileans. Int J Psychol. 2017;52(4):308–315. doi:10.1002/ijop.12229
8. Voci A, Hewstone M. Intergroup contact and prejudice toward immigrants in Italy: the mediational role of anxiety and the moderational role of group salience. Group Process Interg. 2003;6(1):37–54. doi:10.1177/1368430203006001011
9. Pettigrew TF, Tropp LR, Wagner U, Christ O. Recent advances in intergroup contact theory. Int J Intercult Rel. 2011;35(3):271–280. doi:10.1016/j.ijintrel.2011.03.001
10. Barabási AL. The network takeover. Nat Phys. 2012;8(1):14–16. doi:10.1038/nphys2188
11. Victor P, Gil-Berrozpe GJ, Julián L, Ana ST, Cuesta MJ. The symptom and domain structure of psychotic disorders: a network analysis approach. Schizophrenia Bull Open. 2020;1(1). doi:10.1093/schizbullopen/sgaa008
12. Allport GW. The nature of prejudice. J Negro His. 1954;52(3):20–48.
13. Pettigrew TF. Advancing intergroup contact theory: comments on the issue’s articles. J Soc Issues. 2021;77(1):258–273. doi:10.1111/josi.12423
14. Ridge RD, Montoya JA. Favorable contact during volunteer service: reducing prejudice toward Mexicans in the American Southwest. J Commun Appl Soc. 2013;23(6):466–480. doi:10.1002/casp.2144
15. Tawagi AL, Mak AS. Cultural inclusiveness contributing to international students’ intercultural attitudes: mediating role of intergroup contact variables. J Commun Appl Soc. 2015;25(4):340–354. doi:10.1002/casp.2218
16. Brankovic M, Zezelj I, Turjacanin V. How knowing others makes us more inclusive: social identity inclusiveness mediates the effects of contact on out-group acceptance. J Theoret Soc Psychol. 2020;4(3):95–106. doi:10.1002/jts5.60
17. Mcglothlin H, Killen M. Children’s perceptions of intergroup and intragroup similarity and the role of social experience. J Appl Dev Psychol. 2005;26(6):680–698. doi:10.1016/j.appdev.2005.08.008
18. Huang F, Shi K, Zhou M, Stathi S, Vezzali L. Can interethnic contact between majority (Han) and minority (Uyghur) people in China influence sense of Chinese national Community? The role of positive and negative direct, extended and vicarious intergroup contact. Int J Intercult Rel. 2020;77:125–139. doi:10.1016/j.ijintrel.2020.05.008
19. Hayward LE, Tropp LR, Hornsey MJ, Barlow FK. Toward a comprehensive understanding of intergroup contact: descriptions and mediators of positive and negative contact among majority and minority groups. Pers Soc Psychol B. 2017;43(3):347–364. doi:10.1177/0146167216685291
20. Bao Y, Zhao Y, Xiao Z, Liang F, Wang W, Li B. Fusion of ”You and Me”: cultural mixing promotes intergroup psychological compatibility. J Cross Cult Psychol. 2020;51(5):353–369. doi:10.1177/0022022120924129
21. Wang C, Huang F, Stathi S, Vezzali L. Positive and negative intergroup contact and willingness to engage in intergroup interactions among majority (Han) and minority (Uyghur) group members in China: the moderating role of social dominance orientation. Int J Intercult Rel. 2020;75:132–140. doi:10.1016/j.ijintrel.2018.09.002
22. Vezzali L, Stathi S, Crisp RJ, Capozza D. Comparing direct and imagined intergroup contact among children: effects on outgroup stereotypes and helping intentions. Int J Intercult Rel. 2015;49:46–53. doi:10.1016/j.ijintrel.2015.06.009
23. Islam MR, Hewstone M. Dimensions of contact as predictors of intergroup anxiety, perceived out-group variability and out-group attitude-an integrative model. Pers Soc Psychol B. 1993;19(6):700–710. doi:10.1177/0146167293196005
24. Aberson CL, Haag SC. Contact, perspective taking, and anxiety as predictors of stereotype endorsement, explicit attitudes, and implicit attitudes. Group Process Interg. 2007;10(2):179–201. doi:10.1177/1368430207074726
25. Tausch N, Hewstone M, Roy R. The relationships between contact, status and prejudice: an integrated threat theory analysis of Hindu-Muslim relations in India. J Community Appl Soc Psychol. 2009;19(2):83–94. doi:10.1002/casp.984
26. Méndez Fernández AB, Lombardero Posada X, Aguiar Fernández FX, Murcia Álvarez E, González Fernández A. Professional preference for mental illness: the role of contact, empathy, and stigma in Spanish social work undergraduates. Health Soc Care Community. 2021:1–12. doi:10.1111/hsc.13479
27. Johnston BM, Glasford DE. Intergroup contact and helping: how quality contact and empathy shape outgroup helping. Group Process Interg. 2018;21(8):1185–1201. doi:10.1177/1368430217711770
28. Borsboom D, Cramer A. Network analysis: an integrative approach to the structure of psychopathology. In: Nolenhoeksema S, editor. Annual Review of Clinical Psychology. Palo Alto: Annual Reviews; 2013:91–121.
29. Epskamp S. Network Psychometrics [dissertation]. Amsterdam: University of Amsterdam; 2017.
30. Robinaugh DJ, Hoekstra RHA, Toner ER, Borsboom D. The network approach to psychopathology: a review of the literature 2008–2018 and an agenda for future research. Psychol Med. 2020;50(3):353–366. doi:10.1017/S0033291719003404
31. Marcus DK, Preszler J, Zeigler-Hill V. A network of dark personality traits: What lies at the heart of darkness? J Res Pers. 2018;73:56–62. doi:10.1016/j.jrp.2017.11.003
32. Mcnally RJ. Can network analysis transform psychopathology? Behav Res Ther. 2016;86(SI):95–104. doi:10.1016/j.brat.2016.06.006
33. Yang Z, Algesheimer R, Tessone CJ. A comparative analysis of community detection algorithms on artificial networks. Sci Rep. 2016;6. doi:10.1038/srep30750.
34. Newman M, Girvan M. Finding and evaluating community structure in networks. Phys Rev E. 2004;69(22). doi:10.1103/PhysRevE.69.026113
35. Walker PM, Hewstone M. A developmental investigation of other-race contact and the own-race face effect. Brit J Dev Psychol. 2006;24(3):451–463. doi:10.1348/026151005X51239
36. Yang L, Xiuling S, Hong L, Changquan L. The own - race effect of Uygur college students in face recognition: the influence of inter - group contact experience. J Psychol Sci. 2014;37(3):683–688.
37. Ng YL, Kulik CT, Bordia P. The moderating role of intergroup contact in race composition, perceived similarity, and applicant attraction relationships. J Bus Psychol. 2016;31(3):415–431. doi:10.1007/s10869-015-9419-4
38. Ioannou M, Al Ramiah A, Hewstone M. An experimental comparison of direct and indirect intergroup contact. J Exp Soc Psychol. 2018;76:393–403. doi:10.1016/j.jesp.2017.11.010
39. Oh HJ, Ozkaya E, Larose R. How does online social networking enhance life satisfaction? The relationships among online supportive interaction, affect, perceived social support, sense of community, and life satisfaction. Comput Hum Behav. 2014;30:69–78. doi:10.1016/j.chb.2013.07.053
40. Pearce PL, Amato PR. A taxonomy of helping – a multidimensional scale analysis. Soc Psychol Q. 1980;43(4):363–371. doi:10.2307/3033956
41. Paolini S, Wright SC, Dys-Steenbergen O, Favara I. Self-expansion and intergroup contact: expectancies and motives to self-expand lead to greater interest in outgroup contact and more positive intergroup relations. J Soc Issues. 2016;72(3SI):450–471. doi:10.1111/josi.12176
42. Liu W, Pellegrini M, Wu A. Identification of bridging centrality in complex networks. IEEE Access. 2019;7:93123–93130. doi:10.1109/ACCESS.2019.2928058
43. Epskamp S, Fried EI. A tutorial on regularized partial correlation networks. Psychol Methods. 2018;23(4):617–634. doi:10.1037/met0000167
44. Jones PJ. Networktools: tools for identifying important nodes in networks (R Package Version 1.1.1.); 2018. Available from: https://cloud.r-project.org/.
45. Jones PJMR. Bridge centrality: a network approach to understanding Bridge centrality: a network approach to understanding comorbidity. Multivariate Behav Res. 2019:1–15. doi:10.1080/00273171.2019.1614898
46. Friedman J, Hastie T, Tibshirani R. Sparse inverse covariance estimation with the graphical lasso. Biostatistics. 2008;9(3):432–441. doi:10.1093/biostatistics/kxm045
47. Tibshirani RJ. Regression shrinkage and selection via the LASSO. J R Stat Soc Series B Stat Methodol. 1996;73(1):273–282. doi:10.1111/j.2517-6161.1996.tb02080.x
48. Chen J, Chen Z. Extended Bayesian information criteria for model selection with large model spaces. Biometrika. 2008;95(3):759–771. doi:10.1093/biomet/asn034
49. Foygel R, Drton M. Extended Bayesian information criteria for Gaussian graphical models. Adv Neural Inf Process Syst. 2010;1(23):2020–2028.
50. Fried EI, Eidhof MB, Palic S, et al. Replicability and generalizability of Posttraumatic Stress Disorder (PTSD) networks: a cross-cultural multisite study of PTSD symptoms in four trauma patient samples. Clin Psychol Sci. 2018;6(3):335–351. doi:10.1177/2167702617745092
51. Epskamp S, Cramer AOJ, Waldorp LJ, Schmittmann VD, Borsboom D. qgraph: network visualizations of relationships in psychometric data. J Stat Softw. 2012;48(4):1–18. doi:10.18637/jss.v048.i04
52. Huang S, Lai X, Xue Y, Zhang C, Wang Y. A network analysis of problematic smartphone use symptoms in a student sample. J Behav Addict. 2020;9(4):1032–1043. doi:10.1556/2006.2020.00098
53. Haslbeck JMB, Waldorp LJ. How well do network models predict observations? On the importance of predictability in network models. Behav Res Methods. 2018;50(2):853–861. doi:10.3758/s13428-017-0910-x
54. Reichardt J, Bornholdt S. Statistical mechanics of community detection. Phys Rev E. 2006;74(1). doi:10.1103/PhysRevE.74.016110
55. Holtge J, Theron L, van Rensburg A, Cowden RG, Govender K, Ungar M. Investigating the interrelations between systems of support in 13-to 18-year-old adolescents: a network analysis of resilience promoting systems in a high and middle-income country. Child Dev. 2021;92(2):586–599. doi:10.1111/cdev.13483
56. Borsboom D. A network theory of mental disorders. World Psychiatry. 2017;16(1):5–13. doi:10.1002/wps.20375
57. van Borkulo CDWL Comparing network structures on three aspects: a permutation test; 2016. doi:10.13140/RG.2.2.29455.38569.
58. Marinucci M, Maunder R, Sanchez K, et al. Intimate intergroup contact across the lifespan. J Soc Issues. 2021;77(1SI):64–85. doi:10.1111/josi.12399
59. Fuochi G, Voci A, Boin J, Hewstone M. Close to me: the importance of closeness versus superficiality in explaining the positive-negative contact asymmetry. Eur J Soc Psychol. 2020;50(4):766–782. doi:10.1002/ejsp.2667
60. Davies K, Tropp LR, Aron A, Pettigrew TF, Wright SC. Cross-group friendships and intergroup attitudes: a meta-analytic review. Pers Soc Psychol Rev. 2011;15(4):332–351. doi:10.1177/1088868311411103
61. Baumeister RF, Leary MR. The need to belong - desire for interpersonal attachments as a fundamental human - motivation. Psychol Bull. 1995;117(3):497–529. doi:10.1037/0033-2909.117.3.497
62. Pavey L, Greitemeyer T, Sparks P. Highlighting relatedness promotes prosocial motives and behavior. Pers Soc Psychol Bull. 2011;37(7):905–917. doi:10.1177/0146167211405994
63. Lee RM, Draper M, Lee S. Social connectedness, dysfunctional interpersonal behaviors, and psychological distress: testing a mediator model. J Couns Psychol. 2001;48(3):310–318. doi:10.1037/0022-0167.48.3.310
64. Lista JA, Price MK. The role of social connections in charitable fundraising: evidence from a natural field experiment. J Econ Behav Organ. 2009;69(2):160–169. doi:10.1016/j.jebo.2007.08.011
65. Sierksma J. Costs of helping only influence children’s intention to help ethnic out-group peers. J Exp Child Psychol. 2018;173:85–99. doi:10.1016/j.jecp.2018.03.016
66. Leszczensky L, Pink S. What drives ethnic homophily? A relational approach on how ethnic identification moderates preferences for same-ethnic friends. Am Sociol Rev. 2019;84(3):394–419. doi:10.1177/0003122419846849
67. Gaertner SL, Dovidio JF, Anastasio PA, Bachman BA, Rust MC. Reducing intergroup bias: the common ingroup identity model. Eur Rev Soc Psychol. 1993;4(1):1–26. doi:10.1080/14792779343000004
68. Guan T, Luo N, Wang L. Ethnic identity, Chinese national identity, and intergroup attitudes of adolescents from an ethnic autonomous region in China. Identity. 2021;1–15. doi:10.1080/15283488.2021.1919114
69. An XJ, Yang WY, Zhu S, Wang XZ. The relationship between ethnic identity and national identity of ethnic middle school students in southwest China: the chain mediating role of self-esteem and multi-cultural ideology: taking Chuxiong prefecture of Yunnan province as an example. J Res Educ Ethn Minorities. 2018;29(6):111–118.
70. Cheng SH, Han YC, Li X. Research on the status quo of Chinese national identity of high school students in ethnic minority areas. Theory Res. 2016;8:68–69.
71. Paluck EL, Green SA, Green DP. The contact hypothesis re-evaluated. Behav Public Policy. 2018:1–30. doi:10.1017/bpp.2018.25
72. Dovidio JF, Love A, Schellhaas FMH, Hewstone M. Reducing intergroup bias through intergroup contact: twenty years of progress and future directions. Group Process Interg. 2017;20(5):606–620. doi:10.1177/1368430217712052
73. Firat M, Ataca B. Does perceived cultural distance mediate the relationship between intergroup contact and support for refugee rights? A preliminary investigation. J Community Appl Soc Psychol. 2021. doi:10.1002/casp.2536
 © 2022 The Author(s). This work is published and licensed by Dove Medical Press Limited. The
full terms of this license are available at https://www.dovepress.com/terms
and incorporate the Creative Commons Attribution
- Non Commercial (unported, 3.0) License.
By accessing the work you hereby accept the Terms. Non-commercial uses of the work are permitted
without any further permission from Dove Medical Press Limited, provided the work is properly
attributed. For permission for commercial use of this work, please see paragraphs 4.2 and 5 of our Terms.
© 2022 The Author(s). This work is published and licensed by Dove Medical Press Limited. The
full terms of this license are available at https://www.dovepress.com/terms
and incorporate the Creative Commons Attribution
- Non Commercial (unported, 3.0) License.
By accessing the work you hereby accept the Terms. Non-commercial uses of the work are permitted
without any further permission from Dove Medical Press Limited, provided the work is properly
attributed. For permission for commercial use of this work, please see paragraphs 4.2 and 5 of our Terms.