Back to Journals » Risk Management and Healthcare Policy » Volume 15
A Multi-Objective Optimization Approach for Emergency Medical Service Facilities Location-Allocation in Rural Areas
Received 25 August 2021
Accepted for publication 12 February 2022
Published 15 March 2022 Volume 2022:15 Pages 473—490
DOI https://doi.org/10.2147/RMHP.S332215
Checked for plagiarism Yes
Review by Single anonymous peer review
Peer reviewer comments 3
Editor who approved publication: Professor Kyriakos Souliotis
Yulong Chen,1,2 Zhizhu Lai3
1Key Research Institute of Yellow River Civilization and Sustainable Development & Collaborative Innovation Center on Yellow River Civilization of Henan Province, Henan University, Kaifeng, Henan, People’s Republic of China; 2The College of Environment and Planning, Henan University, Kaifeng, Henan, People’s Republic of China; 3School of Geography and Environmental Engineering, Gannan Normal University, Ganzhou, Jiangxi, People’s Republic of China
Correspondence: Zhizhu Lai, School of Geography and Environmental Engineering, Gannan Normal University, 1 South Shida Road, Rongjiang New District, Ganzhou, Jiangxi, 341000, People’s Republic of China, Tel +86 15821120157, Email [email protected]
Purpose: The location of emergency medical service (EMS) facilities is a basic facility location problem. Many scholars have examined this kind of problem, but research on the location of EMS facilities in rural areas is still lacking. Different from urban areas, the location optimization of EMS facilities in rural areas must consider the accessibility of roads. The objective of this study conducted the optimal locations of new EMS stations and construction/upgrading of transfer links aiming to improve the medical emergency efficiency of mountain rural areas.
Methods: Three multi-objective models were constructed to examine the effects of varying assumptions (suppose existing roads cannot be upgraded, existing roads can be upgraded, and existing roads can be upgraded and new roads can be constructed) about minimizing the population considered uncovered (response time from the residential to the EMS station less than or equal to 0.5 h), time spent traveling from the residential area to the EMS station, construction costs for building new emergency facilities, and costs for improving or building new roads. Furthermore, we developed an improved multi-objective simulated annealing algorithm to examine the problem of optimizing the design of rural EMS facilities.
Results: We tested the models and algorithm on the Miao Autonomous County of Songtao, Guizhou Province, China. According to the actual situation of the case area, the models and algorithm were tested with the assumption that only three new EMS stations would be constructed. The number of people not covered by EMS stations decreased from 30.7% in Model 1 to 22% in Model 2, and then to 18.9% in Model 3.
Conclusion: Our study showed that the traffic network had a significant impact on the location optimization of EMS stations in mountainous rural areas. Improving the traffic network conditions could effectively improve the medical emergency efficiency of mountain rural areas.
Keywords: emergency medical service station, multi-objective simulated annealing algorithm, the problem of facility location design, traffic network
Introduction
Improving the level of rural medical service is one of the important tasks of the rural revitalization strategy of China. For a long time, rural areas of China are facing the problems of shortage of medical resources, insufficient medical services, and unbalanced development of urban and rural areas. Some villages are located in a mountainous Environment, and their transportation is inconvenient. Consequently, the vast rural areas cannot obtain satisfactory medical services. Emergency medical service (EMS) facilities are an important part of the health service system of China, facing the problem of insufficient sites and concentrated layout in the city. As a result, patients in remote rural areas are prone to miss the best rescue time. Medical personnel rush to the scene in the quickest possible time, and the corresponding rescue measures can significantly improve the survival rate of patients (Pons, 2005; Balakrishnan et al, 1989).1,2 Therefore, it is essential to improve the regional equilibrium allocation of EMS facilities with high accessibility. The optimization of the spatial distribution of EMS facilities has become a critical part of the healthy development of rural areas.
Related Location Models to EMS Facilities
EMS problem has been studied by scholars since the 1970s, and most of them have studied it with coverage models. Toregas3 studied how to set the minimum number of facilities to cover all demand points, that is, setting the coverage-location problem, and used linear programming to solve the problem. Church and Revelle4 first proposed the maximum-coverage-location problem. On this basis, Daskin (1983)5 and Revelle and Hogan6 used maximize redundant coverage location problem (MEXCLP) and maximum available location problem (MALP) models. Then, Daskin7 proved that the maximum-coverage problem belonged to a nondeterministic polynomial (NP)-hard problem. Cai et al8 studied the optimal layout of EMS stations and explored the attenuation relationship between the number of calls for help and distance. Lu et al9 improved the facility location model considering the difference in demand satisfaction within the coverage radius, constructed the facility point function optimization model, and used the Vogel heuristic algorithm to solve the problem. Based on the background of large-scale bioterrorism attacks, Murali et al10 proposed an opportunity-constrained facility location model to analyze the location of medical centers and distribute large quantities of drugs to the public during the disaster. The location-allocation heuristic algorithm was used to solve the model. Wang et al11 combined it with the scenario analysis method to construct a two-stage stochastic programming model. In addition, the location and resource allocation of emergency reserves in emergency-prone areas were studied using the hybrid genetic algorithm. Chen and Yu12 proposed an integer programming model for facility location considering network distance to improve the efficiency of EMS in disaster areas. In addition, Lagrange relaxation and data mining algorithms were introduced to improve the scalability of the proposed model. Then, the method was applied to a real case. The results showed that the proposed model and the algorithm were feasible. Nogueira et al13 analyzed the optimal location of an ambulance base in Belo Horizonte, Brazil, to improve the response time of the EMS system in that area. Zaffar14 optimized the location of ambulances to improve the survival rate of patients as much as possible. Boujemaa et al15 established the model to determine the location of ambulance stations, the number and type of ambulances to be deployed, and the demand areas served by each ambulance station. In the process of model construction, the robust optimization method was used to solve the problem of demand uncertainty. Fritze et al16 explored the optimization layout of EMS facilities in Austria and analyzed how to cover residential areas as much as possible when EMS facilities were few. Liu et al17 optimized the location, number, and demand allocation of ambulances to minimize the total expected cost.
Facility Location and Network Design
Network design problem (NDP) refers to selecting several potential links between network nodes to minimize the total construction cost and travel cost (Cocking, 2008; Balakrishnan et al, 1989).18,19 Facility location network design problem (FLNDP) is a combination of facility location problem and NDP (Daskin, 1993).5 It not only pays attention to the selection of facility location but also considers the optimal layout design of the traffic road network. The facility location network design method can effectively solve the optimal location problem of rural public service facilities (Melkote, 1996).20 The cost of building new facilities may be much lower than that of changing the underlying traffic, and it is assumed that the underlying network configuration is changeable. Then, Melkote (1996)20 divided the facility location design problem into three models: uncapacitated FLNDP, capacitated FLNDP, and maximum covering location network design (MCLNDP). On this basis, many scholars extended the research on FLNDP (Melkote and Daskin, 2001a; Melkote and Daskin, 2001b; Ghaderi and Jabalameli, 2013; Rahmaniani and Ghaderi, 2015; Asl et al, 2020; Liu,2020).21–26
In general, the set coverage model and the maximum coverage model are commonly used by scholars to study the location problem of EMS facilities. However, these studies cannot meet the special needs of EMS facilities located in a mountainous environment. Road traffic conditions must be considered in the location optimization of EMS facilities in mountainous rural areas. The location network design method based on the coverage model can effectively solve this problem.
On the whole, the set coverage model and the maximum coverage model are the common models for many scholars to study the location of EMS facilities. Unfortunately, these works cannot meet the special needs of optimizing the location of EMS facilities in rural areas. Most of these studies neglected the impact of traffic accessibility on the location of rural EMS stations. In addition, previous research failed to consider whether it was financially more appropriate to upgrade a road (or construct a new road) than to open new EMS stations. The financial expenditure of the government in rural areas is often minimal. Also, it is not practical to solve the problem of low efficiency of medical first aid in remote rural areas by building a large number of new EMS stations. Furthermore, EMS station location problems were not considered together with network design in any of the studies. The objective of this study was to develop and test a methodology for examining the impact of a traffic network on EMS station location to fulfill the knowledge gaps and contribute to the empirical literature. A facility location network design model was constructed to minimize the population of uncovered residential areas, the time spent from residential areas to EMS facilities, the construction costs for EMS facilities, and the construction and upgrading costs for roads.
The remainder of this manuscript is organized as follows. Problem Statement and Mathematical Formulation presents the mathematical formulation of the proposed problem. A brief description of the improved multi-objective simulated annealing (IMOSA) algorithm is given in Algorithm Design. In Empirical Study, the model is applied to the location optimization of the rural EMS stations in Songtao Miao Autonomous County of Guizhou Province, China. Finally, Conclusions summarizes our findings and concludes with future research.
Problem Statement and Mathematical Formulation
Problem Definition and Assumptions
Referring to the research of Zhao et al27 and Melkote,20 this study mainly considered three factors for the location of EMS facilities. The first was to ensure that the population of the residential area not covered was the minimum. The second was to minimize the total time spent by the patients from all the covered residential areas to reach the nearest EMS station. The third was that the cost of facility construction and road construction and upgrading was the least. Obviously, the first and second aspects were contradictory with the third. Minimizing the population of uninvolved residential areas and the medical emergency time of residents might lead to an increase in construction costs. A multi-objective maximum-coverage-facility-location network design (MCFLND) model was constructed to compare and analyze the optimal locations of EMS stations under different traffic network conditions and better analyze the impact of traffic network conditions on the layout of EMS stations in three scenarios: (1) under the condition that the existing roads could not be upgraded and new roads could not be constructed, the optimal location of EMS facilities was determined (Model 1); (2) under the condition that existing roads could be upgraded, the optimal location of EMS facilities was determined (Model 2); and (3) under the condition that existing roads could be upgraded and new roads could be constructed, the optimal location of EMS facilities was determined (Model 3).
Before building the models, it should be noted that the demand point directly seeks service from the facility node for the traditional facility location problem. For the FLNDP, the demand point may need to be transferred to other demand points so as to reach the facility point. This kind of demand point, which can play the role of transit, is called transit node. Thus, two types of nodes exist in the facility location network design model: facility nodes and demand nodes. All inbound demand is served by the facility node and will not flow out again because the facilities are incapacitated. Demand nodes can be divided into pure demand points and transit nodes. The transshipment nodes mean that the node itself must be the demand point, and all inbound demand is transshipped to be served elsewhere. Pure demand nodes only have an outflow and no inflow.
We regarded a set of towns as demand nodes existing in a geographical region and a set of roads as transfer links. The road links in the network contained existing and new potential road links. A set of EMS facilities existed in the region, and locating a set of new EMS facilities was desired to construct new road links and to improve the existing road links such that the total investment costs (including the population for not covering residential areas, first-aid time, construction costs for EMS facilities, and construction and upgrading costs for roads) were minimized. Moreover, a set of EMS facilities were situated in a mountain geographical area. The assumptions of the proposed problem were considered: (1) each node of the network represented a town or residential areas; (2) each node could be an apply center or a demand center; that is, at each residential area, an EMS facility could be opened; (3) the EMS facilities must be located at the nodes (town) of the network; (4) only one EMS facility could be located at each node (town) of a network; (5) the time spent between residential areas and EMS facilities was symmetric; (6) all network links were directed; (7) the EMS facilities and transfer roads were incapacitated; and (8) the critical coverage time of each demand center was the same.
Notations
The sets, parameters, and decision variable used in the proposed model are defined (see Table 1).
 |
Table 1 Notations of the Proposed Problem |
Model Formulation
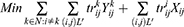
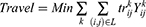
Regarding the aforementioned assumptions and notations, the three multi-objective optimization models for the reliable maximum cover EMS station location NDP could be defined. Model 1 was described as follows:

subject to:
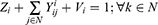

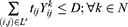


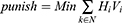
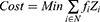
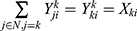
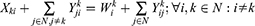
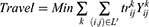
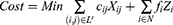
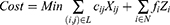
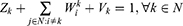
The objective formulation (1) minimized the sum of the population for not covering demands. The formulation (2) was the objective function that minimized the total time spent by the patients from all the covered residential areas to reach the nearest EMS station. The formulation (3) was the objective function that minimized the construction costs for EMS facilities. The formulations (4)-(12) were constraint conditions. Constraint (4) indicated that the residential area was covered either by its own EMS facilities or by EMS facilities located in other residential areas, or by no EMS facility. Constraint (5) ensured that for patients , the inflow of
  nodes was equal to the outflow of
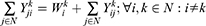
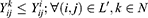
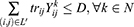
  nodes. Constraint (6) required that all patients covered by the EMS facility must be served. Constraint (7) denoted that patients
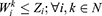
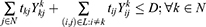
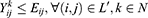
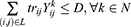
  arrived at the nearest EMS facility in less than or equal to its critical coverage time. Constraints (8) and (9) ensured that potential transfer links and EMS facilities were not used if they were not constructed. Constraint (10) guaranteed that only one-way link existed between two nodes. Constraint (11) ensured that the number of new EMS facilities was
  .
.
 in the objective function can be classified as
  and
and  to distinguish the patients in the
  residential area from the patients in other residential areas passing through the k residential area, so that the objective function (2) was equivalent to:
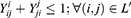
In constraint condition (5), nodes  could also be classified into
  and
and ; therefore, constraint condition (5) was equivalent to:

When  ,
,  was satisfied; therefore, equation (15) could be rewritten as follows:
Then, the link  could also be classified into
  and
and  ; therefore, equation (16) was converted into equation (17) and equation (18).


In constraint condition (7), nodes  could also be classified into
  and
and ; therefore, constraint condition (7) was equivalent to:

subject to


Compared with Model 1, the objective function of Model 2 added the costs of upgrading roads. Constraint (31) enforced the binary restriction on the link decision variable. It meant that if the transfer link from nodes  to
to  was upgraded, the value of
  was 1; otherwise, the value was 0.
subject to


Compared with Model 2, the objective function of Model 3 added the costs of new roads.  indicated the set of existing and new candidate transfer links in the network. Constraint (45) enforced the binary restriction on the link decision variable. It meant that if the transfer link from nodes
  to
to  was upgraded or constructed, the value of
  was 1; otherwise, the value was 0.
Algorithm Design
The MCFLND problem belongs to a multi-objective optimization problem. It is not difficult to find that the minimization of travel cost and population of uncovered demand is at the cost of increasing the cost of facility construction, road upgrading, or road construction. Therefore, the three objective functions cannot achieve the optimal at the same time, and hence some tradeoffs are required. Melkote20 proved that MCLNDP was an NP-hard problem. Thus, the multi-objective facility location network design model constructed in this study was an extension of MCLNDP and belonged to the NP-hard problem. In this study, the multi-objective optimization method was used to solve the multi-objective FLNDP. The main difference between the multi-objective optimization problem and the single-objective optimization problem is that the solution of multi-objective optimization is not unique but is a set of optimal solutions. The elements in the set are called Pareto optimal solution or non-inferior solution (Chankong, 1983).28 Nondominated sorting genetic algorithm (NSGA) and NSGA-II (a fast and elitist multi-objective genetic algorithm) based on NSGA are commonly used to solve multi-objective problems. Both of them are based on genetic algorithms. The genetic algorithm has the advantage of evaluating multiple solutions in the search space at the same time and has good global search performance. It is easy to parallelize and has high search efficiency. Simulated annealing (SA) is a local search-based heuristic (Kirkpatrick et al 1983).29 This method is effective for solving highly complex combinatorial problems (Laarhoven, 1988).30 However, the search efficiency of the SA algorithm is limited compared with the population evolution of the genetic algorithm. Therefore, we used the IMOSA algorithm to solve the multi-objective models (Chen et al, 2021).31 The IMOSA algorithm absorbed the idea of group search, mutation, and crossover of the genetic algorithm, and was combined with a fast nondominated sorting approach.
The main steps of the IMOSA algorithm were as follows: (1) randomly initialize the population, in which each individual represented a solution (location of new EMS station, plan for road upgrading, and new construction). (2) The construction cost of a EMS station, the cost of road upgrading, and the time spent by patients from the residential area to the emergency center were calculated. (3) In the process of seeking medical services, patients had to go to the nearest EMS station. If the shortest time spent by patients were less than or equal to the critical coverage time of the facility, the residential area would be covered. Otherwise, no EMS station could cover the residential area. Then, the sum of the population for all the residential areas that were not covered could be calculated. (4) The Pareto solution set (population of uncovered demand, time cost of patients to go to the emergency center, facilities, and road construction cost) was generated by the fast nondominated sorting method. (5) In the process of gradual cooling, all individuals in the current population were randomly paired to achieve crossover (single-point crossover) and mutation operation. According to the Metropolis criterion, new individuals were determined, and the Pareto solution set was updated. (6) The aforementioned process was repeated until the current temperature reached the lowest temperature, and the final Pareto solution set was output.
Solution Representation
The solution obtained by the IMOSA algorithm was represented by an array. The elements of this array consisted of the location number of new EMS facilities and number 0 or 1. Furthermore, 1 indicated the upgrading of low quality and medium quality roads or constructing potential roads; 0 indicated no upgrading or construction of roads. The location number of new EMS facilities, roads to upgrade (low- and medium-quality roads), and potential roads were arranged in the front, middle, and back of the array, respectively. For example, the road network consisted of three new EMS facilities, five roads to upgrade, and five potential roads. The solution could be expressed as an array containing 13 elements (Figure 1). The first three elements of this array indicated that the three new EMS facilities were located at the nodes numbered 5, 7, and 15. Elements 4–8 of the array indicated upgrading the third low or intermediate road, and elements 9–13 indicated building new roads 2, 4, and 5.
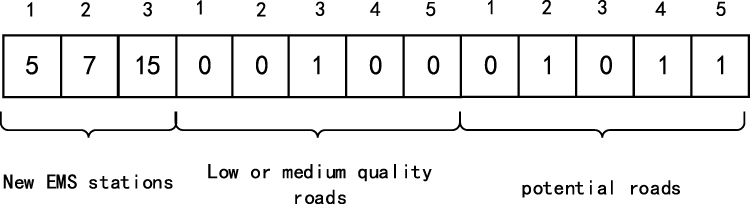 |
Figure 1 A solution representation. |
Initial Solution Generation
The generation of the initial population of solutions in this study was random. We used the initial population as the basic solution set. Because the solution obtained by the IMOSA algorithm was also represented by an array, the array was randomly generated according to the constraints of the number of new EMS facilities. All solutions in the basic solution set were classified based on their dominance relation. Therefore, each solution belonged to a specific Pareto front. Finally, the first Pareto front was chosen as the initial archive.
Recombination Operation
The purpose of the recombination operation was to assemble a new offspring from a given parent’s solution. Generally, a single-point crossover was used to generate new solutions. Figure 2 shows the example of a single-point crossover.
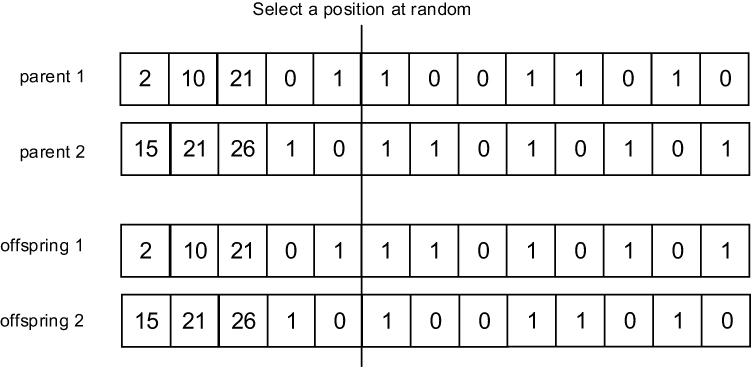 |
Figure 2 An example of single point crossover. |
Neighborhood Generation
The neighborhood generation is the process of generating new solution and it is one of the main factors that affect the performance of improved IMOSA algorithm. Figure 3 shows the example of neighborhood generation.
 |
Figure 3 An example of neighborhood generation. |
Acceptance Strategy
After generating each new solution, a decision was required whether the solution would be accepted in the next iteration. This decision was made by calculating the minimum value of the difference between the objective function of the new solutions and the parent solution. For example, two parent solutions and
and 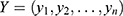 generate two new solutions X' = (x'1,x'2,…,x'n) and Y' = (y'1,y'1,…,y'n). The travel cost (objective function 1) and construction cost (objective function 2) corresponding to the parent solutions
  (new solution
  ) are expressed by
  and
and  (
( and
and ), respectively. The
  and
and  value can then be calculated using Equation (48) and Equation (49), respectively. Then, the new solution is judged whether it is accepted or not according to the Metropolis rule. Likewise, this procedure can be used to determine whether the new solution
  is accepted.


Empirical Study
Data Collection and Parameter Setting
Songtao Miao Autonomous County in Guizhou Province was selected as a case study to test the feasibility and effectiveness of the proposed model and algorithm. The study area was faced with the problems of inconvenient traffic conditions, long response time of medical emergencies, and insufficient stations of EMS stations, which led to the limited coverage of emergency facilities. Optimizing the spatial layout of the EMS station in the study area was urgent. The basic data of the research area used in this study mainly included road network layer (high, medium, and low), residential area layer, existing EMS station spatial layout layer, and administrative division layer. The area had 34 existing and 6 potential roads, as shown in Figure 4. The six potential roads were designed according to the actual topography of the study area in Google Earth. In this case, the study area had 28 townships (nodes) with a total population of 6988.51 million and an area of 3409 km2.
 |
Figure 4 Map of the study area with population center and the road network. |
Using the ArcGIS software platform, the existing and potential roads were sorted into the same road layer. The attributes of each road segment in the layer included road length and travel time. It was assumed that the first-aid speed of low, medium, and high quality roads was 20, 40, and 60 km/h, respectively. Based on this, the topological relationship of the road network was constructed, and then the network data set was created. The network data set was used to calculate the shortest network distance (unit: km) and the shortest travel time cost for each residential area. Travel time was the travel cost of patients. It should be pointed out that the potential road must be a high-quality road. It was assumed that the cost of road construction and upgrading was in direct proportion to the road distance. Then, the construction cost of a new road and the cost of upgrading low and medium quality roads to high quality roads were calculated as 160,000 times, 80,000 times, and 48,000 times of road distance between two townships, respectively. In addition, the critical value of facility coverage was 0.5 h, that is, the longest time from the residential area to the adjacent EMS station was 0.5 h. According to the population of each residential area, the construction cost of an EMS station in each residential area could be divided into five levels, as shown in Table 2.
 |
Table 2 Construction Cost of EMS Stations in Each Residential Area |
Calculation Results
Calculation Results of Model 1
The Pareto optimal solution set of Model 1 was obtained when the number of new construction facilities was set to 1, 2, and 3. Each solution in the solution set represented an optimal location scheme. After the Pareto optimal solution set was obtained, the decision-maker could choose the final decision scheme in the solution set according to his preference. We only analyzed the situation of three new EMS stations, as shown in Appendix Table A1. Appendix Table A1 shows that the decision-making scheme numbers for the three new EMS stations were #24 to #38. The distribution of Pareto optimal solutions of the three new EMS stations in the three-dimensional coordinate system to facilitate further decision-making and judgment is shown in Figure 5. It was not difficult to find that the population of uncovered demand decreased with the increase in the facility construction cost. The reduction in population for uncovered demand was at the cost of increasing the facility construction cost. According to the actual situation of the research area, the decision-makers should ensure that the residents were covered as much as possible and the travel cost from the residential area to the facilities was as small as possible; the financial expenditure of local government departments should also be considered. Therefore, the decision-maker needed to choose one of the Pareto optimal solutions as the final compromise solution. As shown in Figure 5, schemes #29, #30, and #31 could be selected as the compromise decision schemes. Here, we chose scheme #29 as the final decision scheme of the compromise solution. Due to space limitations, we only analyzed the situation of scheme #29 as the final decision-making option.
 |
Figure 5 The distribution of the Pareto optimal solution of Model 1 in the three-dimensional coordinate system ( |

In scheme #29, the new EMS stations were located at 5, 15, and 20. The population of the uncovered demand node (the first objective function value) was 214,253, and the construction cost of EMS stations was 2.1 million. The spatial locations of the new EMS stations are shown in Figure 6. After the construction of three new EMS stations, 10 residential areas, including 1, 2, 3, 4, 7, 9, 10, 16, 27, and 28, were not covered by the EMS stations, that is, the time for residents of these seven residential areas to go to the emergency center exceeded the critical value of 0.5 h coverage. The number of residents not covered accounted for 30.7% of the total population in the study area. Eleven residential areas, including 5, 6, 8, 11, 12, 13, 14, 15, 17, 18, 19, 20, 21, 22, 23, 24, 25, and 26, could be covered by EMS stations. The time from 11 residential areas to the EMS station was less than 15 min. In addition, it took 15–30 min for residents in seven residential areas to get to the EMS stations.
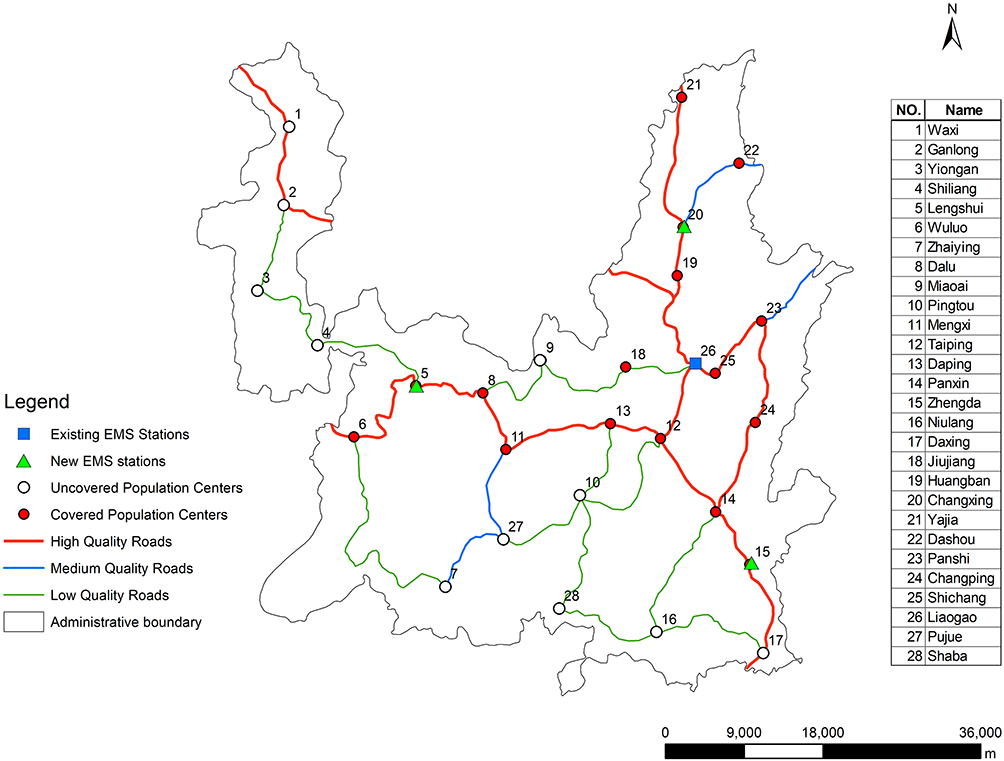 |
Figure 6 The optimal solutions in model 1. |
Calculation Results of Model 2
Appendix Table A2 shows the Pareto optimal solution set of Model 2 when the number of new EMS stations was set to 1, 2, and 3. Each solution in the table represents an optimal location scheme. After the Pareto optimal solution set was calculated, the decision-maker could choose the final decision scheme according to his preference. The Pareto optimal solutions of the three new EMS stations were displayed through the three-dimensional coordinate system, as shown in Figure 7. Schemes #54 and #55 ensured that the construction cost of EMS stations was low, but more residential areas were not covered by EMS stations. Schemes #36 and #37 ensured that few residential areas were not covered by the EMS stations, but the cost of facility construction was higher. The decision-maker needed to choose one of the Pareto optimal solutions as the final compromise solution. According to Figure 7, schemes #41, #42, #43, and #44 could be selected as the compromise decision schemes. Due to space limitations, we only analyzed the situation of scheme #44 as the final decision-making option.
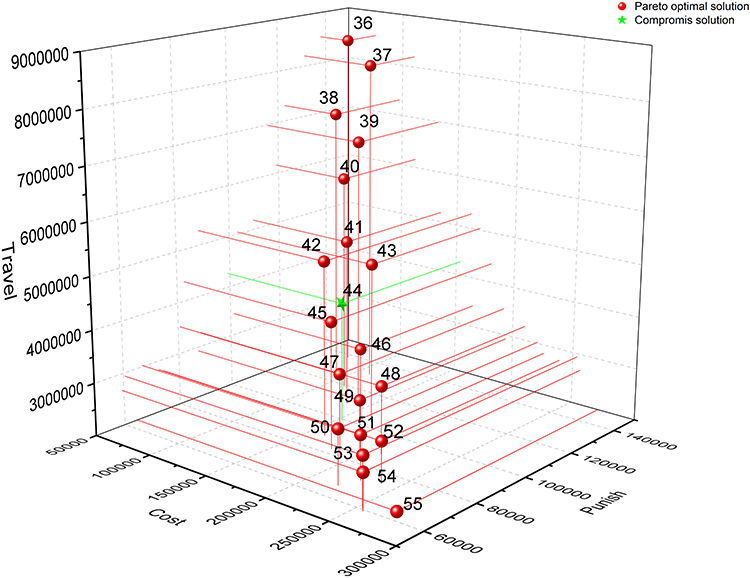 |
Figure 7 The distribution of the Pareto optimal solution of Model 2 in the three-dimensional coordinate system ( |

In scheme #44, the new EMS stations were located at 2, 5, and 15. The population of the uncovered demand node (the first objective function value of Model 2) was 153,589, and the total cost of construction of EMS stations and road upgrading was 4,274,360. The road upgrade and the spatial location of the new EMS stations in Model 2 are shown in Figure 8. After constructing three new EMS stations, seven residential areas, including 4, 7, 9, 10, 16, 21, and 28, were not covered by the EMS stations. The number of residents not covered accounted for 22% of the total population in the study area. The time from seven residential areas to the EMS stations was less than 15 min. In addition, it took 15–30 min for residents in seven residential areas to get to the EMS stations.
 |
Figure 8 The optimal solutions in Model 2. |
Calculation Results of Model 3
Appendix Table A3 shows the Pareto optimal solution set of Model 3 when the number of new emergency medical stations was set to 1, 2, and 3. Each solution in the table represents an optimal location scheme. After the Pareto optimal solution set was calculated, the decision-maker could choose the final decision scheme according to his preference. The Pareto optimal solutions of the three new EMS stations were displayed through the three-dimensional coordinate system, as shown in Figure 9. Schemes #46 and #47 could be selected as the compromise decision schemes. Due to space limitations, we only analyzed the situation of scheme #46 as the final decision-making option for Model 3.
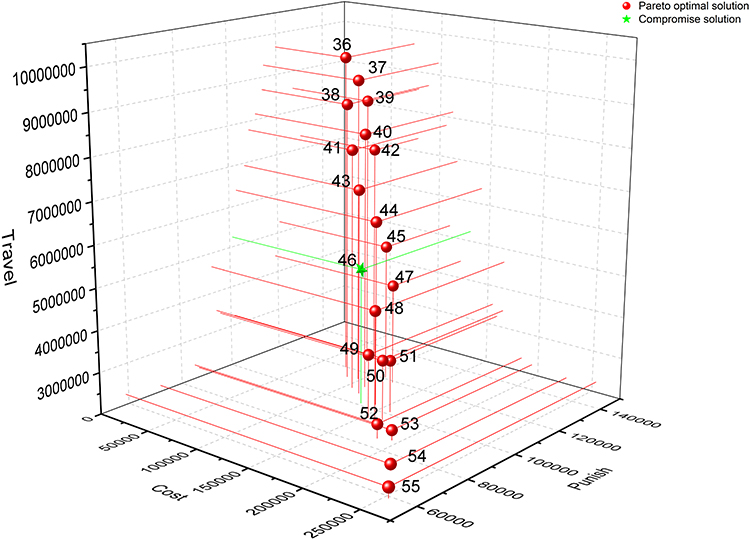 |
Figure 9 The distribution of the Pareto optimal solution of Model 3 in the three-dimensional coordinate system ( |

In scheme #46, the new EMS stations were located at 2, 11, and 14. The population of the uncovered demand node (the first objective function value of Model 2) was 131,857, and the total cost of EMS station construction, road upgrading, and new construction was 5,245,560. The road upgrading and the spatial location of the new EMS stations in Model 3 are shown in Figure 10. After constructing three new EMS stations, seven residential areas, including 3, 4, 6, 9, 16, 21, and 28, were not covered by the EMS stations. The number of residents not covered accounted for 18.9% of the total population in the study area. The time from 16 residential areas to the EMS stations was less than 15 min. In addition, it took 15–30 min for residents in five residential areas to get to the EMS stations.
 |
Figure 10 The optimal solutions in Model 1. |
Result Analysis
We divided the first-aid time of population centers calculated using Model 1, Model 2, and Model 3 into four grades (0–0.25 h, 0.25–0.375 h, 0.375–0.5 h, and >0.5 h) to further compare and analyze the calculated results of the three models (Figure 11). The results of Model 1 calculation are shown in Figure 11A. Figure 11A shows that ten uncovered population centers had a population of 214,253, accounting for 30.7% of the total population in the county. Most of the residential areas not covered by EMS stations were distributed in remote areas with low road grades and small populations. The results of the Model 2 calculation are shown in Figure 11B. The figure shows that seven uncovered population centers had a population of 153,589, accounting for 22% of the total population in the county. Compared with the results of Model 1, the number of residents not covered was reduced. The results of the Model 3 calculation are shown in Figure 11C. The figure shows that seven uncovered population centers had a population of 131,857, accounting for 18.9% of the total population in the county. Compared with the results of Model 2, the number of residents not covered reduced. Overall, compared with the results of Model 1, the number of residential areas not covered in the result of Model 2 and the first-aid time of some residential patients were significantly reduced, while the efficiency of medical first aid significantly improved. Compared with the calculation results of Model 2, the emergency efficiency of Model 3 further improved and the total number of population centers not covered slightly decreased. Therefore, the improvement in traffic conditions effectively improved the efficiency of medical first aid for rural residents.
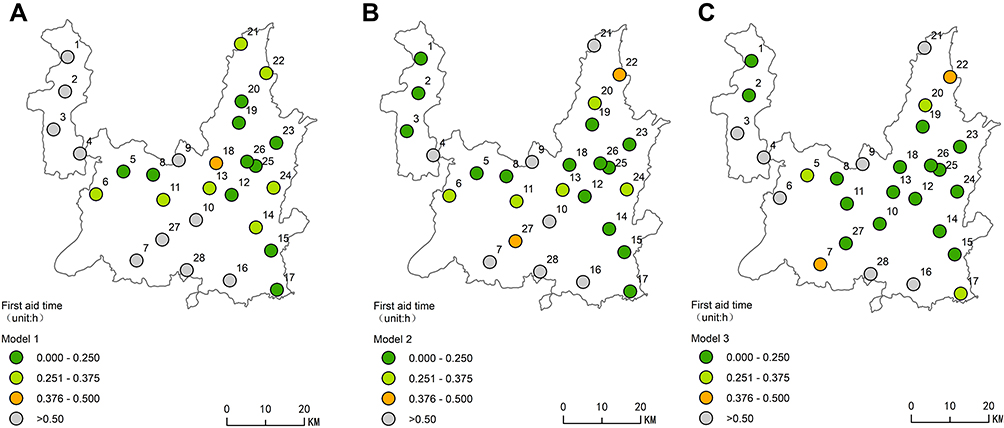 |
Figure 11 Spatial distribution of first aid time calculated by the Model 1 (A), Model 2 (B) and Model 3 (C). |
Conclusions
Scientifically planning the location of EMS facilities is an important way to improve the efficiency of first aid, especially for rural areas. Therefore, the objective of this study was to minimize the population of the residential area not covered, the time spent from residential areas to EMS station, construction costs for new EMS stations, and construction and upgrading costs for roads on a traffic network. A multi-objective model and IMOSA algorithm for the location optimization of rural EMS stations based on traffic networks was explored. The proposed model determined the optimal locations of new EMS stations in rural areas, optimal construction/upgrading of transfer links, and optimal allocation of patients to EMS stations. A practical case study was presented in detail to illustrate the application of the proposed mathematical model, and the accessibility of EMS stations in the rural areas of China was explored. The results showed that the resident coverage of EMS stations decreased from 30.7% in Model 1 to 22% in Model 2, and then to 18.9% in Model 3. Therefore, the proposed models could effectively solve the planning problems in rural EMS stations. The traffic network had a significant influence on optimizing the locations of the rural EMS station. Improvement in traffic conditions effectively improved the efficiency of medical first aid for rural residents.
Nevertheless, models building in this study was based on some assumptions and could not be completely consistent with the real world. Firstly, it was assumed that the cost of road construction and upgrading is in direct proportion to the road distance. In the real world, many factors affect the cost of road construction, such as terrain, altitude, etc. This will lead to deviation in the calculation of road construction cost, which will affect the result of road network optimization. In the future research, this deficiency can be overcome by obtaining accurate unit construction cost of the road through field investigation. Secondly, this study assumed that EMS facilities have no service capacity constraints. However, in the real world, the service capacity of EMS facilities (number of beds and medical staff, etc.) will limit the number of patients they can receive. This will cause some EMS facilities to receive too many patients beyond their service capacity limit (although this may rarely occur). Therefore, future research also should consider capacity constraints of EMS facilities to make the number of patients received by each EMS facility within their service capacity. Thirdly, this study assumed that the parameters such as demand and construction cost will not change with time, which is inconsistent with reality. The change of demand or construction cost will affect the optimization results of EMS facilities location. It is necessary to consider the impact of demand changes and construction cost changes on the location of EMS facilities in future research. Therefore, making this study closer to the real world is an important direction of future research. In addition, new algorithms need to be developed and tested to guide complex public health emergency decisions such as the optimal way to design an emergency medical system in different geographic settings. These are further research directions for this study.
Acknowledgment
We would like to thank all paticipants in this sudy for their time and cooperation.
Funding
This work was supported by the Key Scientigic Research Projects of Colledges and University in Henan Province (Grant no. 21A170006), Scientific Research Fundation for PhD of GNNU (Grand no. BSJJ202116), Humanities and Social Sciences Research Project of the Ministry of Eduction (Grant no. 20YJ790017).
Disclosure
The authors report no conflicts of interest in this work.
References
1. Pons PT, Haukoos JS, Bludworth W, et al. Paramedic response time: does it affect patient survival? Acad Emerg Med. 2005;12(7):594–600. doi:10.1197/j.aem.2005.02.013
2. Zhou L, Wang S, Xu Z. A multi-factor spatial optimization approach for emergency medical facilities in Beijing. Int J Geoinf. 2020;9(6):361. doi:10.3390/ijgi9060361
3. Toregas C, Swain R, Revelle C, Bergman L. The location of emergency service facilities. Oper Res. 1971;19(6):1363–1373. doi:10.1287/opre.19.6.1363
4. Church RL, Revelle C. The maximal covering location problem. Pap Reg Sci Assoc. 1974;32(1):101–118. doi:10.1007/BF01942293
5. Daskin MS. A maximum expected location model: formulation, properties and heuristic solution. Transport Sci. 1983;17(7):48–70. doi:10.1287/trsc.17.1.48
6. Revelle C, Hogan K. The maximum availability location problem. Transport Sci. 1989;23(3):192–200. doi:10.1287/trsc.23.3.192
7. Daskin MS. Network and Discrete Location: Models, Algorithms, and Applications. Wiley Inter science: New York; 1995.
8. Cai D, Teng L. FLP Analysis of the 120 EMS stations in urban-rural integrated area—A case study of Heshan city, Guangdong Province. Hum Geogr. 2009;01:63–66.
9. Lu XL, Hou YX, Lin W, et al. Functional optimization of emergency medical service center of small town based on facility Shandong province. Econ Geogr. 2011;31(7):1119–1123.
10. Murali P, Dessouky F, Dessouky MM. Facility location under demand uncertainty: response to a large-scale bio-terror attack. Socio-Econ Plan Sci. 2012;46(1):78–87. doi:10.1016/j.seps.2011.09.001
11. Wang HJ, Liu C, Wang J. Stochastic optimization models for emergency supplies location and allocation. Chin J Manag. 2013;10(10):1507–1519.
12. Chen AY, Yu TY. Network based temporary facility location for the emergency medical services considering the disaster induced demand and the transportation infrastructure in disaster response. Transport Res Part B Methodol. 2016;91:408–423. doi:10.1016/j.trb.2016.06.004
13. Nogueira LC, Pinto LR, Silva PMS. Reducing emergency medical service response time via the reallocation of ambulance bases. Health Care Manag Sci. 2016;19(1):31–42. doi:10.1007/s10729-014-9280-4
14. Zaffar MA, Rajagopalan HK, Saydam C, et al. Coverage, survivability or response time: a comparative study of performance statistics used in ambulance location models via simulation–optimization. Oper Res Health Care. 2016;11:1–12. doi:10.1016/j.orhc.2016.08.001
15. Boujemaa R, Jebali A, Hammami S, et al. A stochastic approach for designing two-tiered emergency medical service systems. Flex Serv Manuf. 2018;30(1–2):123–152. doi:10.1007/s10696-017-9286-6
16. Fritze R, Graser A, Sinnl M. Combining spatial information and optimization for locating emergency medical service stations: a case study for Lower Austria. Int J Med Inform. 2018;111:24–36. doi:10.1016/j.ijmedinf.2017.12.008
17. Liu K, Li Q, Zhang ZH. Distributionally robust optimization of an emergency medical service station location and sizing problem with joint chance constraints. Transport Res Part B. 2019;119:79–101. doi:10.1016/j.trb.2018.11.012
18. Cocking C. Solutions to facility location-network design problems. Germany: University of Heidelberg; 2008.
19. Balakrishnan A, Magnanti TL, Wong RT. A dual-ascent procedure for large-scale un-capacitated network design. Oper Res. 1989;37(5):716–740. doi:10.1287/opre.37.5.716
20. Melkote S. Integrated models of facility location and network design, Industrial Engineering and Management Science [Doctor of Philosophy]. Evaston, Illinois: Northwestern University; 1996.
21. Melkote S, Daskin MS. An integrated model of facility location and transportation network design. Transport Res Part A. 2001a;35:515–538.
22. Melkote S, Daskin MS. Capacitated facility location-network design. Eur Oper Res. 2001b;129(3):481–495. doi:10.1016/S0377-2217(99)00464-6
23. Ghaderi A, Jabalameli MS. Modeling the budget-constrained dynamic uncapacitated facility location-network design problem and solving it via two efficient heuristics: a case study of health care. Math Comput Model. 2013;57(3–4):382–400. doi:10.1016/j.mcm.2012.06.017
24. Rahmaniani R, Ghaderi A. An algorithm with exploration mechanisms: experimental results to capacitated facility location/network design problem. Expert Syst Appl. 2015;42(7):3790–3800. doi:10.1016/j.eswa.2014.12.051
25. Asl A, Zarandi M, Sotudian S, et al. A fuzzy capacitated facility location-network design model: a hybrid firefly and invasive weed optimization (FIWO) solution. Iran J Fuzzy Syst. 2020;17(2):79–95.
26. Liu X, Kwon C. Exact robust solutions for the combined facility location and network design problem in hazardous materials transportation. IISE Trans. 2020;52:1156–1172.
27. Zhao M, Chen W, Ma J, et al. Optimizing temporary rescue facility locations for large-scale urban. J Environ Inform. 2017;29(1):61–73.
28. Chankong V, Haimes YY. Multi-Objective Decision Making Theory and Methodology. New York, North-Holland: Courier Dover Publications; 1983.
29. Kirkpatrick S, Gelat CD, Vecchi MP. Optimization by simulated annealing. Science. 1983;220(4598):671–680. doi:10.1126/science.220.4598.671
30. Laarhoven PJ. Theoretical and computational aspects of simulated annealing. CWI Tracts. 1988;51:1–168.
31. Chen Y, Lai Z, Wang Z, et al. Optimizing locations of waste transfer stations in rural areas. PLoS One. 2021;16:e0250962.
 © 2022 The Author(s). This work is published and licensed by Dove Medical Press Limited. The
full terms of this license are available at https://www.dovepress.com/terms
and incorporate the Creative Commons Attribution
- Non Commercial (unported, 3.0) License.
By accessing the work you hereby accept the Terms. Non-commercial uses of the work are permitted
without any further permission from Dove Medical Press Limited, provided the work is properly
attributed. For permission for commercial use of this work, please see paragraphs 4.2 and 5 of our Terms.
© 2022 The Author(s). This work is published and licensed by Dove Medical Press Limited. The
full terms of this license are available at https://www.dovepress.com/terms
and incorporate the Creative Commons Attribution
- Non Commercial (unported, 3.0) License.
By accessing the work you hereby accept the Terms. Non-commercial uses of the work are permitted
without any further permission from Dove Medical Press Limited, provided the work is properly
attributed. For permission for commercial use of this work, please see paragraphs 4.2 and 5 of our Terms.