Back to Journals » International Journal of Nanomedicine » Volume 12
A green single-step procedure to synthesize Ag-containing nanocomposite coatings with low cytotoxicity and efficient antibacterial properties
Authors Ma K, Gong L ![]() , Cai X, Huang P, Cai J, Huang D, Jiang T
, Cai X, Huang P, Cai J, Huang D, Jiang T
Received 21 December 2016
Accepted for publication 3 April 2017
Published 12 May 2017 Volume 2017:12 Pages 3665—3679
DOI https://doi.org/10.2147/IJN.S130857
Checked for plagiarism Yes
Review by Single anonymous peer review
Peer reviewer comments 2
Editor who approved publication: Dr Linlin Sun
Kena Ma,1,2,* Lingling Gong,1,* Xinjie Cai,1,2 Pin Huang,1 Jing Cai,1 Dan Huang,1 Tao Jiang1,2
1The State Key Laboratory Breeding Base of Basic Science of Stomatology (Hubei-MOST) and Key Laboratory of Oral Biomedicine Ministry of Education, School & Hospital of Stomatology, 2Department of Prosthodontics, Hospital of Stomatology, Wuhan University, Wuhan, People’s Republic of China
*These authors contributed equally to this work
Abstract: Implant-associated infections still pose a serious threat leading to several complications. This study reported an environmentally benign Ag-containing nanocomposite coating with efficient antibacterial property fabricated on the metal implant via electrophoretic deposition (EPD). In such coatings, Ag2O/AgCl mixed with chitosan/gelatin (CS/G) polymers work together to exert the antibacterial property which could act as an alternative to traditional Ag nanoparticles. Scanning electron microscopy images showed the shuttle fiber-like morphology distributed lamellarly and some nanoparticles carved uniformly into the cross section. Transmission electron microscopy results revealed a core–shell-like structure of the released nanoparticles in experimental groups. The Ag-containing coatings exhibited strong antibacterial properties against Staphylococcus aureus strains and Escherichia coli strains. Meanwhile, the CCK-8 tests showed that after assembling with chitosan and gelatin polymers, the cytotoxicity of Ag was largely decreased. In addition, such coatings also exhibited strong bond strength with metal substrates and good degradable properties. Therefore, such Ag-containing CS/G coatings fabricated via EPD may be a promising candidate to be administrated in controlling the implant-associated infections.
Keywords: infection, green chemistry, chitosan, gelatin, EPD
Introduction
The incidence of implant-associated infections is increasing with the growing prevalence of titanium implants in orthopedic and dental surgery.1 Infections cause patient suffering, financial burden, and even fatalities. An infection may result from incomplete preoperation disinfection procedures, the use of nonstandard protocols during surgery, or the transfer of bacteria from infected, adjacent tissues and hematogenous sources to the implant surface after surgery. Infection rates are higher in surgeries using percutaneous and transmucosal implants. The biofilm that forms after bacteria have adhered to the implant surface shields the bacteria from the host defense system. Furthermore, because local defense systems are compromised by surgical trauma early in the recovery period, preventing the initial adhesion of bacteria during this period is crucial to preventing implant-associated infections.2
Local delivery of antibiotics and other antibacterial agents has been proposed to replace the traditional practice of systemic delivery. Local delivery maximizes the in situ drug effect, avoids potential systemic toxicity, and saves time and money.3 Furthermore, the emergence of several drug-resistant pathogens has led researchers to explore novel antibacterial agents. Recent studies reported the application of Ag nanoparticle (AgNP)-loaded materials to reduce bacterial and fungal infections related to metallic implants due to their broad-spectrum antimicrobial, antiviral,4 and antifungal5 activities. AgNPs showed the effectiveness in killing prokaryotic microorganisms, including antibiotic-resistant bacteria.6,7 Moreover, AgNPs can inhibit biofilm formation.8 These nanoparticles interrupt primary bacterial functions upon contact,9 but the exact mechanism of this effect remains controversial.10 In vitro studies have demonstrated that AgNPs are toxic to mammalian cells originating from the liver, skin, brain, lungs, and vascular system,11–13 and they can induce genes related to cell cycle progression, DNA damage, and apoptosis.14,15 An in vivo study reported that AgNPs provoke morphological malformations, retard development, and reduce pigmentation in the early life stages of Japanese medaka.16 In addition to the biological toxicity, loose nanoparticles produced in the fabrication process have been recognized as a potential environmental hazard.17 Therefore, the use of AgNPs has been controlled in many countries.18–20
Several studies have proposed the use of “green” chemistry to mitigate these concerns.19,21 Our previous studies have shown that chitosan/gelatin (CS/G) coatings fabricated on the metal substrates could be functionalized with specific agents, such as tetracycline,22 Mg ions,23 and Sr ions.24 In addition to using environmental-friendly chitosan and gelatin as polymers, other green methods (eg, using water as a solvent, conducting the procedure at an ambient temperature and pressure, and avoiding the usage of auxiliaries or derivatives) have been adopted to design polymer mix (CS/G)-based coatings with Ag-containing nanocomposites as alternatives to traditional antimicrobial AgNPs. Recent studies have demonstrated that AgNPs will be oxidized to form a soluble Ag2O surface layer when exposed to oxygen, which is the key for the antibacterial properties of Ag ions.25 Aerobic conditions lead to the oxidation and release of Ag ions.26 The released Ag ions play a significant role in antibacterial activity.27,28 We hypothesized that CS/G coatings on metallic implants fabricated via electrophoretic deposition (EPD) could be embedded with different amounts of Ag2O.27,29 These Ag-containing nanocomposite coatings could provide rapid initial-release profiles after intervention, followed by continuous slow-release profiles, to protect the implant sites from bacteria.
A better understanding of the interactions of antimicrobial nanoparticles with target microbes would help to enhance the antimicrobial efficiency of Ag ions. The interaction between nanoparticles and the intended target is complex. Although the size of nanoparticle and bacterial species influences the potency of AgNPs, the most significant factor in the antimicrobial activity is the AgNP surface charge. Cationic AgNPs are electrostatically attracted to the cell walls of negatively charged bacterial cells, and the localized concentration of released Ag ions is markedly improved by the attraction. The interaction of Ag ions with thiol groups of vital enzymes and proteins affects cellular respiration and the transport of ions across membranes ultimately resulting in cell death. In this study, a cationic polyelectrolyte (chitosan) was selected to transport Ag toward the metallic cathode through EPD to enhance the adhesion of Ag2O/AgCl-containing nanoparticles to the cell membranes of targeted bacteria.30 Under a power supply, Ag ions are reduced to Ag metal at the cathode, and the Ag metal is oxidized to Ag2O nanoparticles when exposed to air. Additionally, AgCl as byproduct is generated when Ag nitrate solution is added to an EPD solution. AgCl is known to contribute to antibacterial activity to some degree,14,27 and chitosan is biocompatible in vitro and in vivo. Our previous study showed that such properties and the bond strength of the CS coatings could be enhanced by the addition of gelatin.31,32 The results herein demonstrate that this type of Ag-containing coating fabricated on a metal substrate via green chemistry could be efficient in killing bacteria while showing relatively low cytotoxicity toward MC3T3-E1 cells compared with Ag ions.
Materials and methods
Materials
Chitosan (molecular weight 1,000,000 Da, humidity 7.86%, ash content 0.80%, deacetylation degree greater than 95%) was supplied by Golden-Shell Biochemical Co., Ltd (Zhejiang, People’s Republic of China). Gelatin (type A) derived from acid-cured tissue (G1890; Sigma-Aldrich, St Louis, MO, USA) was used as received. Commercial pure titanium (grade 2) was supplied by Baoji Titanium Industry Co., Ltd (Shaanxi, People’s Republic of China). Loctite 454 instant gel adhesive was purchased from Henkel Loctite Corp (Loctite, Düsseldorf, Germany). The MC3T3-E1 cell line (American Type Culture Collection [ATCC] catalog CRL-2594), Staphylococcus aureus (ATCC catalog 25923), and Escherichia coli (ATCC catalog 8739) were obtained from the American Type Culture Collection. All other chemical reagents were local products of analytical grade.
Preparation of the electrophoretic solutions
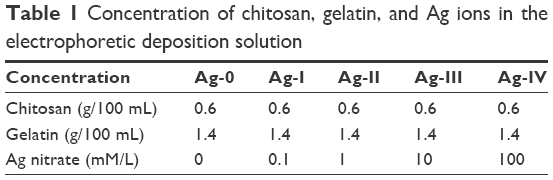
The CS/G solution was prepared as described in our previous study.31 Briefly, 1.2 g of chitosan and 2.8 g of gelatin were dissolved in 150 mL of HCl solution (0.04 M) with magnetic stirring at 60 rpm for 2 h. The pH was adjusted to 4.0 using 0.1 M NaOH, and the total volume was brought to 200 mL with Milli-Q water. An aqueous Ag nitrate solution was obtained by dissolving Ag nitrate powder in Milli-Q water and mixing with the CS/G solution with magnetic stirring for 30 min. The final concentration of Ag nitrate in each group is shown in Table 1.
 | Table 1 Concentration of chitosan, gelatin, and Ag ions in the electrophoretic deposition solution |
Preparation of the titanium substrates and EPD process
Titanium substrates were treated as described in our previous article.31 Briefly, the titanium substrates were coarse grit-blasted with 0.25–0.50 mm corundum grit at 5 bar for 1 min and were then acid-etched in hydrochloric acid/sulfuric acid (1:1) at 65°C for 30 min. Then, the substrates were ultrasonically cleaned with acetone, ethanol, and Milli-Q water for 15 min before rinsing with Milli-Q water. During the EPD process, the titanium substrates were used as the cathode, and a parallel platinum plate served as the anode. The distance between the cathode and the anode was 50 mm. EPD was performed by connecting the cathode and the anode to a direct current power supply (Model 6614C; Agilent Technologies, Santa Clara, CA, USA) at 7–8 V. Each titanium substrate was deposited for 4 min. After deposition, the electrodes were disconnected from the power supply, removed from the solution, and air-dried overnight.
Physicochemical characterization of the deposited coatings
Photos of the coatings
Optical photographs of the coatings were taken immediately after fabrication and drying in air for 1 day.
Fluorescence images
Fluorescence images were captured by a fluorescence microscope (Nikon TE-2000) using the autofluorescence of chitosan.
Field emission-scanning electron microscopy (FE-SEM)
FE-SEM (Zeiss, Oberkochen, Germany) was used to analyze the surface structure of the coatings, which were sputter-coated with gold. A Quanta 200 microscope (FEI, Hillsboro, OR, USA) was used for qualitative elemental analyses by energy-dispersive X-ray spectrometry (EDS).
Attenuated total reflection Fourier-transform infrared spectroscopy (ATR-FTIR)
ATR-FTIR (Thermo Nicolet 5700; Thermo Fisher Scientific, Waltham, MA, USA) was used to analyze the surface chemistry.
X-ray diffraction (XRD)
The crystalline state of the coating material was analyzed with an X-ray diffractometer (D8 Advance; Bruker AXS Inc., Madison, WI, USA) at 30 kV and 30 mA using Cu KD radiation. The diffraction angle ranged from 3° to 50° (at a rate of 1° [2θ] per min with a step size of 0.1° [2θ]).
X-ray photoelectron spectroscopy (XPS) and X-ray Auger electron spectroscopy (XAES)
The chemical states of Ag in the coatings were determined by XPS (Kratos XSAM 800; Kratos Analytical, Manchester, UK) and XAES (Kratos XSAM 800; Kratos Analytical, Manchester, UK).
Mechanical properties
The shear and tensile bond strengths were tested to investigate the adhesion force between the coating and the titanium substrate. The coatings were adhered to stainless steels studs (10 mm in diameter, 1 mm thick) with instant gel adhesive to ensure complete contact. The samples were vertically placed at the crosshead of an Instron Model 4465 load frame (Instron Corporation, Norwood, MA, USA). The long axis of the test samples coincided with the direction of the applied force. The pull force was maintained at a constant crosshead displacement of 0.50 mm per min until failure. Three samples per group were used for statistical analysis.
Degradation study
Coating degradation was examined in sterilized phosphate-buffered saline (PBS), which was refreshed every day (pH 7.4). After incubating for 30 min, 1, 3, 5, 7, and 12 h, and 1, 3, 7, 14, and 28 days, the coated titanium substrates were removed, thoroughly rinsed with deionized water, and vacuum-dried for 3 days at room temperature. The dry weight of each titanium disk and coated disk was measured at the start of the experiment (W1 and W2, respectively) and at the sampling time point (W3). The degree of degradation of a coating in vitro was calculated as the percentage mass loss (D):
|

The dried coatings were analyzed using ATR-FTIR to determine the surface chemical changes at each time point.
Transmission electron microscopy (TEM)
To identify the morphology of Ag compounds released from the coatings, the samples were examined by TEM (JEOL JEM 2100; JEOL, Ltd., Tokyo, Japan). The EPD coatings were immersed in Milli-Q water for 24 h, and the release liquid was diluted five times with Milli-Q water.
Ag-release studies
The concentration of Ag released in PBS was monitored by inductively coupled plasma-atomic emission spectrometry (ICP-AES) (IRIS Intrepid II XSP; Thermo Fisher Scientific). The samples were soaked in 5 mL of PBS for 30 min, 1, 3, 5, 7, and 12 h, and 1, 3, and 7 days. Then, a 1 mL aliquot of sustained-release suspension was replaced with fresh PBS at specific time points. The removed aliquot was treated with hydrogen nitrate and analyzed by ICP-AES.
In vitro antibacterial activity
To determine the antibacterial activity of the deposited coatings, three-level bacteria-killing tests were performed: total-killing capability, contact-killing capability, and release-killing capability. To measure the total-killing capability, bacteria and titanium substrates were cocultured in media for 18 h, and liquid samples were diluted 10-fold and re-cultured on agar plates in accordance with the bacteria-counting method. To measure the contact-killing capability, bacteria and titanium substrates were cocultured in media for 18 h, and samples were removed and washed with PBS three times. Then, the samples were immersed in 1 mL of PBS, and the bacteria were ultrasonically detached from the coating surfaces. The collected bacterial suspension was serially diluted and plate-counted. The samples were observed by SEM after fixation with 2% glutaraldehyde. To measure the release-killing capability, the leach liquid was obtained after the coated titanium disks were immersed in culture medium for 24 h, and the liquid was cocultured with E. coli and S. aureus separately at 37°C for 18 h. The collected liquid was serially diluted in 10-fold steps, and 100 μL of the diluted bacterial suspension was cultured on agar plates for 18 h. All three tests were quantified using the plate-counting method, and the antibacterial ratio (%) was calculated as follows:
|

where X is the average number of bacteria on the CS/G plate (colony forming units [CFU]/sample), and Y is the average number of bacteria on the four other plates (CFU/sample).
The bacterial suspension of three-level bacterial-killing test was stained with SYTO 9 and propidium iodide (PI) dyes (LIVE/DEAD BacLight Bacterial Viability Kits; Molecular Probes, Thermo Fisher Scientific) for 15 min in darkness, and examined by a fluorescence microscope (Nikon TE-2000).
MC3T3-E1 cell culture
The MC3T3-E1 cell line was maintained in alpha minimal essential medium supplemented with 10% fetal bovine serum (Hyclone, Logan, UT, USA) at 37°C. The cell count and cell viability were determined using a Beckman Coulter automatic cell counter (VI-cell analyzer; Beckman Coulter, Inc., Brea, CA, USA). All disks were steam-sterilized and placed in 24-well tissue culture plates under aseptic conditions. Complete medium was added to the 24-well plates. Then, the cells were seeded at a density of 2×10⁴ cells cm−2 and were incubated in 1 mL of soaking suspension at 37°C in a humidified atmosphere (5% CO2, 95% air) with media replacement every 3 days.
Cytotoxicity of the deposited coatings
The cytotoxicity of the deposited coatings was determined using a CCK-8 kit. After culturing the MC3T3-E1 cells for 4 h and 1, 4, and 7 days, the culture medium was replaced with 400 μL of 10% CCK-8 solution. The samples were continually cultured for 1 h, and the absorbance of the solutions was read at 450 nm.
The cytotoxicity of samples was also compared with that of the pure Ag ions. All disks were steam-sterilized and placed in 24-well tissue culture plates under aseptic conditions. Complete medium was added to the 24-well plates and cultured at 37°C for 24 h. Ag ions with the corresponding 24 h cumulative release concentration were added to the complete medium and cultured at 37°C for 24 h. Then, the cells were seeded at a density of 2×10⁴ cells cm−2 and were incubated in soaking suspension at 37°C in a humidified atmosphere (5% CO2, 95% air). The cytotoxicity was determined using a CCK-8 kit. After culturing the MC3T3-E1 cells for 1 day, the culture medium was replaced with 400 μL of 10% CCK-8 solution. The samples were continually cultured for 1 h, and the absorbance of the solutions was read at 450 nm.
Statistical analysis
Statistical analyses were performed using SPSS 16.0 (SPSS, Chicago, IL, USA). The results were analyzed using one-way analysis of variance with post hoc Tukey test. P<0.05 was considered statistically significant.
Results
Physicochemical characterization of the substrates
Photographs of the coatings
The hydrogel coatings were uniformly deposited on the substrate after EPD (Figure 1). Porous coating structures were observed, except for Ag-IV (Figure 1E). The color of the coatings varied with increasing amounts of Ag in the EPD solution.
 | Figure 1 The optical photographs of fresh (A1–E1) and dry (A2–E2) CS/G and Ag-containing nanocomposite coatings. |
Fluorescence images
Figure 2A–E shows the fluorescence images of the deposited coatings with different amounts of Ag. Blue fluorescence was observed in Figure 2A–E due to the autofluorescence of chitosan. The images showed the microporous structure of the coatings, and the number of pores decreased with the increasing amount of Ag in the coatings. The pore size ranged from 50 to 200 nm. The dried coating had brown-colored surfaces, and the blue fluorescence disappeared in the Ag-IV group.
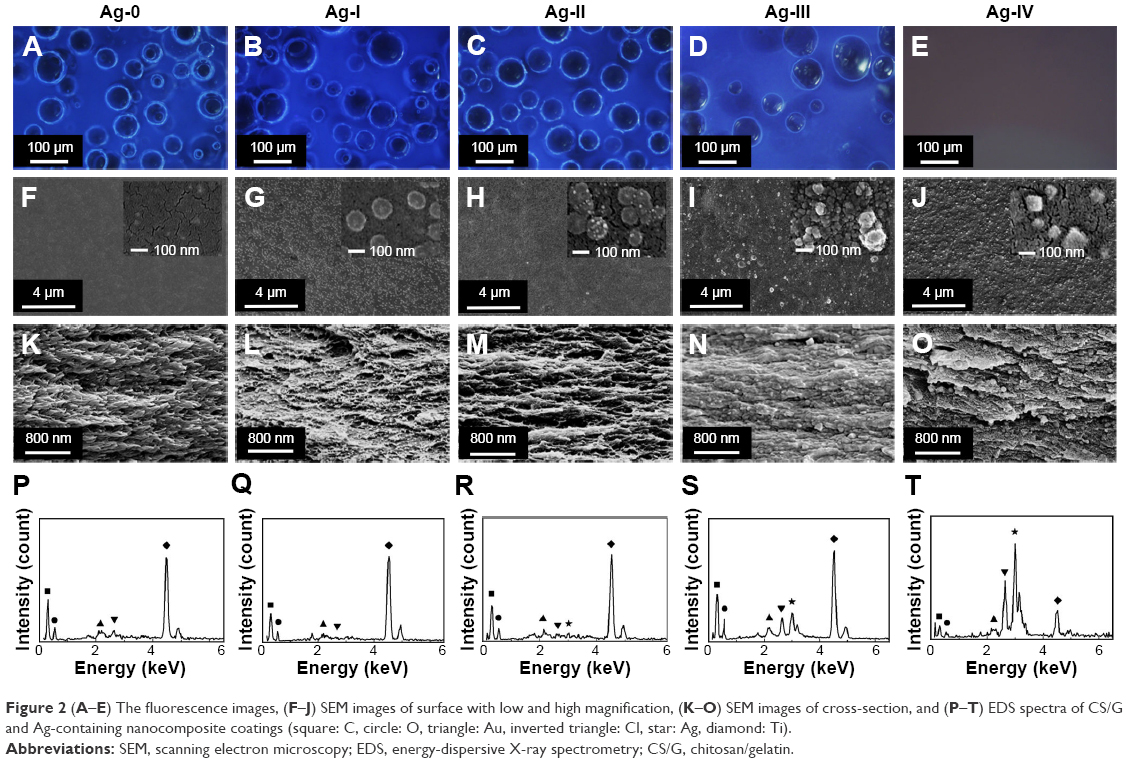 | Figure 2 (A–E) The fluorescence images, (F–J) SEM images of surface with low and high magnification, (K–O) SEM images of cross-section, and (P–T) EDS spectra of CS/G and Ag-containing nanocomposite coatings (square: C, circle: O, triangle: Au, inverted triangle: Cl, star: Ag, diamond: Ti). |
FE-SEM
Figure 2F–J shows the surface SEM images of different samples. Under low magnification, the CS/G coatings presented a smooth surface morphology. Nanoparticles appeared and were uniformly distributed in the background with the addition of Ag. High-magnification SEM images showed that the nanoparticles ranged in diameters from 10 to 100 nm. The surfaces of the particles became brighter and coarser with increasing amounts of Ag. Figure 2K–O shows the SEM images of the cross-sections of different samples. These images revealed the lamellar-distributed, shuttle fiber-like morphology. As more Ag was added, the density of the uniformly distributed nanoparticles increased.
EDS
The EDS analysis results in Figure 2P–T show the presence of Ag in all coating groups except the Ag-I group. A higher concentration of Ag nitrate in the EPD solution resulted in a relatively higher proportion of Ag in the corresponding coating.
ATR-FTIR
ATR-FTIR spectra are shown in Figure 3A. The CS/G coatings exhibited strong adsorption peaks at 1,031, 1,080, and 1,151 cm−1, which are characteristic chitosan peaks caused by C–N stretching, C–O stretching, and O–H bending, respectively, and at 1,548 and 1,633 cm−1, which are characteristic gelatin peaks due to amide I–CONH stretching and amide II–NH2 stretching, respectively. The addition of Ag caused no obvious differences in the CS/G and Ag-containing coating spectra.
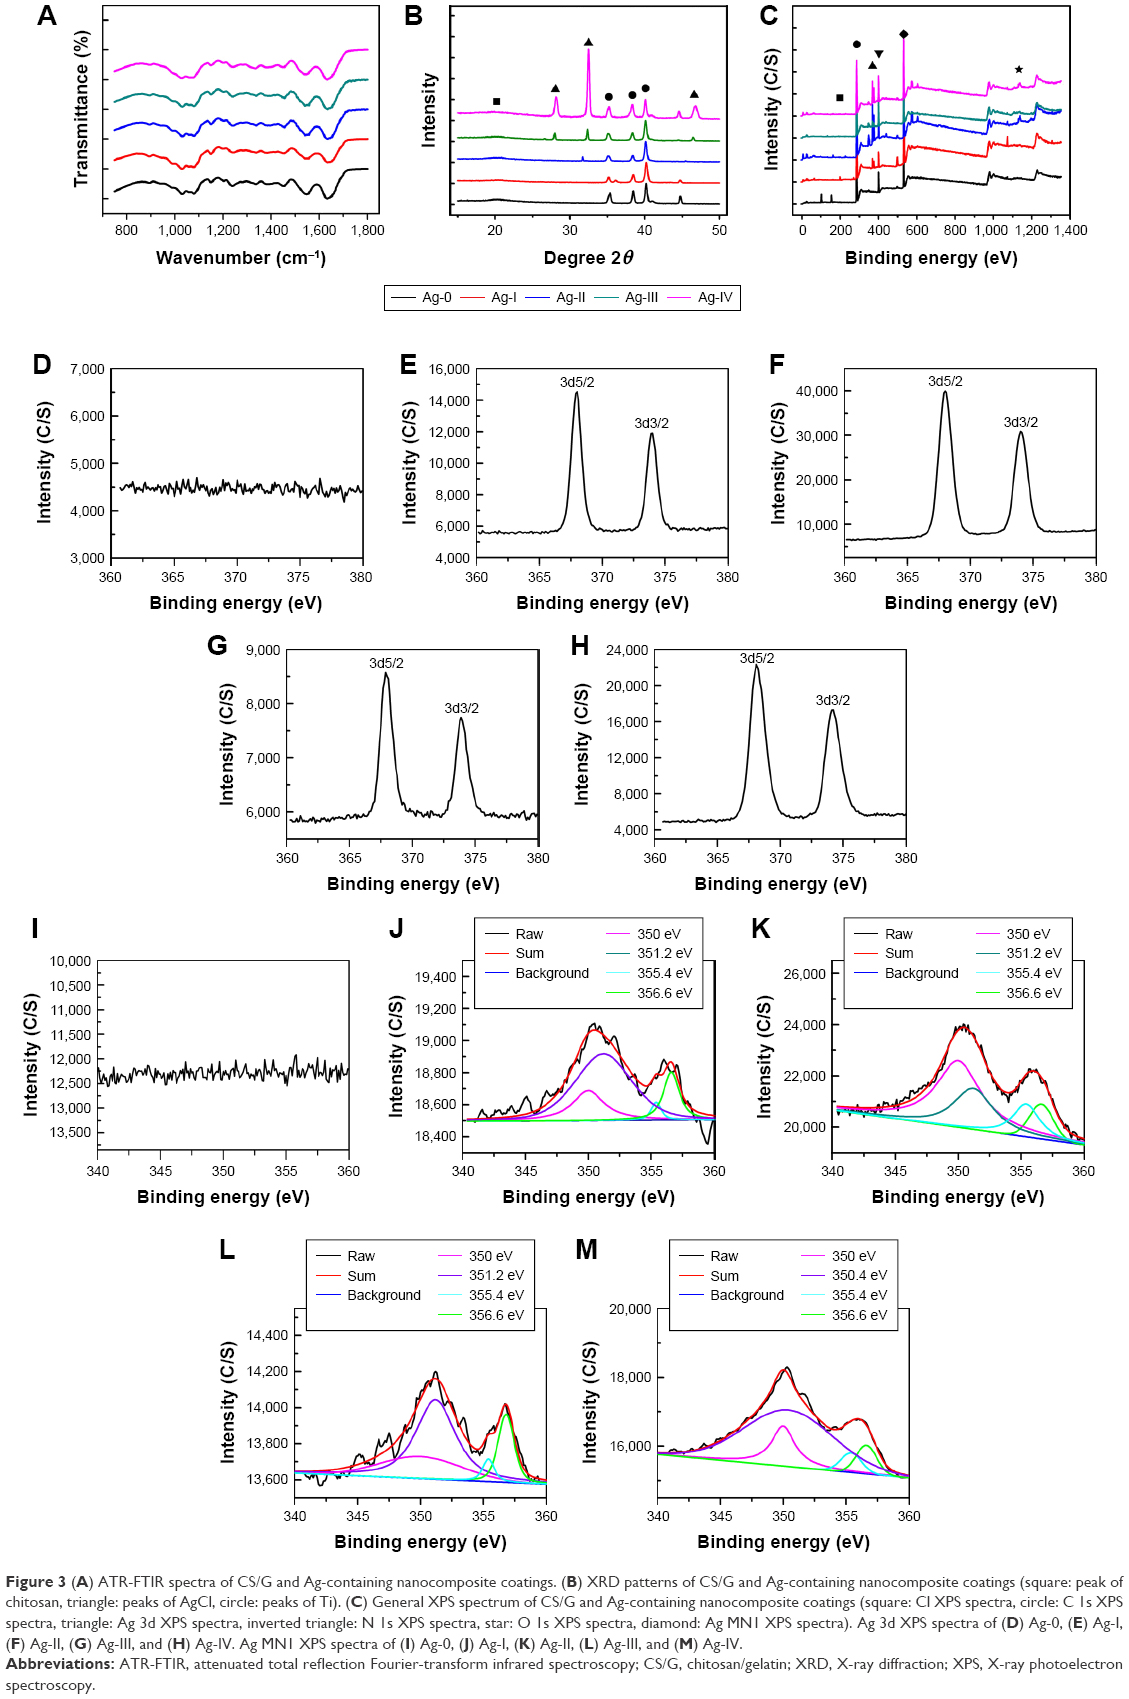 | Figure 3 (A) ATR-FTIR spectra of CS/G and Ag-containing nanocomposite coatings. (B) XRD patterns of CS/G and Ag-containing nanocomposite coatings (square: peak of chitosan, triangle: peaks of AgCl, circle: peaks of Ti). (C) General XPS spectrum of CS/G and Ag-containing nanocomposite coatings (square: Cl XPS spectra, circle: C 1s XPS spectra, triangle: Ag 3d XPS spectra, inverted triangle: N 1s XPS spectra, star: O 1s XPS spectra, diamond: Ag MN1 XPS spectra). Ag 3d XPS spectra of (D) Ag-0, (E) Ag-I, (F) Ag-II, (G) Ag-III, and (H) Ag-IV. Ag MN1 XPS spectra of (I) Ag-0, (J) Ag-I, (K) Ag-II, (L) Ag-III, and (M) Ag-IV. |
XRD
The XRD spectra (Figure 3B) exhibited a broad peak at 20° for all samples due to the semi-crystalline nature of chitosan. The addition of Ag nitrate to the EPD solutions produced a new crystalline phase in Ag-III and Ag-IV that matched that of Ag chloride.
XPS and XAES
The samples were further investigated using XPS (Figure 3D–H). Figure 3C shows a survey scan ranging from 0 to 1,400 eV. Elemental Ag was observed in all sample groups except for the control group. Figure 3D–H shows the detailed XPS region of Ag 3d at a depth of 10 nm. No Ag 3d XPS region was observed for Ag-0. In the other test groups, Ag 3d doublets were observed at 374 (Ag 3d3/2) and 368 eV (Ag 3d5/2). Because it is difficult to determine the chemical composition based solely on XPS,33 the use of the Auger parameter (AP) to identify Ag chemical states is typically considered more reliable than finding the absolute (corrected) binding energy of Ag 3d5/2. The “Ag-3d5/2 M5N45N45” and “Ag-3d5/2 M4N45N45” APs of Ag in its oxidized form are shown in Figure 3I–M, and the values were 351.2 and 356.6 eV for Ag2O33,34 and 350 and 355.4 eV for AgCl, respectively.33 A slight shift to a lower kinetic energy for Ag-3d5/2 M5N45N45 was observed in Ag-IV.
TEM
TEM imaging (Figure 4A–E) revealed that nanoparticles were released from the different coatings into Milli-Q water. For the Ag-0 coating, the released nanoparticles comprised chitosan and gelatin. The addition of Ag nitrate to the EPD solution increased the diameter of the nanoparticles. The released nanoparticles were encapsulated with a low-contrast layer and presented a core–shell-like structure.
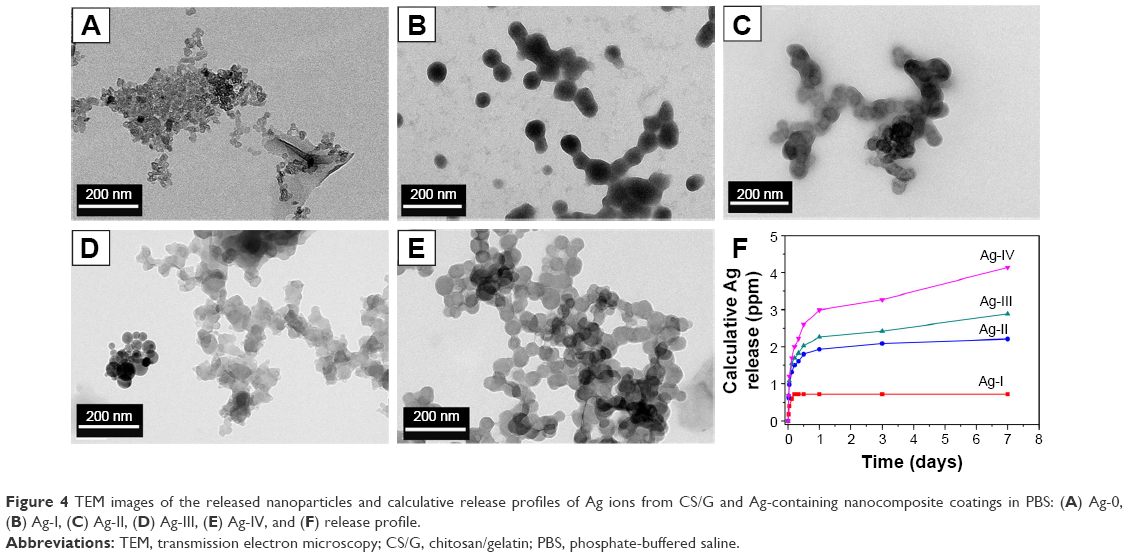 | Figure 4 TEM images of the released nanoparticles and calculative release profiles of Ag ions from CS/G and Ag-containing nanocomposite coatings in PBS: (A) Ag-0, (B) Ag-I, (C) Ag-II, (D) Ag-III, (E) Ag-IV, and (F) release profile. |
Ag release study
Figure 4F shows the Ag-release profiles of the samples in PBS under sterile conditions. For each Ag-containing group, there was an initial burst release of Ag ions followed by a reduced release rate. There was no major change for the Ag-I group after 12 h, but the other three Ag-containing groups showed sustainable release profiles during the observation period. A statistically significant difference in the amount of released Ag was found between Ag-0 group and Ag-IV group after 24 h.
Mechanical properties
The shear (Figure 5A) and tensile (Figure 5B) bond strengths were tested by stripping the coatings from the titanium substrate. All coatings were detached from the titanium substrate by applying sufficient force. Bond failures occurred at the coating–titanium interface rather than the coating–gel adhesive interface. The mean shear bond strengths of Ag-0, Ag-I, Ag-II, Ag-III, and Ag-IV were 1.87, 2.60, 4.2, 3.5, and 0.30 MPa, respectively, and the mean tensile bond strengths were 0.81, 0.41, 0.73, 0.89, and 0.28 MPa, respectively. There were no significant differences between Ag-0 and the other Ag-containing groups, which indicated that the addition of Ag to the coatings did not change the mechanical properties.
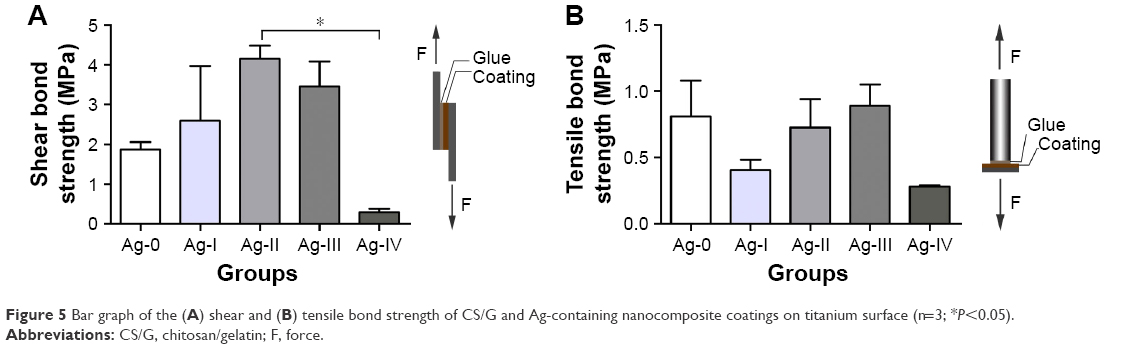 | Figure 5 Bar graph of the (A) shear and (B) tensile bond strength of CS/G and Ag-containing nanocomposite coatings on titanium surface (n=3; *P<0.05). |
Degradation study
The degradation rates of the coatings are shown in Figure 6A–E. The weights decreased sharply on the first day. The weight loss rate decreased as the amount of Ag in the coating increased. At the end of the first day, the weight loss of Ag-0 was approximately 76%, while the weight loss of Ag-IV was approximately 30%. At the end of the study, the weight losses of Ag-0, Ag-I, Ag-II, and Ag-III were approximately 80%, while that of Ag-IV was approximately 60%. The ATR-FTIR spectra of the coatings after degradation are shown in Figure 6F–J. The peaks corresponding to gelatin at 1,548 and 1,633 cm−1 flattened until day 7, which indicates that the gelatin dissolved more rapidly than the chitosan. After the first 7 days, the peaks corresponding to gelatin at 1,548 and 1,633 cm−1 became more obvious compared with the peaks at 7 days, suggesting that chitosan dissolved more rapidly than gelatin in the Ag-containing coatings after 7 days.
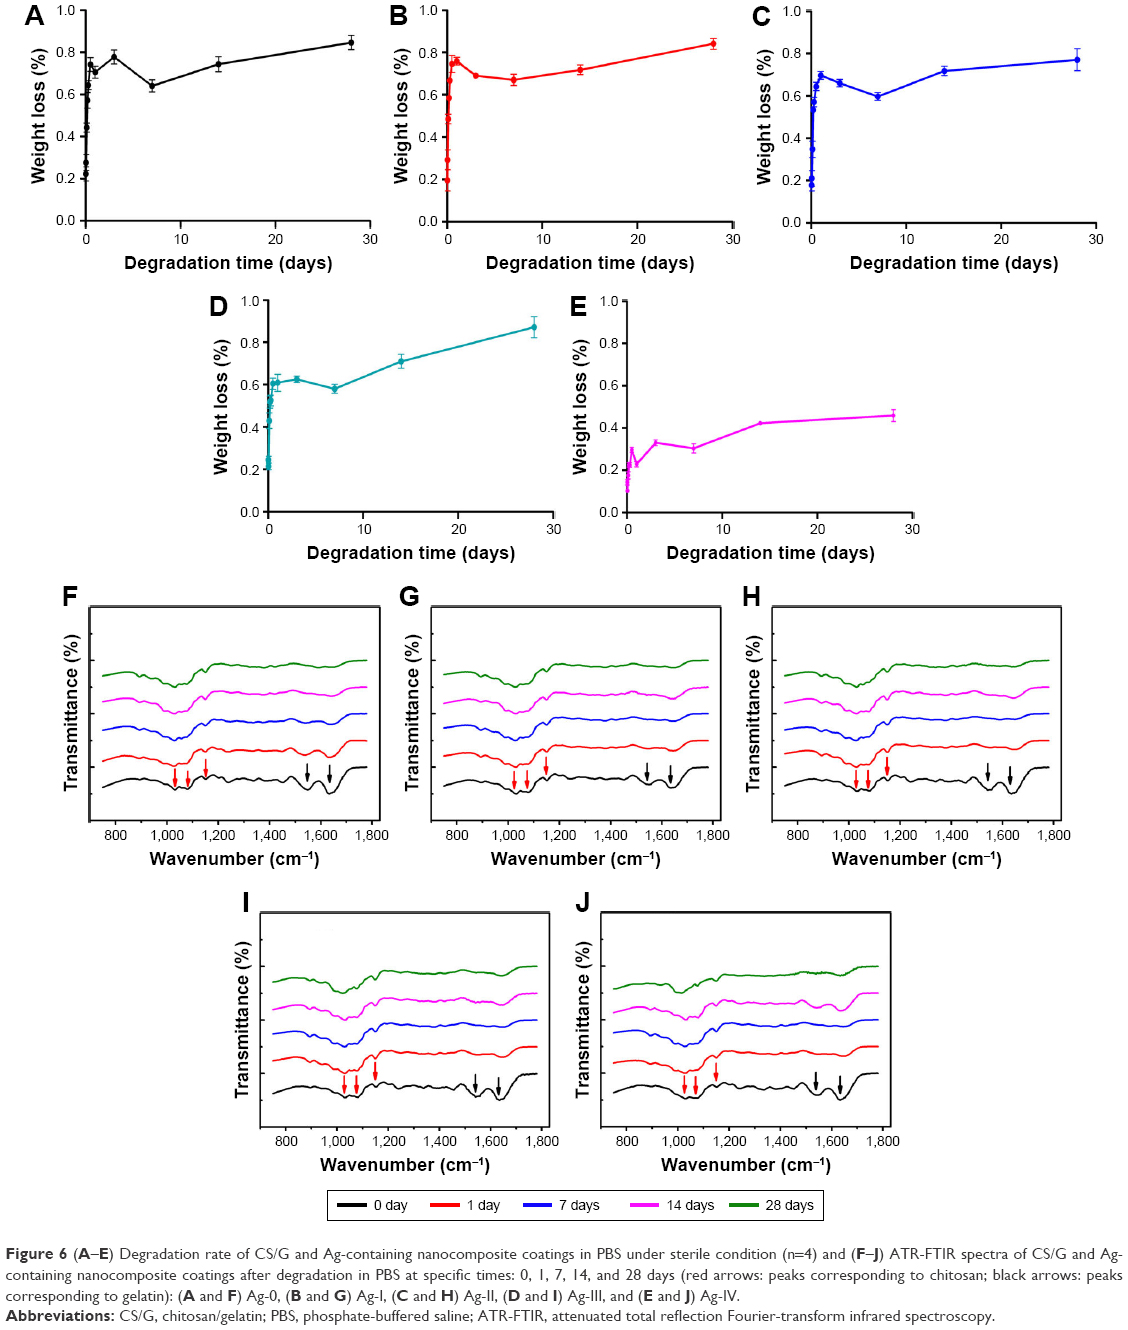 | Figure 6 (A–E) Degradation rate of CS/G and Ag-containing nanocomposite coatings in PBS under sterile condition (n=4) and (F–J) ATR-FTIR spectra of CS/G and Ag-containing nanocomposite coatings after degradation in PBS at specific times: 0, 1, 7, 14, and 28 days (red arrows: peaks corresponding to chitosan; black arrows: peaks corresponding to gelatin): (A and F) Ag-0, (B and G) Ag-I, (C and H) Ag-II, (D and I) Ag-III, and (E and J) Ag-IV. |
In vitro antibacterial activity
SEM images of bacteria adhered to the deposited coatings
Bacterial adhesion on the coatings was observed by SEM. After 18 h of culture in broth, the adhered bacteria showed typical morphology, that is, spherical S. aureus and rod-shaped E. coli. Additionally, a large number of layered S. aureus and E. coli attached and aggregated on the titanium surfaces coated with the Ag-0, Ag-I, and Ag-II films (Figure 7A1–C1 and A2–C2). No S. aureus or E. coli adhered to the Ag-III (Figure 7D1 and D2) and Ag-IV (Figure 7E1 and E2) surfaces.
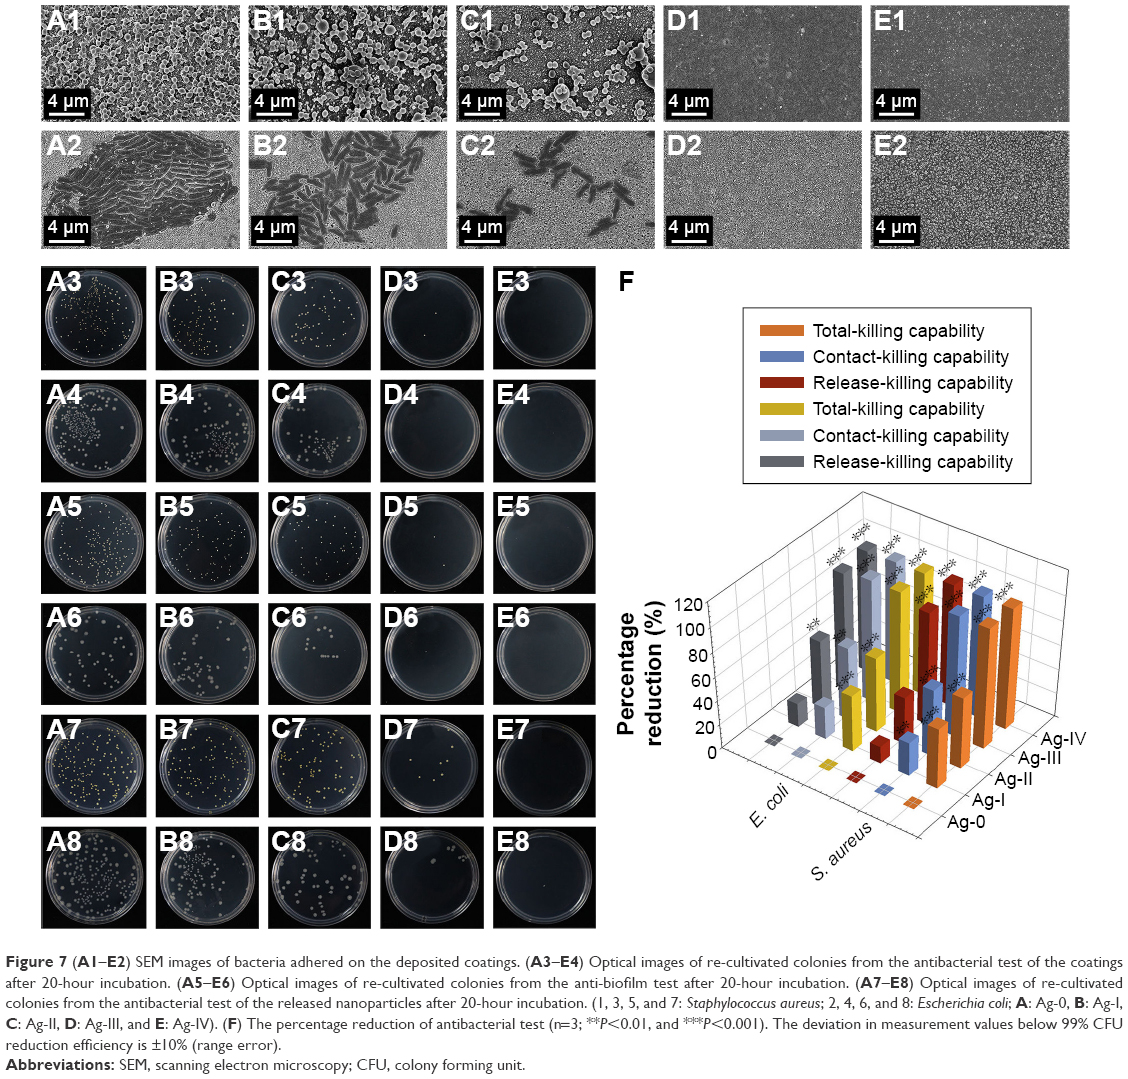 | Figure 7 (A1–E2) SEM images of bacteria adhered on the deposited coatings. (A3–E4) Optical images of re-cultivated colonies from the antibacterial test of the coatings after 20-hour incubation. (A5–E6) Optical images of re-cultivated colonies from the anti-biofilm test after 20-hour incubation. (A7–E8) Optical images of re-cultivated colonies from the antibacterial test of the released nanoparticles after 20-hour incubation. (1, 3, 5, and 7: Staphylococcus aureus; 2, 4, 6, and 8: Escherichia coli; A: Ag-0, B: Ag-I, C: Ag-II, D: Ag-III, and E: Ag-IV). (F) The percentage reduction of antibacterial test (n=3; **P<0.01, and ***P<0.001). The deviation in measurement values below 99% CFU reduction efficiency is ±10% (range error). |
Quantification of the antibacterial activity of the substrates
Total-killing capability
The coatings were cultured with bacterial suspensions. After 18 h, the suspensions were removed and spread onto agar plates in accordance with bacteria-counting methods (Figure 7A3–E3 and A4–E4). The reduction percentage was calculated, and the amount of S. aureus on Ag-I, Ag-II, Ag-III, and Ag-IV was found to be reduced by approximately 50.6%, 59.7%, 99.8%, and 100%, respectively (Figure 7F), while the amount of E. coli on Ag-I, Ag-II, Ag-III, and Ag-IV was found to be reduced by approximately 47.0%, 61.96%, 100%, and 100%, respectively (Figure 7F).
Contact-killing capability
To investigate the anti-biofilm capability of the deposited coatings, the adhered bacteria were detached from the coatings and re-cultured on agar plates in accordance with bacteria-counting methods (Figure 7A5–E5 and A6–E6). The amount of S. aureus on Ag-I, Ag-II, Ag-III, and Ag-IV was found to be reduced by approximately 28.3%, 55.9%, 99.9%, and 100%, respectively (Figure 7F), while the amount of E. coli on Ag-I, Ag-II, Ag-III, and Ag-IV was found to be reduced by approximately 26.72%, 60.35%, 100%, and 100%, respectively (Figure 7F).
Release-killing capability
The bacteria were cultured in the releasing liquid for 18 h and were then spread on agar plates to observe the antibacterial capacity of the released particles (Figures 7A7–E7 and A8–E8). The amount of S. aureus on Ag-I, Ag-II, Ag-III, and Ag-IV was found to be reduced by approximately 14.32%, 39.4%, 93.0%, and 100%, respectively (Figure 7F), while the amount of E. coli on Ag-I, Ag-II, Ag-III, and Ag-IV was found to be reduced by approximately 19.7%, 56.4%, 96.4%, and 100%, respectively (Figure 7F).
Visualization of the antibacterial activity of the substrates
The live-and-dead assay is an effective way to identify the living and dead bacteria based on the color change during the experiment. The green fluorescent SYTO 9 and red-fluorescent propidium iodide differ in their ability in penetrating bacterial cells. SYTO 9 is able to penetrate the cell membrane of both living and dead bacteria and stain nucleic acid with green fluorescence. Propidium iodide can only penetrate the dead bacteria with damaged membranes and fluoresce in red. As shown in Figure 8, a large amount of live S. aureus and E. coli are detected in group A. With the increase of Ag doped in coatings, the amount of green spots decreased, and red spots showed. Almost no green spots can be found in the images of group D and group E. This confirmed the results of the bacteria-counting method.
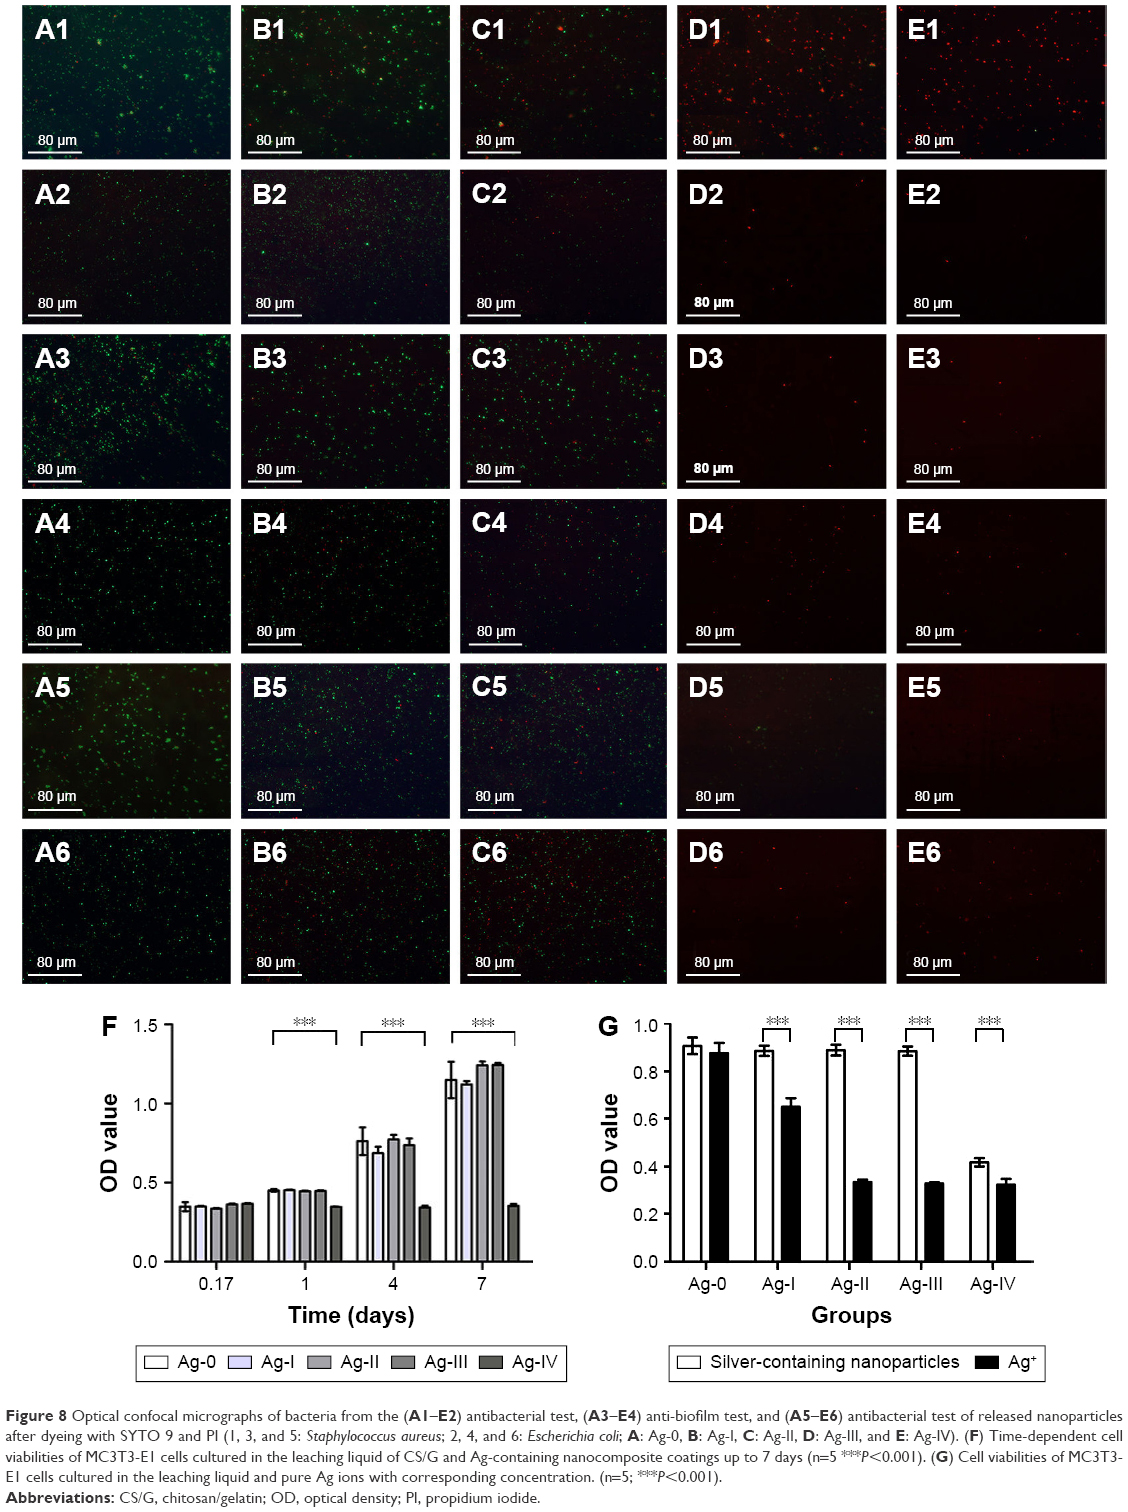 | Figure 8 Optical confocal micrographs of bacteria from the (A1–E2) antibacterial test, (A3–E4) anti-biofilm test, and (A5–E6) antibacterial test of released nanoparticles after dyeing with SYTO 9 and PI (1, 3, and 5: Staphylococcus aureus; 2, 4, and 6: Escherichia coli; A: Ag-0, B: Ag-I, C: Ag-II, D: Ag-III, and E: Ag-IV). (F) Time-dependent cell viabilities of MC3T3-E1 cells cultured in the leaching liquid of CS/G and Ag-containing nanocomposite coatings up to 7 days (n=5 ***P<0.001). (G) Cell viabilities of MC3T3-E1 cells cultured in the leaching liquid and pure Ag ions with corresponding concentration. (n=5; ***P<0.001). |
In vitro cellular study
The viability of MC3T3-E1 cells cultured in the extract liquid is shown in Figure 8A. The number of the cells steadily increased after 1, 4, and 7 days for all coatings except for Ag-IV. There were significant differences between Ag-IV and the other groups after 1, 4, and 7 days, which indicated the cytotoxicity of the specimens in this group.
CCK-8 tests were conducted for each group using the same concentration of Ag to compare the cytotoxicity of the Ag-containing nanoparticles released from the deposited coatings and pure Ag ions (Figure 8B). Differences were observed between the Ag-containing nanoparticles and the pure Ag ions. These results indicated that the cytotoxicity of the pure Ag ions was decreased after assembling with chitosan and gelatin via EPD.
Discussion
This work confirmed that Ag-containing CS/G coatings with efficient antibacterial properties and low cytotoxicity can be prepared using a green synthesis procedure on metal implant substrates. These coatings inhibited bacterial adhesion when proper amounts of Ag were used. The embedded sustainable Ag-containing CS/G nanoparticles can function as substitutes for antimicrobial AgNPs.
EPD was chosen to fabricate the coatings because of the mild deposition conditions. Chitosan and gelatin are naturally abundant polymers and were used as the polymer base to prepare the Ag-containing nanoparticles. Chitosan is a linear polysaccharide that has primary amino groups with pKa values near 6.5. In acidic solutions, the amino groups are protonated, and chitosan migrates toward the cathode and is deposited on the metal substrate when a charge is applied. In particular, as a cationic polyelectrolyte, chitosan enhances the adhesion of Ag-containing nanoparticles to the targeted bacterial cell membranes.30,35 Gelatin was selected to improve the biocompatibility and bond strength of the chitosan coating. Polyelectrolyte complexes form between the NH3+ ions of chitosan and the COO− ions of gelatin via electrostatic interactions.36 After the addition of Ag nitrate to the EPD solution, Ag ions interact with the amino and hydroxyl groups in chitosan, which is a known metal-chelating polymer.37 When a charge is applied, the chitosan–gelatin–Ag ion complex moves toward the cathode. The following chemical reaction occurs at the negative electrode: 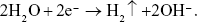 The generation of hydrogen results in the formation of a porous structure, as shown in the fluorescence images of the coatings (Figure 2A–D). The accumulation of hydroxyl ions creates an alkaline environment around the cathode, which makes chitosan non-soluble and results in the deposition of chitosan on the substrate with gelatin. Simultaneously, the available electrons reduce Ag ions to AgNPs, which are embedded in the polymer coating. As elaborated in the literature,38 chitosan controls AgNPs nucleation and protects these nanoparticles from agglomeration. Due to the use of HCl, the byproduct AgCl is generated from the interaction of the Ag ions with Cl− ions, as shown in the XRD patterns (Figure 3B).
The coated substrate was removed before the charge was turned off and dried at room temperature. The coatings were Ag-white in color and gradually turned brown in air (Figure 1), which suggested that although it was mixed with chitosan–gelatin polymer, the reduced Ag metal was gradually oxidized and transformed to Ag2O after exposure to air. The oxidation of Ag is thermodynamically favorable at room temperature  as has been observed for AgNPs, even in the presence of organic surfactants.39 Generally, AgNPs react to form Ag2O surface layers when exposed to oxygen.16 AgNPs with a smaller particle size are more susceptible to oxidation because of their lower redox potentials.20,40 Furthermore, other parameters, such as particle size, surface energy, type and concentration of oxidant, humidity, and coating composition, may affect the kinetics and extent of oxidation.19
The morphology and chemical compositions of the deposited coatings were analyzed to address this speculation. Fluorescence images of the coatings showed the formation of porous structures by the hydrogen that was generated at the cathode. However, no pores were observed in the freshly prepared Ag-IV group, which may have been due to the large amount of reduced Ag metal present in the coating.41 After the samples were fully dried in air, they were sputter-coated with gold and observed by FE-SEM. The FE-SEM images showed that nanoparticles appeared in the samples after the addition of Ag. Furthermore, the nanoparticle size decreased as the Ag content increased. These phenomena were confirmed in the cross-section images of the coatings, which showed that the nanoparticles were embedded in the fibrous and lamellar polymers. EDS was used to confirm that Ag was deposited in the coatings. The analyses confirmed the successful deposition of Ag in the Ag-II, Ag-III, and Ag-IV groups. However, Ag was not found in the Ag-I group, likely because the level of Ag was below the limit of detection of the EDS instrument.
The XPS results confirmed the presence of Ag in the coatings. However, because the Ag oxidation state could not be determined by XPS,33,42 the AP was used. Ag2O and AgCl were identified by peak-fit processing. Ag2O was derived from the oxidization of Ag metal in the coatings. AgCl was derived from the interaction between Ag and chloride ions in the EPD solution. The TEM images showed that the released nanoparticles in the Ag-added groups had core–shell-like structures. The core, with a strong contrast, was Ag2O/AgCl, and the shell, with a weak contrast, was a chitosan-and-gelatin complex. Therefore, the mechanism of Ag-loaded coatings fabricated via EPD has been illustrated in Scheme 1.
 | Scheme 1 Fabrication process of Ag-containing nanocomposite coating via EPD. Ag-containing nanoparticles were formed as shown in the SEM result. TEM results revealed a core–shell-like structure of the released nanoparticles. |
The sustainable release of Ag from the Ag-added groups into PBS, which would ensure continuous antibacterial activity, was observed by ICP-AES. The initial burst release may be attributed to Ag on the surface layers of the coatings, and the subsequent continuous release may be attributed to the physical degradation of chitosan by erosion and the dissolution of gelatin into PBS.
With respect to the coatings’ antibacterial properties, the deposited coatings for the Ag-III and Ag-IV groups inhibited bacterial adhesion and had release-killing ability. This antibacterial property was predominantly attributed to the Ag2O/AgCl-containing CS/G nanoparticles. Ag2O can dissolve in pure water and release Ag ions. Minimally soluble AgCl provides a slower release of Ag ions.27,42,43 Once released into the liquid environment, Ag ions have an antibacterial effect.32 Choi et al showed that the inhibition of microbial growth by AgCl colloids can be as effective as Ag ions depending on the particle size and bioavailability.44 Chitosan, as a cationic polyelectrolyte co-released with Ag2O/AgCl from the coatings, promotes the adhesion of Ag2O/AgCl to the targeted bacterial cell membranes and enhances the antibacterial activity.45
Finally, the potential cytotoxicity of the released nanoparticles was investigated. Only Ag-IV group showed cytotoxicity to MC3T3-E1 cells, which may have been caused by the burst release of Ag in Ag-IV group. The released Ag-containing nanoparticles had decreased cytotoxicity against MC3T3-E1 cells compared with pure Ag nitrate. There were two possible reasons for this phenomenon. First, the sustainable release of Ag ions from the nanoparticles reduced their accumulation and thereby their cytotoxicity. Second, the combination of the released Ag ions with chitosan reduced the cytotoxicity.46
Conclusion
Antimicrobial nanocomposite coatings, composed of a degradable CS/G polymer base and loaded with Ag compound (Ag2O/AgCl), were deposited on metal implants via EPD. These Ag-containing nanoparticles had bactericidal activity through the release of Ag ions from Ag2O and AgCl. Chitosan, a cationic polyelectrolyte, enhanced the adhesion of these environmentally benign Ag-containing nanoparticles to the cell membranes of targeted bacteria. The initial burst release of Ag ions from these coatings killed and prevented the initial adhesion of S. aureus and E. coli while exhibiting relatively low cytotoxicity to healthy cells compared with pure Ag ions. These Ag-containing nanocomposite coatings on metal implants produced by EPD have the potential to reduce implant-associated infections.
Acknowledgments
This work was financially supported by the National Natural Science Foundation of China (No 81470771) and the Fundamental Research Funds for the Central Universities (No 2042014kf00232 and 2042015kf0109).
Author contributions
All authors contributed toward data analysis, drafting and critically revising the paper and agree to be accountable for all aspects of the work.
Disclosure
The authors report no conflicts of interest in this work.
References
Hetrick EM, Schoenfisch MH. Reducing implant-related infections: active release strategies. Chem Soc Rev. 2006;35(9):780–789. | ||
Zhao L, Chu PK, Zhang Y, Wu Z. Antibacterial coatings on titanium implants. J Biomed Mater Res B Appl Biomater. 2009;91(1):470–480. | ||
ter Boo GJ, Grijpma DW, Moriarty TF, Richards RG, Eglin D. Antimicrobial delivery systems for local infection prophylaxis in orthopedic- and trauma surgery. Biomaterials. 2015;52:113–125. | ||
Lara HH, Garza-Treviño EN, Ixtepan-Turrent L, Singh DK. Silver nanoparticles are broad-spectrum bactericidal and virucidal compounds. J Nanobiotechnology. 2011;9:30. | ||
Panácek A, Kolár M, Vecerová R, et al. Antifungal activity of silver nanoparticles against Candida spp. Biomaterials. 2009;30(31):6333–6340. | ||
Panacek A, Kvitek L, Prucek R, et al. Silver colloid nanoparticles: synthesis, characterization, and their antibacterial activity. J Phys Chem B. 2006;110(33):16248–16253. | ||
Geilich BM, van de Ven AL, Singleton GL, Sepúlveda LJ, Sridhar S, Webster TJ. Silver nanoparticle-embedded polymersome nanocarriers for the treatment of antibiotic-resistant infections. Nanoscale. 2015;7(8):3511–3519. | ||
Qin H, Cao H, Zhao Y, et al. In vitro and in vivo anti-biofilm effects of silver nanoparticles immobilized on titanium. Biomaterials. 2014;35(33):9114–9125. | ||
Morones JR, Elechiguerra JL, Camacho A, et al. The bactericidal effect of silver nanoparticles. Nanotechnology. 2005;16(10):2346–2353. | ||
Rai M, Yadav A, Gade A. Silver nanoparticles as a new generation of antimicrobials. Biotechnol Adv. 2009;27(1):76–83. | ||
Shayesteh TH, Khajavi F, Ghasemi H, Zijoud SMH, Ranjbar A. Effects of silver nanoparticle (Ag NP) on oxidative stress, liver function in rat: hepatotoxic or hepatoprotective? Issues Biol Sci Pharm Res. 2014;2(5):040–044. | ||
Huang CL, Hsiao IL, Lin HC, Wang CF, Huang YJ, Chuang CY. Silver nanoparticles affect on gene expression of inflammatory and neurodegenerative responses in mouse brain neural cells. Environ Res. 2015;136:253–263. | ||
Arai Y, Miyayama T, Hirano S. Difference in the toxicity mechanism between ion and nanoparticle forms of silver in the mouse lung and in macrophages. Toxicology. 2015;328:84–92. | ||
Rinna A, Magdolenova Z, Hudecova A, Kruszewski M, Refsnes M, Dusinska M. Effect of silver nanoparticles on mitogen-activated protein kinases activation: role of reactive oxygen species and implication in DNA damage. Mutagenesis. 2015;30(1):59–66. | ||
Lee YH, Cheng FY, Chiu HW, et al. Cytotoxicity, oxidative stress, apoptosis and the autophagic effects of silver nanoparticles in mouse embryonic fibroblasts. Biomaterials. 2014;35(16):4706–4715. | ||
Wu Y, Zhou Q, Li H, Liu W, Wang T, Jiang G. Effects of silver nanoparticles on the development and histopathology biomarkers of Japanese medaka (Oryzias latipes) using the partial-life test. Aquat Toxicol. 2010;100(2):160–167. | ||
Fabrega J, Luoma SN, Tyler CR, Galloway TS, Lead JR. Silver nanoparticles: behaviour and effects in the aquatic environment. Environ Int. 2011;37(2):517–531. | ||
Yin J, Yang Y, Hu Z, Deng B. Attachment of silver nanoparticles (AgNPs) onto thin-film composite (TFC) membranes through covalent bonding to reduce membrane biofouling. J Membr Sci. 2013;441:73–82. | ||
Richter AP, Brown JS, Bharti B, et al. An environmentally benign antimicrobial nanoparticle based on a silver-infused lignin core. Nat Nanotechnol. 2015;10(9):817–823. | ||
Zhang P, Shao C, Zhang Z, et al. In situ assembly of well-dispersed Ag nanoparticles (AgNPs) on electrospun carbon nanofibers (CNFs) for catalytic reduction of 4-nitrophenol. Nanoscale. 2011;3(8):3357–3363. | ||
Anastas P, Eghbali N. Green chemistry: principles and practice. Chem Soc Rev. 2010;39(1):301–312. | ||
Cai X, Ma K, Zhou Y, Jiang T, Wang Y. Surface functionalization of titanium with tetracycline loaded chitosan–gelatin nanosphere coatings via EPD: fabrication, characterization and mechanism. RSC Adv. 2016;6(9):7674–7682. | ||
Cai X, Cai J, Ma K, et al. Fabrication and characterization of Mg-doped chitosan-gelatin nanocompound coatings for titanium surface functionalization. J Biomater Sci Polym Ed. 2016;27(10):954–971. | ||
Ma K, Huang D, Cai J, et al. Surface functionalization with strontium-containing nanocomposite coatings via EPD. Colloids Surf B Biointerfaces. 2016;146:97–106. | ||
Gunawan C, Teoh WY, Marquis CP, Lifia J, Amal R. Reversible antimicrobial photoswitching in nanosilver. Small. 2009;5(3):341–344. | ||
Muñoz-Bonilla A, Fernández-García M. Polymeric materials with antimicrobial activity. Prog Polym Sci. 2012;37(2):281–339. | ||
Chernousova S, Epple M. Silver as antibacterial agent: ion, nanoparticle, and metal. Angew Chem Int Ed Engl. 2013;52(6):1636–1653. | ||
Xiu ZM, Zhang QB, Puppala HL, Colvin VL, Alvarez PJ. Negligible particle-specific antibacterial activity of silver nanoparticles. Nano Lett. 2012;12(8):4271–4275. | ||
Sahayaraj K, Roobadevi M, Rajesh S, Azizi S. Vernonia cinerea (L.) Less. silver nanocomposite and its antibacterial activity against a cotton pathogen. Res Chem Intermed. 2015;41(8):5495–5507. | ||
Yang C, Ding X, Ono RJ, et al. Brush-like polycarbonates containing dopamine, cations, and PEG providing a broad-spectrum, antibacterial, and antifouling surface via one-step coating. Adv Mater. 2014;26(43):7346–7351. | ||
Jiang T, Zhang Z, Zhou Y, et al. Surface functionalization of titanium with chitosan/gelatin via electrophoretic deposition: characterization and cell behavior. Biomacromolecules. 2010;11(5):1254–1260. | ||
Levard C, Hotze EM, Lowry GV, Brown GE Jr. Environmental transformations of silver nanoparticles: impact on stability and toxicity. Environ Sci Technol. 2012;46(13):6900–6914. | ||
Kaushik VK. XPS core level spectra and Auger parameters for some silver compounds. J Electron Spectrosc Relat Phenom. 1991;56(3):273–277. | ||
Verstraete M, Dumont J, Mirabella F, et al. Electronic structure of Ag–Pd heterostructures. Comput Mater Sci. 2004;30(1–2):34–43. | ||
Fang B, Jiang Y, Rotello VM, Nüsslein K, Santore MM. Easy come easy go: surfaces containing immobilized nanoparticles or isolated polycation chains facilitate removal of captured Staphylococcus aureus by retarding bacterial bond maturation. ACS Nano. 2014;8(2):1180–1190. | ||
Sinha VR, Singla AK, Wadhawan S, et al. Chitosan microspheres as a potential carrier for drugs. Int J Pharm. 2004;274(1–2):1–33. | ||
Huang H, Yuan Q, Yang X. Preparation and characterization of metal–chitosan nanocomposites. Colloids Surf B Biointerfaces. 2004;39(1–2):31–37. | ||
Pishbin F, Mouriño V, Gilchrist JB, et al. Single-step electrochemical deposition of antimicrobial orthopaedic coatings based on a bioactive glass/chitosan/nano-silver composite system. Acta Biomater. 2013;9(7):7469–7479. | ||
Henglein A. Physicochemical properties of small metal particles in solution: “microelectrode” reactions, chemisorption, composite metal particles, and the atom-to-metal transition. J Phys Chem. 1993;97(21):5457–5471. | ||
Ho CM, Yau SK, Lok CN, So MH, Che CM. Oxidative dissolution of silver nanoparticles by biologically relevant oxidants: a kinetic and mechanistic study. Chem Asian J. 2010;5(2):285–293. | ||
Cui F, Qian F, Zhao Z, Yin L, Tang C, Yin C. Preparation, characterization, and oral delivery of insulin loaded carboxylated chitosan grafted poly(methyl methacrylate) nanoparticles. Biomacromolecules. 2009;10(5):1253–1258. | ||
Ferraria AM, Carapeto AP, do Rego AMB. X-ray photoelectron spectroscopy: silver salts revisited. Vacuum. 2012;86:1988–1991. | ||
Sambhy V, MacBride MM, Peterson BR, Sen A. Silver bromide nanoparticle/polymer composites: dual action tunable antimicrobial materials. J Am Chem Soc. 2006;128(30):9798–9808. | ||
Choi O, Deng KK, Kim NJ, Ross L Jr, Surampalli RY, Hu Z. The inhibitory effects of silver nanoparticles, silver ions, and silver chloride colloids on microbial growth. Water Res. 2008;42(12):3066–3074. | ||
Marta B, Potara M, Iliut M, et al. Designing chitosan–silver nanoparticles–graphene oxide nanohybrids with enhanced antibacterial activity against Staphylococcus aureus. Colloids Surf A Physicochem Eng Asp. 2015;487:113–120. | ||
Boca SC, Potara M, Gabudean AM, Juhem A, Baldeck PL, Astilean S. Chitosan-coated triangular silver nanoparticles as a novel class of biocompatible, highly effective photothermal transducers for in vitro cancer cell therapy. Cancer Lett. 2011;311(2):131–140. |
 © 2017 The Author(s). This work is published and licensed by Dove Medical Press Limited. The
full terms of this license are available at https://www.dovepress.com/terms
and incorporate the Creative Commons Attribution
- Non Commercial (unported, 3.0) License.
By accessing the work you hereby accept the Terms. Non-commercial uses of the work are permitted
without any further permission from Dove Medical Press Limited, provided the work is properly
attributed. For permission for commercial use of this work, please see paragraphs 4.2 and 5 of our Terms.
© 2017 The Author(s). This work is published and licensed by Dove Medical Press Limited. The
full terms of this license are available at https://www.dovepress.com/terms
and incorporate the Creative Commons Attribution
- Non Commercial (unported, 3.0) License.
By accessing the work you hereby accept the Terms. Non-commercial uses of the work are permitted
without any further permission from Dove Medical Press Limited, provided the work is properly
attributed. For permission for commercial use of this work, please see paragraphs 4.2 and 5 of our Terms.